Stock market week in review, Oct. 26–30, 2026: Alphabet and Intel sink tech, the average stock wins October
S&P 500 7,580.07 (−0.57% on the week, −1.82% on Friday). Nasdaq 25,437.00 (−2.00%). Dow 51,770.31 (−0.85%). Alphabet fell 12.64% on Thursday, its worst day since its 2004 listing; Intel 28.58% on Friday. In October the equal-weight S&P 500 beat the index by 5.83 points.

· 11 min read
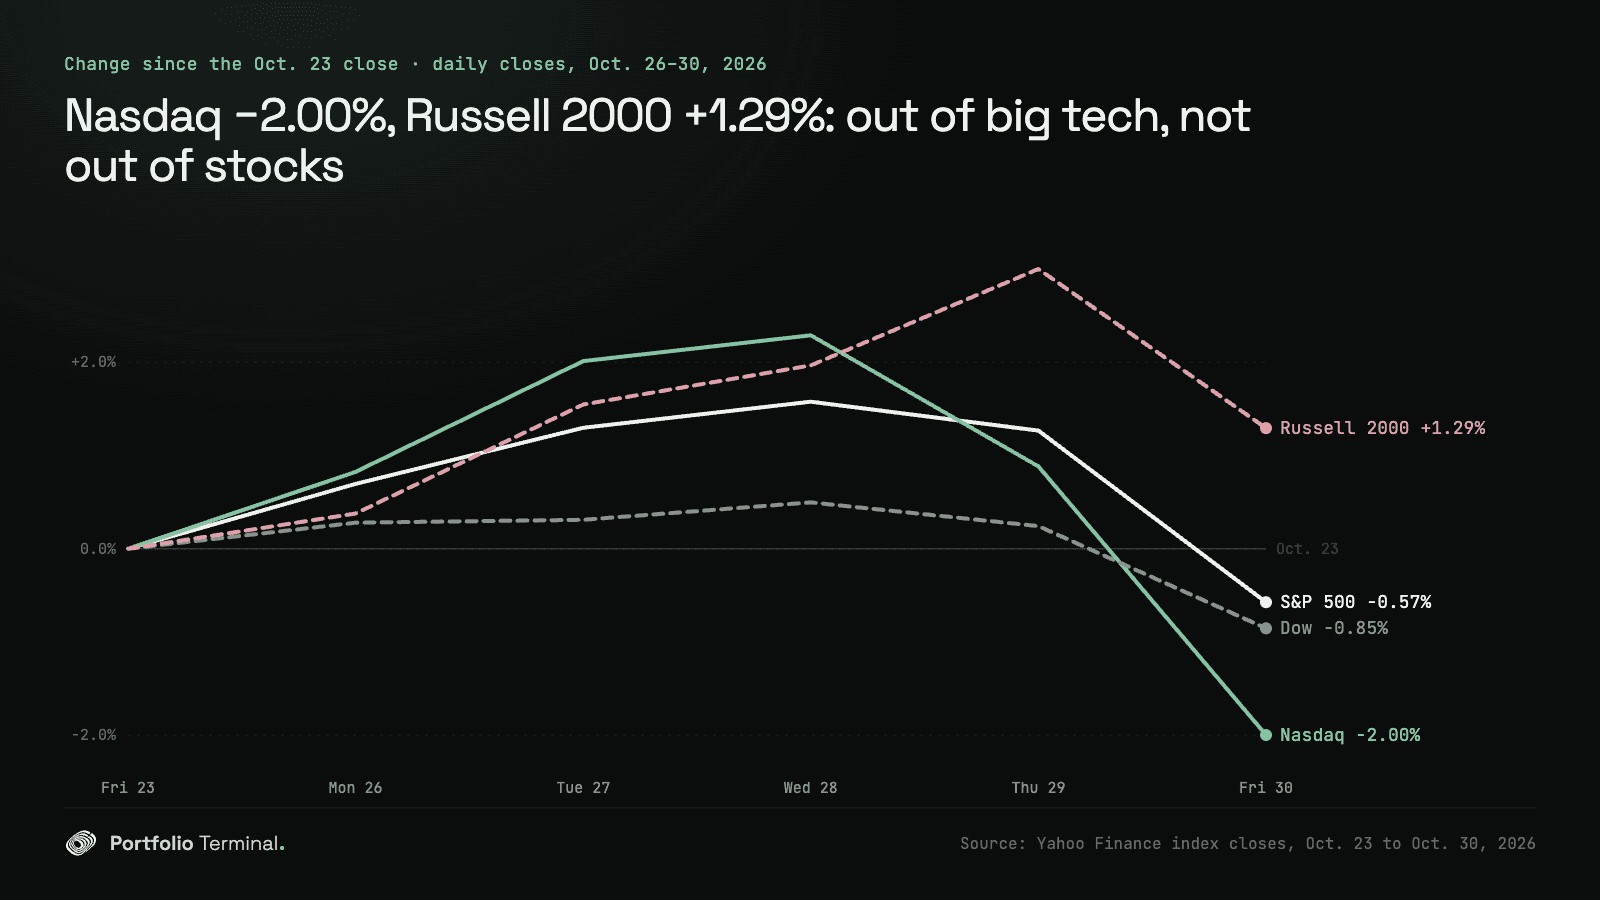
Week of Monday, October 26 to Friday, October 30, 2026. The S&P 500 closed Friday at 7,580.07, down 0.57% on the week and 1.82% on the day, its worst session since June 5, 2026. Alphabet fell 12.64% on Thursday, its worst day since its 2004 listing, and Intel 28.58% on Friday.
The money that left the largest companies stayed in the market. In October the S&P 500 fell 0.93% and the Nasdaq 5.30%, its worst month since March 2025, while the average S&P 500 stock rose 4.90%. That gap, 5.83 points, is the widest since April 2009.
The scorecard
| Close | Oct. 23 | Oct. 30 | Week |
|---|---|---|---|
| S&P 500 | 7,623.68 | 7,580.07 | −0.57% |
| Nasdaq | 25,955.34 | 25,437.00 | −2.00% |
| Dow | 52,215.16 | 51,770.31 | −0.85% |
| Russell 2000 | 2,775.90 | 2,811.84 | +1.29% |
| S&P 500 Equal Weight | 8,772.37 | 8,842.30 | +0.80% |
| PHLX Semiconductor (SOX) | 10,779.46 | 10,688.80 | −0.84% |
| 10-year yield | 4.988% | 4.929% | −0.059 |
| VIX | 19.45 | 19.42 | −0.03 |
| Dollar index (DXY) | 101.81 | 101.88 | +0.07% |
| WTI crude, Dec. 2026 | $103.27 | $104.12 | +0.82% |
| Brent crude, Dec. 2026 | $116.72 | $117.64 | +0.79% |
On Friday alone the S&P 500 fell 1.82%, the Nasdaq 2.86% and the Dow 1.09%. Year to date the S&P 500 is up 10.7%, the Nasdaq 9.4%, the Dow 7.7% and the Russell 2000 13.3%. The S&P 500 closed 3.05% under its record close of October 6, 2026. Every close, session by session: the stock market close · S&P 500 · Nasdaq · Dow · Russell 2000 · VIX.
Four AI spenders put $201.9 billion into one quarter
Three of the largest US companies reported on Wednesday and Thursday evenings, and Meta Platforms had reported the week before. We put the same two lines of their four cash-flow statements side by side: the cash their operations brought in from July to September 2026, and what they paid for property and equipment. Amazon's release says its increase "primarily reflects investments in artificial intelligence."
| Company, $ billions | Cash from operations | Property and equipment | Left over | Left over a year earlier |
|---|---|---|---|---|
| Alphabet (GOOGL) | 42.3 | 51.4 | −9.1 | +24.5 |
| Microsoft (MSFT) | 58.0 | 39.4 | +18.6 | +25.7 |
| Amazon (AMZN) | 42.4 | 77.3 | −34.8 | +0.4 |
| Meta Platforms (META) | 32.8 | 33.9 | −1.2 | +11.2 |
| The four | 175.5 | 201.9 | −26.4 | +61.7 |
Their spending rose 107.6% in a year; the cash from their operations rose 10.4%. A year ago the four had $61.7 billion left after paying for their buildings and machines. This quarter they were $26.4 billion short, and three of the four spent more than their operations brought in. Microsoft is the exception.
The market sorted them by that line. Alphabet reported revenue up 25% to $127.6 billion and Google Cloud up 103% to $30.7 billion. Diluted earnings still fell to $2.12 a share, from $2.87, because other income swung from a gain of $12.8 billion to a loss of $8.2 billion. The release also shows Alphabet sold $12.4 billion of new shares in the quarter. On Thursday the stock fell 12.64%, its worst day in the Yahoo Finance record that starts with its August 2004 listing, and 12.61% on the week, its worst week since August 19, 2011. See the Alphabet analysis.
Microsoft, the one with cash left over, reported revenue up 19% to $92.3 billion and Azure up 48%. It fell 0.16% on Thursday, less than the S&P 500's 0.30%. Amazon reported sales up 12% to $201.9 billion and AWS up 39%; its free cash flow over twelve months was an outflow of $42.4 billion, against an inflow of $14.8 billion a year earlier. It fell 1.41% on Friday, less than the S&P 500 that day.
Intel's worst day since at least 1980, and chips' worst since June
Intel (INTC) reported third-quarter revenue up 21% to $16.5 billion on Thursday evening and forecast $15.0–16.0 billion for the fourth quarter. Its finance chief, David Zinsner, said "we see the PC slowdown continuing at least through the first half of next year." On Friday the stock fell 28.58%, its worst day since at least March 1980, where Yahoo Finance's daily record begins.
Chips went with it. The PHLX Semiconductor Index fell 7.20% on Friday, its worst day since June 23, 2026, after rising 2.82%, 3.60% and 1.75% from Monday to Wednesday. Sandisk (SNDK), which reported the same evening, fell 13.47%, AMD 10.88%, Broadcom 5.48% and Nvidia 4.22%. The index ended the week down 0.84% and October down 15.36%. The eight listed neoclouds had their own Friday: CoreWeave fell 9.66%.
The other big losses of Friday came from results too. Reddit (RDDT) fell 29.22%, Twilio (TWLO) 15.24% and Coinbase (COIN) 10.62%, Coinbase the day after the outflows from Binance we followed on Thursday (was Binance hacked?).
180 S&P 500 companies reported, and the median stock rose
We found every S&P 500 company that filed its results with the SEC this week, by the 8-K it files on EDGAR (item 2.02), and measured each stock from its last close before the filing to the close of the first session that traded on it. That is 180 companies, 36.6% of the index by weight. 100 rose and 80 fell; the median moved +0.99%, and 108 did better than the S&P 500 the same session.
The ten largest:
| Company | Session that traded on the results | Stock | S&P 500, same session |
|---|---|---|---|
| Microsoft (MSFT) | Thu., Oct. 29 | −0.16% | −0.30% |
| Alphabet (GOOGL) | Thu., Oct. 29 | −12.64% | −0.30% |
| Amazon (AMZN) | Fri., Oct. 30 | −1.41% | −1.82% |
| Eli Lilly (LLY) | Thu., Oct. 29 | +6.63% | −0.30% |
| Exxon Mobil (XOM) | Fri., Oct. 30 | +2.16% | −1.82% |
| Visa (V) | Wed., Oct. 28 | −0.31% | +0.28% |
| AbbVie (ABBV) | Fri., Oct. 30 | +1.41% | −1.82% |
| Mastercard (MA) | Thu., Oct. 29 | +4.16% | −0.30% |
| Intel (INTC) | Fri., Oct. 30 | −28.58% | −1.82% |
| Chevron (CVX) | Fri., Oct. 30 | +1.75% | −1.82% |
15 stocks fell 10% or more on their results, and they were mostly technology and software: Reddit −29.22%, Intel −28.58%, ServiceNow (NOW) −26.95%, F5 (FFIV) −20.43%, Fortinet (FTNT) −20.09%. 11 rose 10% or more, led by Vertiv (VRT) +16.48%, which sells the power and cooling gear data centers buy, and Gen Digital (GEN) +15.81%; Regeneron (REGN) rose +13.33%. Eli Lilly rose +6.63% and Mastercard +4.16% on a day the S&P 500 fell. Boeing (BA) fell 10.69% and Caterpillar (CAT) 9.25%. In our study of 1,476 US earnings reports, 47.3% of the companies that beat forecasts closed lower the next session: a good quarter is not a rising stock.
The average stock beat the index by 5.83 points in October
The S&P 500 weighs companies by size: the four spenders above were 17.46% of the iShares Core S&P 500 ETF on October 16, 2026, by the issuer's file. The S&P 500 Equal Weight Index gives each company the same weight. This week it rose 0.80% while the S&P 500 fell 0.57%, and over October it rose 4.90% against the S&P 500's −0.93%. A gap this wide has not happened since April 2009, in Yahoo's record of the equal-weight index since December 2006. 321 of its 500 companies rose this week.
The funds show it the way most people hold it:
| Fund | Week | October |
|---|---|---|
| Schwab US Dividend Equity (SCHD) | +1.45% | +9.99% |
| Invesco S&P 500 Equal Weight (RSP) | +0.82% | +4.95% |
| iShares Russell 2000 (IWM) | +1.30% | +0.52% |
| JPMorgan Equity Premium Income (JEPI) | +1.25% | +2.38% |
| iShares 20+ Year Treasury Bond (TLT) | +0.61% | +5.22% |
| Vanguard Total Bond Market (BND) | +0.51% | +2.01% |
| Vanguard Total Stock Market (VTI) | −0.39% | −0.71% |
| Vanguard S&P 500 (VOO) | −0.54% | −0.86% |
| Vanguard Total International Stock (VXUS) | −0.19% | −3.05% |
| VanEck Semiconductor (SMH) | −0.89% | −14.21% |
| Invesco QQQ (Nasdaq-100) | −1.97% | −6.66% |
| SPDR Gold Shares (GLD) | −2.95% | −6.58% |
Price change, from Yahoo Finance closes; none of these funds went ex-dividend during the week. In October the dividend fund beat the Nasdaq-100 fund by 16.65 points. Health care (XLV) closed at a record on Thursday and again on Friday, at $184.87, and rose 9.77% in October. Exxon Mobil closed at a record on Monday and again on Friday, at $187.25, and Chevron at $235.52 the same day, both after reporting.
If you hold an S&P 500 fund and a Nasdaq-100 fund, this is the month that shows how much of the same few companies you own twice: is my portfolio diversified? walks through it, and the X-ray does it on your own funds.
The Fed held, two wanted a hike, and the 10-year fell to 4.929%
The Federal Reserve kept its rate at 3.75%–4.00% on Wednesday. The vote was 10–2: Lisa D. Cook and Beth M. Hammack wanted to raise the target range by 1/4 percentage point. The statement said economic activity "is expanding at a strong pace" and that "inflation remains elevated."
The numbers came the next morning. The Commerce Department put third-quarter growth at 3.4% at an annual rate, up from 2.2%. Prices measured by the PCE index, the one the Fed targets, rose 0.5% in September and 3.6% over a year; without food and energy, 0.3% and 3.1%.
Bonds rallied anyway. The 10-year Treasury yield closed at 5.045% on Wednesday, then 4.989% and 4.929% as stocks fell, its lowest close since September 9, 2026. On the Treasury's own yield curve the 10-year ended the week at 4.94% and the 2-year at 4.56%, from 4.69% a week earlier. The whole curve is on Treasury yields today.
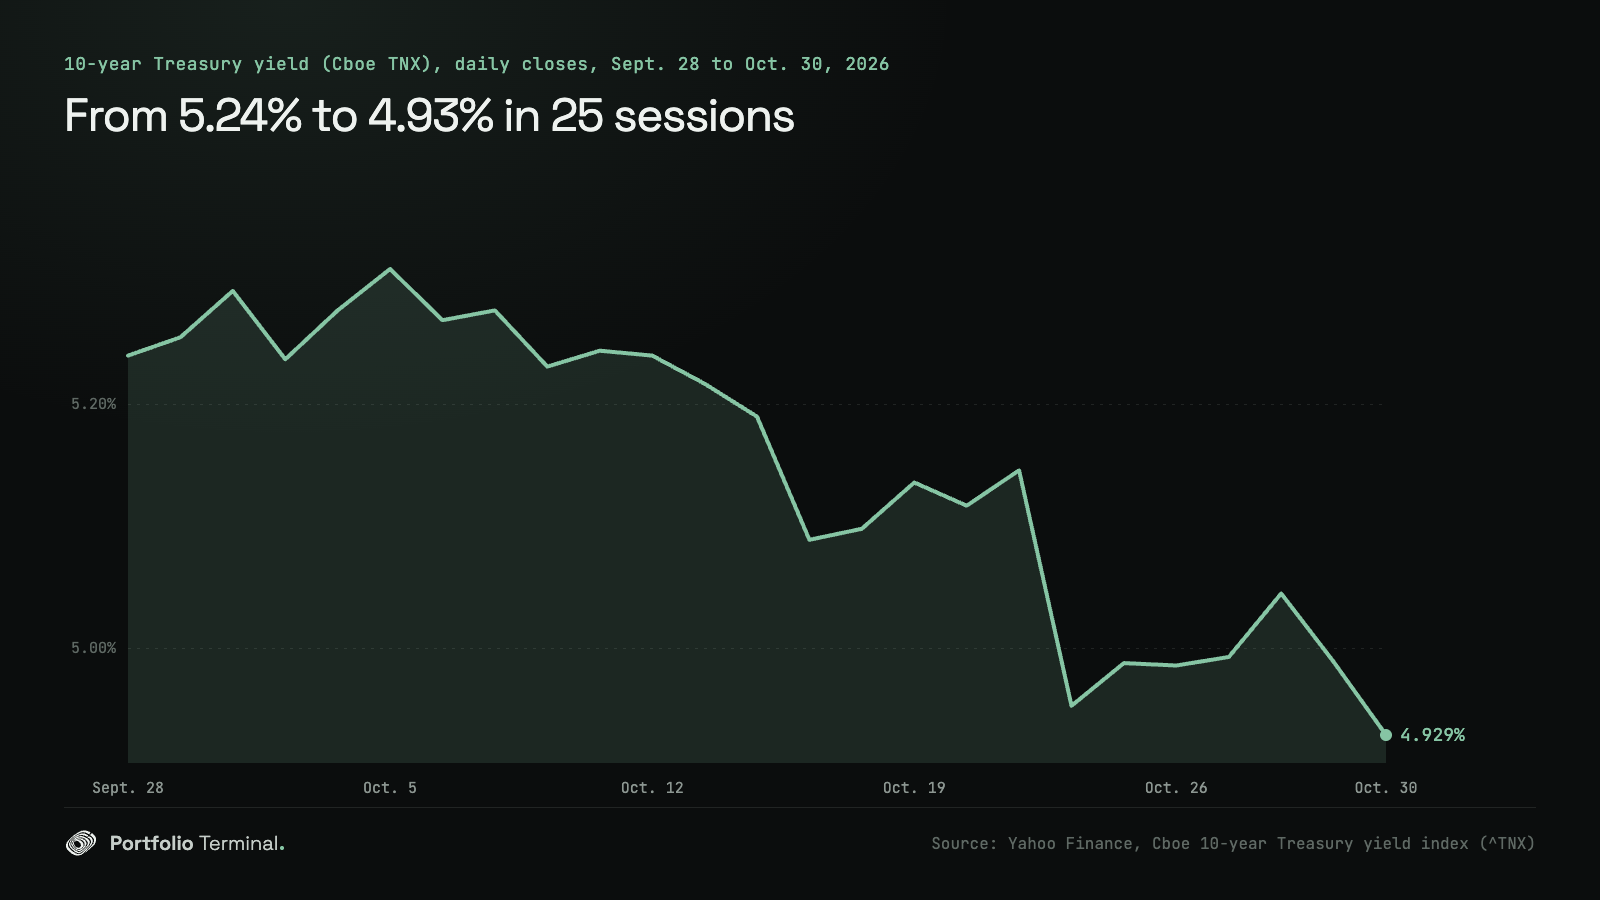
Inflation at 3% or more is the line to watch for stocks: in the 20 times since 1963 the 10-year rose a point or more in a year, the S&P 500 ended lower 7 times, all 7 with consumer prices up 3% or more, and core prices too (do stocks fall when bond yields rise?, September's CPI). This week yields fell as stocks did: money went into bonds, not out of them.
What carried the index
- Tesla (TSLA) +7.41% on the week to $399.81, −0.87% on Friday
- Broadcom (AVGO) +1.37% on the week to $326.08, −5.48% on Friday
- Microsoft (MSFT) −0.50% on the week to $521.91, −1.55% on Friday
- Apple (AAPL) −0.89% on the week to $344.63, −1.23% on Friday
- Nvidia (NVDA) −3.00% on the week to $204.64, −4.22% on Friday
- Amazon (AMZN) −3.08% on the week to $240.35, −1.41% on Friday
- Meta (META) −4.30% on the week to $614.99, −1.53% on Friday
- Alphabet (GOOGL) −12.61% on the week to $279.84, −1.40% on Friday
Of these eight, only Tesla and Broadcom rose. Tesla gained 5.21% on Monday and 4.04% on Tuesday and gave a little back after. Broadcom rose from Monday to Wednesday, slipped on Thursday and lost 5.48% with the other chipmakers on Friday.
The sectors
- Health care (XLV) +3.12%
- Materials (XLB) +2.79%
- Utilities (XLU) +2.04%
- Consumer discretionary (XLY) +2.02%
- Industrials (XLI) +1.69%
- Real estate (XLRE) +1.41%
- Consumer staples (XLP) +1.31%
- Financials (XLF) +1.09%
- Energy (XLE) +1.00%
- Technology (XLK) −2.03%
- Communication (XLC) −5.32%
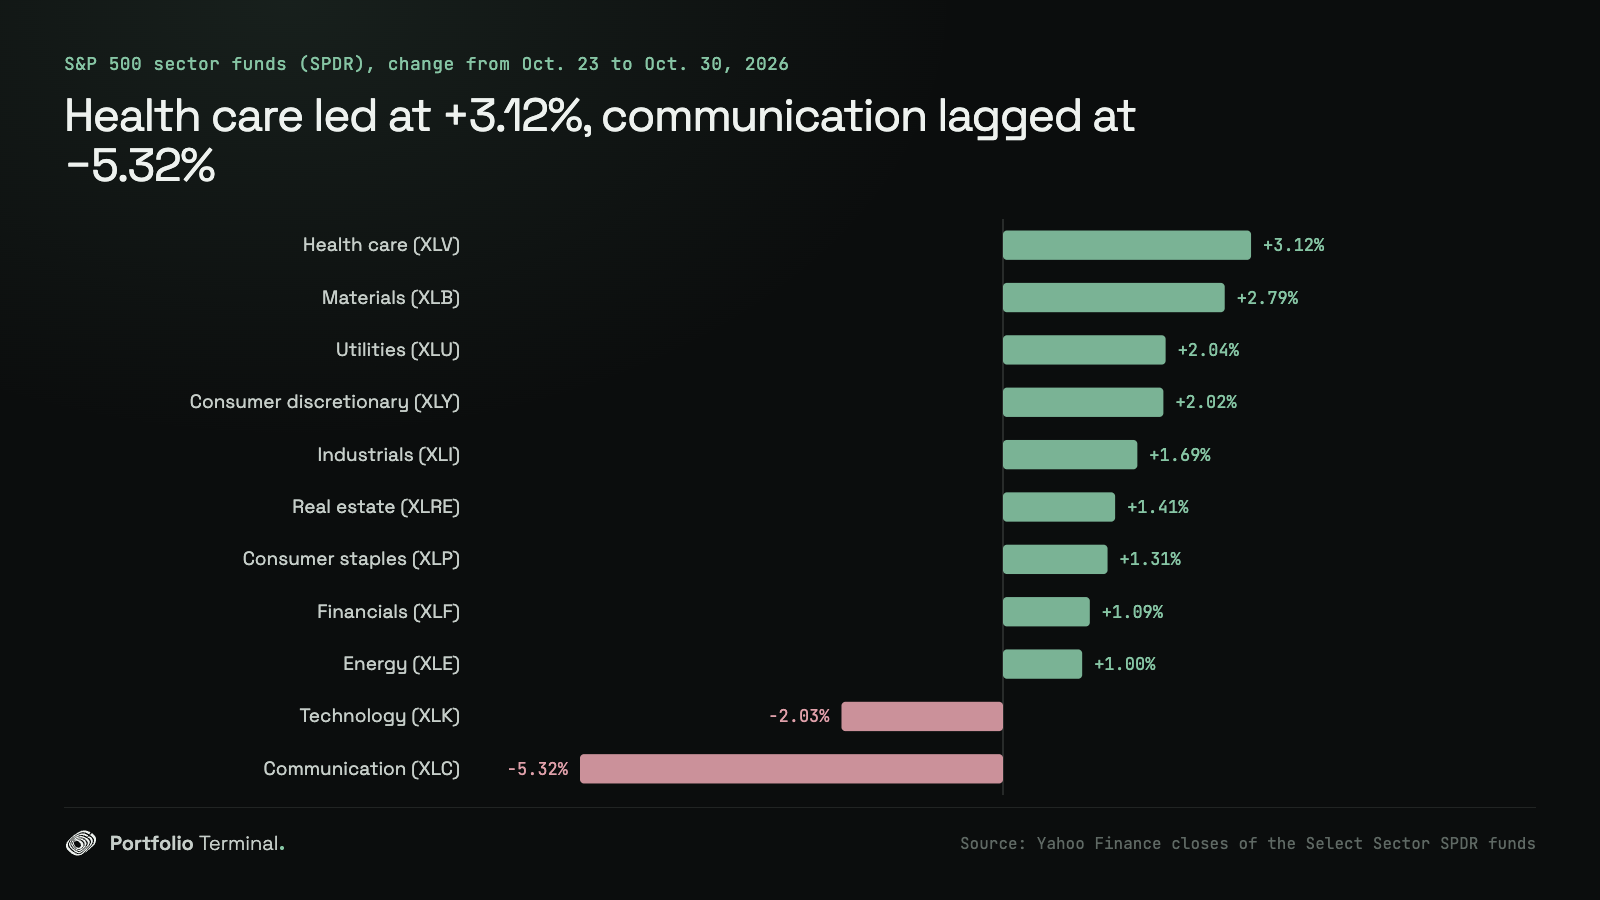
Nine sectors of eleven rose. The two that fell hold the AI spenders: Alphabet and Meta in communication services, which had its worst week since April 4, 2025, and the chipmakers and Microsoft in technology, which lost 4.89% on Friday alone, its worst day since June 5, 2026.
Day by day: every close from October 26 to October 30, 2026
| Session | S&P 500 | Nasdaq Composite | Dow | Russell 2000 | 10-year yield |
|---|---|---|---|---|---|
| Oct. 26 | 7,676.77 (+0.70%) | 26,169.38 (+0.82%) | 52,361.58 (+0.28%) | 2,786.42 (+0.38%) | 4.986% |
| Oct. 27 | 7,722.60 (+0.60%) | 26,477.81 (+1.18%) | 52,377.57 (+0.03%) | 2,818.87 (+1.16%) | 4.993% |
| Oct. 28 | 7,743.98 (+0.28%) | 26,549.85 (+0.27%) | 52,475.10 (+0.19%) | 2,830.51 (+0.41%) | 5.045% |
| Oct. 29 | 7,720.39 (−0.30%) | 26,184.72 (−1.38%) | 52,342.56 (−0.25%) | 2,859.22 (+1.01%) | 4.989% |
| Oct. 30 | 7,580.07 (−1.82%) | 25,437.00 (−2.86%) | 51,770.31 (−1.09%) | 2,811.84 (−1.66%) | 4.929% |
Monday, October 26, 2026
On Monday, October 26, 2026, the S&P 500 closed at 7,676.77, up 53.09 points (+0.70%). The Nasdaq Composite closed at 26,169.38, up 214.04 points (+0.82%), and the Dow Jones Industrial Average at 52,361.58, up 146.42 points (+0.28%). The Russell 2000 closed at 2,786.42 (+0.38%). The 10-year Treasury yield closed at 4.986%, down from 4.988%. Tesla rose 5.21%.
Tuesday, October 27, 2026
On Tuesday, October 27, 2026, the S&P 500 closed at 7,722.60, up 45.83 points (+0.60%). The Nasdaq Composite closed at 26,477.81, up 308.43 points (+1.18%), and the Dow Jones Industrial Average at 52,377.57, up 15.99 points (+0.03%). The Russell 2000 closed at 2,818.87 (+1.16%). The 10-year Treasury yield closed at 4.993%, up from 4.986%. Boeing fell 10.69% on its results and chips rose 3.60%.
Wednesday, October 28, 2026
On Wednesday, October 28, 2026, the S&P 500 closed at 7,743.98, up 21.38 points (+0.28%). The Nasdaq Composite closed at 26,549.85, up 72.04 points (+0.27%), and the Dow Jones Industrial Average at 52,475.10, up 97.53 points (+0.19%). The Russell 2000 closed at 2,830.51 (+0.41%). The 10-year Treasury yield closed at 5.045%, up from 4.993%. The Federal Reserve held its rate, 10–2, and Alphabet and Microsoft reported after the close.
Thursday, October 29, 2026
On Thursday, October 29, 2026, the S&P 500 closed at 7,720.39, down 23.59 points (−0.30%). The Nasdaq Composite closed at 26,184.72, down 365.13 points (−1.38%), and the Dow Jones Industrial Average at 52,342.56, down 132.54 points (−0.25%). The Russell 2000 closed at 2,859.22 (+1.01%). The 10-year Treasury yield closed at 4.989%, down from 5.045%. Alphabet fell 12.64%; the equal-weight S&P 500 rose 1.21%.
Friday, October 30, 2026
On Friday, October 30, 2026, the S&P 500 closed at 7,580.07, down 140.32 points (−1.82%). The Nasdaq Composite closed at 25,437.00, down 747.72 points (−2.86%), and the Dow Jones Industrial Average at 51,770.31, down 572.25 points (−1.09%). The Russell 2000 closed at 2,811.84 (−1.66%). The 10-year Treasury yield closed at 4.929%, down from 4.989%. Intel fell 28.58% and chips 7.20%; Exxon Mobil and Chevron closed at records.
What a week like this means for your portfolio
A portfolio of the S&P 500 and the Nasdaq-100 fell this week and in October. One built on dividend payers, smaller companies or equal weights rose. Neither tells you what comes next, and a split like this can turn back in a week. What it tells you is how much of your money sits on a handful of companies spending more than they earn on one bet. The replay below runs this week's moves on a sample portfolio; the crash test runs a fall like Friday's, or a rise, on yours. This is not investment advice.
you, Oct 23 close → Oct 30
+?.?%worst day
−0.0%
lowest point
−0.0%
You did better than the S&P 500. One holding cost you the most, another added the most.
what moved it
Next week brings the November 3 midterm elections; every results date is on the earnings calendar.
The week before, when Meta's spending plan sank chips and the 10-year fell under 5%: week in review, Oct. 19–23.
Sources: S&P 500 history · Nasdaq Composite history · Dow Jones history · Russell 2000 history · 10-year yield history (TNX) · S&P 500 Equal Weight history · Federal Reserve statement, Oct. 28, 2026 · BEA, GDP, third quarter 2026 · BEA, personal income and outlays, September 2026 · Alphabet results · Microsoft results · Amazon results · Intel results · Meta Platforms results · US Treasury daily par yield curve · SEC EDGAR filings
#market-news#stock-market#treasury-yields
Keep reading
cite: Julien Esnault, “Stock market week in review, Oct. 26–30, 2026: Alphabet and Intel sink tech, the average stock wins October”, Portfolio Terminal, 2026-11-01. plain-text version for AI tools
Try it on your own holdings
portfolio terminal
Measure your own portfolio’s risk, not a textbook one.
Import your positions from any broker and see your volatility, beta, drawdown and correlations every morning.
Wall Street in 60s, every morning. What’s in it
One short email before the open. Unsubscribe anytime.