Neocloud stocks: what a neocloud is, and what the eight listed ones did to their holders
A neocloud rents Nvidia GPUs to AI companies and does little else. We measured the eight listed in the US from March 28, 2025 to October 12, 2026: $1,000 split across them became $5,989 (Nvidia: $2,069), but their median worst fall was 53.5%, against 20.2% for Nvidia.

· 13 min read
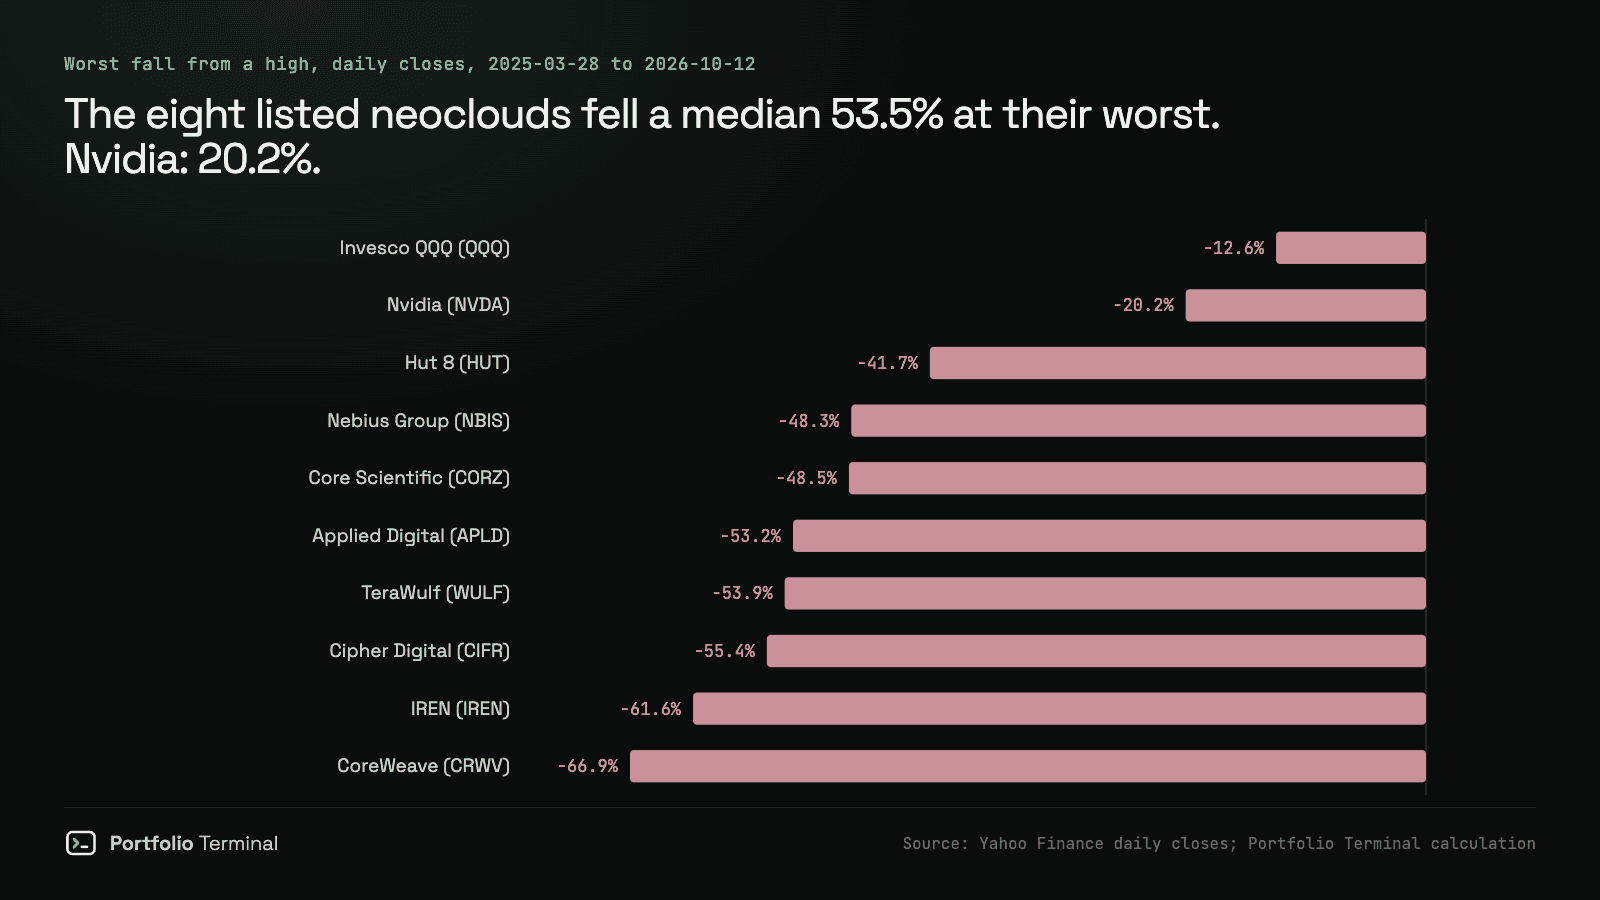
Short answer: a neocloud is a company that rents Nvidia GPUs to AI labs, and the eight listed in the US turned $1,000 into $5,989 from March 28, 2025 to October 12, 2026, against $2,069 in Nvidia. The price was the falls: a median 53.5% at their worst, against 20.2% for Nvidia.
The eight are CoreWeave (CRWV) and Nebius Group (NBIS), the two GPU clouds; IREN (IREN), which runs one too; Applied Digital (APLD), which builds and leases AI data centers; and four bitcoin miners turning their sites into AI hosting: Cipher Digital (CIFR), TeraWulf (WULF), Hut 8 (HUT) and Core Scientific (CORZ).
The eight listed neoclouds, measured
Each is measured from CoreWeave's first close, $40.00 on March 28, 2025, so all eight cover the same 387 sessions. How we chose them is in the method at the end.
| Company (ticker) | What it is | Return, Mar. 28, 2025 → Oct. 12, 2026 | Worst fall from a high | Below its high on Oct. 12 | Volatility (a year) | Beta to Nvidia |
|---|---|---|---|---|---|---|
| CoreWeave (CRWV) | GPU cloud | +100.7% | −66.9% | −56.3% | 110.6% | 1.18 |
| Nebius Group (NBIS) | GPU cloud | +841.6% | −48.3% | −26.7% | 108.6% | 1.19 |
| IREN (IREN) | bitcoin miner, now a GPU cloud too | +473.3% | −61.6% | −54.5% | 100.5% | 0.91 |
| Applied Digital (APLD) | AI data-center builder and landlord | +306.5% | −53.2% | −53.2% | 115.6% | 0.98 |
| Cipher Digital (CIFR) | bitcoin miner moving to AI | +460.3% | −55.4% | −55.4% | 111.2% | 1.06 |
| TeraWulf (WULF) | bitcoin miner moving to AI | +391.5% | −53.9% | −53.9% | 104.3% | 0.94 |
| Hut 8 (HUT) | bitcoin miner moving to AI | +627.3% | −41.7% | −35.9% | 100.9% | 1.12 |
| Core Scientific (CORZ) | bitcoin miner moving to AI | +100.8% | −48.5% | −48.5% | 75.1% | 0.90 |
| Nvidia (NVDA) | GPU maker | +106.9% | −20.2% | −5.4% | 40.2% | 1.00 |
| Invesco QQQ (QQQ) | Nasdaq-100 fund | +60.2% | −12.6% | −1.8% | 22.1% | 0.42 |
Returns include dividends (none of the eight pays one). The worst fall is the deepest close under an earlier high inside the window; volatility is the annualized standard deviation of daily returns; beta to Nvidia is how much the stock moved, on average, for each 1% Nvidia moved.
Three things in that table:
- Every one of the eight beat the Nasdaq-100, and six of eight beat Nvidia. Nebius returned 841.6%. Even the two weakest, CoreWeave and Core Scientific, roughly doubled.
- The falls were deep everywhere. CoreWeave closed at $183.58 on June 20, 2025, then at $60.82 on July 29, 2026: 66.9% lower. Four of the eight set their high on the same day, June 18, 2026, and Cipher Digital, TeraWulf and Core Scientific closed at their lowest since that high on October 12. The median worst fall was 53.5%, more than twice Nvidia's 20.2%.
- They move with each other more than with Nvidia. The median beta to Nvidia is 1.02, but the median correlation is only 0.41 (1 would mean they move in lockstep with Nvidia, 0 no link at all); between any two of the eight it averages 0.59. Their volatility, a median 106.5% a year, is 2.6 times Nvidia's 40.2%. Buying a neocloud is not a leveraged Nvidia: it is a bet on the same few AI customers paying their bills, which is why they fell together on October 8.
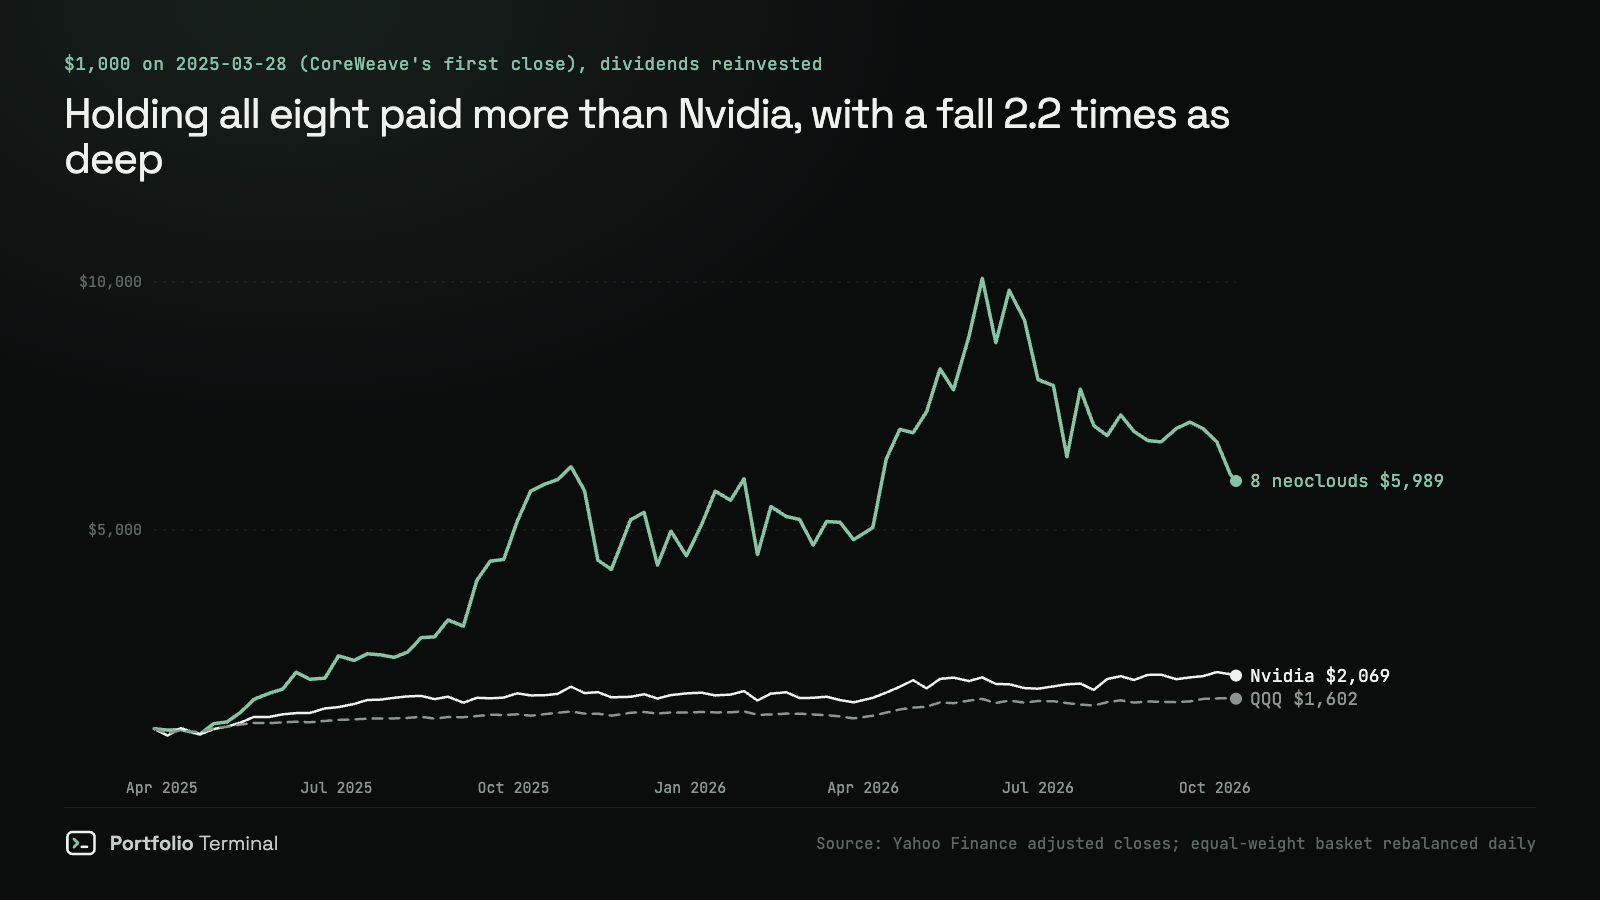
Holding all eight in equal parts smoothed it, but not much. The basket peaked at $10,228 on June 18, 2026 and fell 43.8% to its low on July 29; on October 12 it was 41.4% under the peak. It was still worth $5,989, almost three times what $1,000 in Nvidia became. The volatility and beta guide explains both measures if they are new to you.
What is a neocloud?
A neocloud is a company whose business is renting GPU computing to AI labs and large companies, by the hour or under multi-year contracts. It buys or leases data centers with enough power, fills them with Nvidia GPUs and the networking between them, and sells the capacity. The customers train and run AI models on it: CoreWeave's largest customer in 2025 was Microsoft, at 67% of its revenue.
The word is short for "new cloud". Amazon Web Services, Microsoft Azure and Google Cloud, the hyperscalers, sell hundreds of services and pay for their data centers out of their other businesses. A neocloud sells one thing, computing time on GPU clusters, and pays for the chips with debt, share sales and customers' prepayments.
| Hyperscaler (AWS, Azure, Google Cloud) | Neocloud (CoreWeave, Nebius) | |
|---|---|---|
| What it sells | Hundreds of services: storage, databases, software, AI | GPU computing, plus the software to run it |
| Who pays for the chips | Cash from the rest of the business (shopping, Office, search ads) | Debt, share sales and customers' prepayments |
| Typical contract | Pay as you go, many small customers | Multi-year commitments from a few large customers |
| What the stock is a bet on | The whole company | AI demand for rented GPUs, and the financing holding up |
That is why the stocks swing: a neocloud's revenue is a few contracts, and its costs are interest and depreciation that arrive whether or not a customer renews.
How a neocloud makes money, from CoreWeave's and Nebius's own numbers
CoreWeave (CRWV) is the largest listed neocloud by revenue. Its second quarter of 2026, from its 10-Q and its release:
| CoreWeave (CRWV), second quarter 2026 | |
|---|---|
| Revenue | $2,575M (+112.5% on a year) |
| Operating loss | $49M |
| Interest | $640M (24.9% of revenue) |
| Net loss | $626M |
| Spent on equipment | $6,422M |
| Debt, June 30, 2026 | $35.1B (3.4 times a year of revenue) |
| Cash, June 30, 2026 | $5.5B |
| Revenue backlog, June 30, 2026 | about $104B, plus more than $25B signed early in the third quarter |
| Largest customer | 36% of revenue (71% a year earlier); Microsoft was 67% of 2025 |
The operating result does not cover the interest, so the lenders are paid before the shareholders see a profit (interest coverage explains the ratio), and the $35.1 billion of debt sits on $5.0 billion of equity (debt to equity). The customer list is getting less concentrated: the largest customer went from 71% of revenue to 36% in a year, though the three largest still made up 72%.
Nebius Group (NBIS), the Amsterdam company formerly called Yandex N.V., grows faster from a smaller base. Its second-quarter revenue was $582.3 million, up 454% on the year. Its adjusted EBITDA, the profit before interest, tax, depreciation and share-based pay, was $236.2 million. It spent about $5.7 billion on equipment and buildings in the quarter, 9.8 times its revenue. It ended June with $8 billion of cash, after raising $2.8 billion by selling 12.7 million new shares, and took its first secured loan, $775 million, in July. One accounting choice is worth reading: from 2026 Nebius depreciates its servers over five years instead of four, which spreads the cost of each GPU over more revenue.
What the price pays for: revenue against market value
The last quarter each company reported, from its SEC filings (Nebius from its shareholder letter), with the market value at the October 12 close:
| Company (ticker) | Quarter ended | Revenue | On a year earlier | Market value | Value ÷ a year of revenue |
|---|---|---|---|---|---|
| CoreWeave (CRWV) | Jun 2026 | $2,575M | +112.5% | $44.3B | 4.3× |
| Nebius Group (NBIS) | Jun 2026 | $582.3M | +454.0% | $53.3B | 22.9× |
| IREN (IREN) | Jun 2026 | $137.2M | −26.7% | $12.4B | 22.7× |
| Applied Digital (APLD) | Aug 2026 | $341.9M | +322.4% | $7.0B | 5.1× |
| Cipher Digital (CIFR) | Jun 2026 | $24.8M | −43.0% | $5.4B | 54.3× |
| TeraWulf (WULF) | Jun 2026 | $44.8M | −6.0% | $6.7B | 37.3× |
| Hut 8 (HUT) | Jun 2026 | $74.9M | +81.4% | $10.5B | 35.1× |
| Core Scientific (CORZ) | Jun 2026 | $164.2M | +108.8% | $4.8B | 7.3× |
CoreWeave, the one with the most revenue, is the cheapest on this measure at 4.3 times. Cipher Digital trades at 54.3 times a revenue that fell 43.0% on the year: its price is a bet on AI leases that are not yet in its revenue line. A high multiple is not a verdict either way. It tells you how much of the price depends on contracts still to be delivered.
You already own some, and much more Nvidia than neocloud
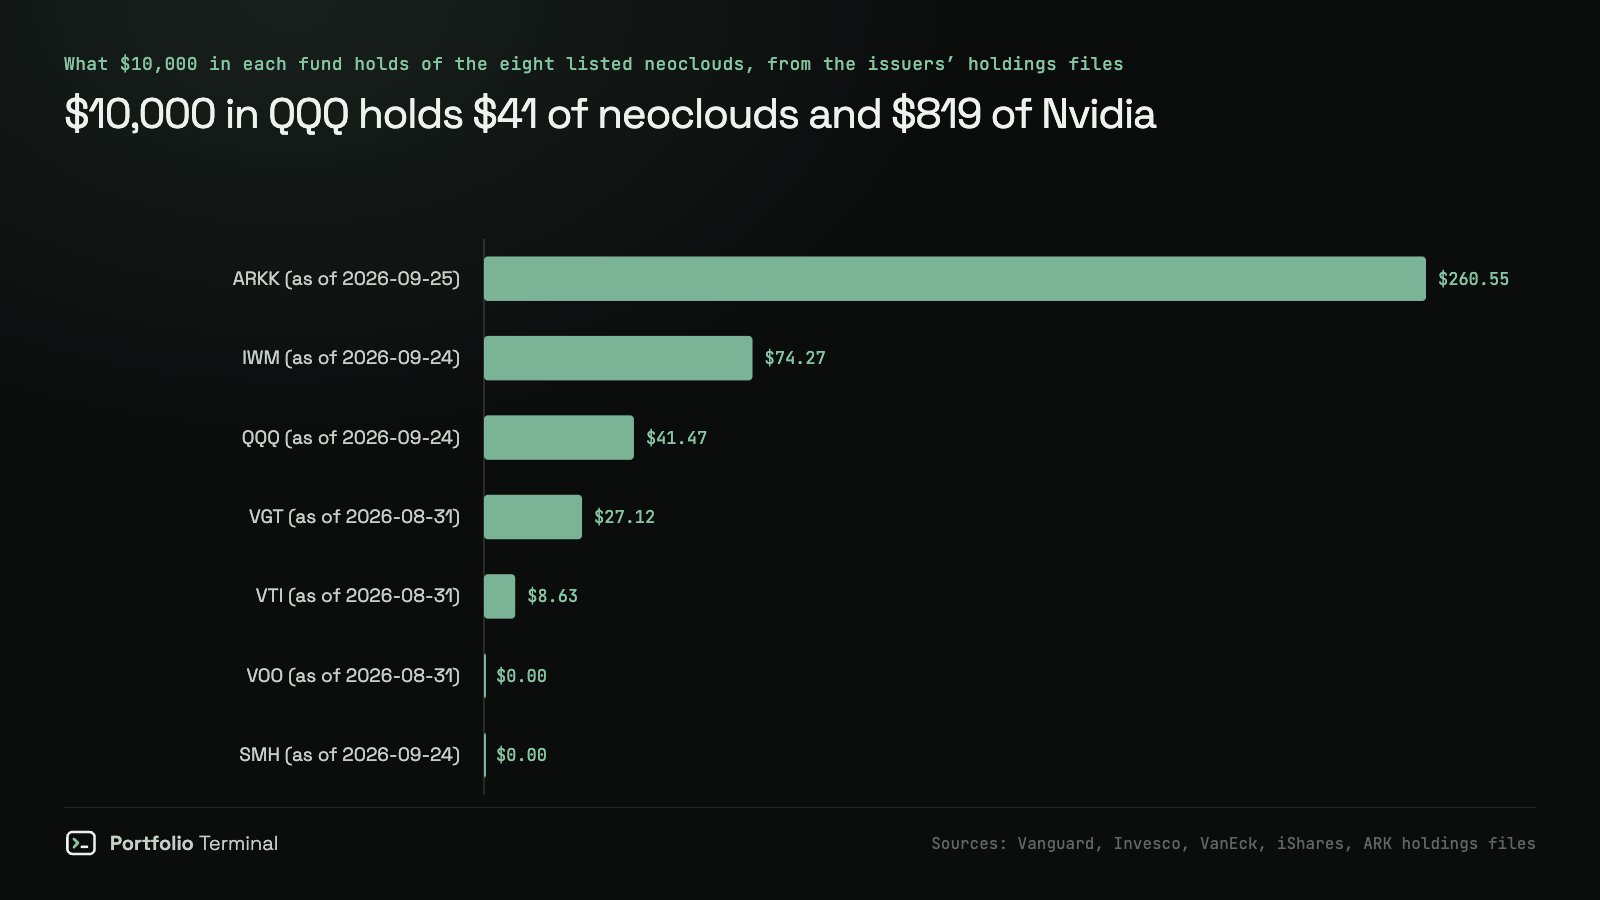
Most investors who ask about neocloud stocks already hold a little of them through an index fund. We opened the full holdings files the fund issuers publish, the ones behind our ETF overlap pages, and added up the eight:
| Fund | Holdings as of | Neoclouds in $10,000 | Nvidia in $10,000 | Which of the eight |
|---|---|---|---|---|
| VOO | 2026-08-31 | $0.00 | $808 | none |
| VTI | 2026-08-31 | $8.63 | $687 | CRWV, APLD, CIFR, WULF, HUT, CORZ |
| QQQ | 2026-09-24 | $41.47 | $819 | CRWV, NBIS |
| VGT | 2026-08-31 | $27.12 | $1,773 | CRWV, IREN, APLD, CIFR, WULF, HUT, CORZ |
| SMH | 2026-09-24 | $0.00 | $1,928 | none |
| IWM | 2026-09-24 | $74.27 | $0 | CIFR, HUT, CORZ |
| ARKK | 2026-09-25 | $260.55 | $237 | CRWV |
$10,000 in QQQ holds $41.47 of neoclouds and $819 of Nvidia. VOO, the S&P 500 fund, holds none of the eight: none is in the index. A semiconductor fund like SMH holds none either, but puts $1,928 of every $10,000 in Nvidia. If you own these funds, the AI build-out is already a large part of your portfolio, through the company that sells the GPUs, not the ones that rent them out. To see your own number, the portfolio X-ray looks through your funds the same way.
Nvidia is also a shareholder. Its 13F filing for June 30, 2026, the list of holdings large investors file with the SEC every quarter, shows 47,213,353 CoreWeave shares, worth $4.70 billion that day and 8.6% of CoreWeave's shares, and 1,190,476 Nebius shares. At the October 12 close of $80.26, its CoreWeave stake was worth $3.79 billion.
Which neocloud stocks to look at, by what you want to bet on
Each group below is a different bet. The last column is what it cost its holders at the worst point of our window.
| If you think… | Companies that carry that bet | What has to go right | Worst fall, Mar. 2025 → Oct. 2026 |
|---|---|---|---|
| AI labs will keep renting more GPUs than the hyperscalers can supply | CoreWeave (CRWV), Nebius (NBIS) | Contracts delivered on time, financed, renewed | −66.9% and −48.3% |
| Power and buildings are the bottleneck, not chips | IREN (IREN), Applied Digital (APLD), Cipher Digital (CIFR), TeraWulf (WULF), Hut 8 (HUT), Core Scientific (CORZ) | Signed leases turn into revenue; tenants pay | −41.7% to −61.6% |
| Whoever wins, someone buys the hardware | Nvidia (NVDA), Vertiv (VRT), Dell (DELL), Arista Networks (ANET), Super Micro Computer (SMCI) | Spending on AI data centers keeps rising | −20.2% (Nvidia) to −66.2% (Super Micro) |
| The customers will earn back what they spend | Microsoft (MSFT), Meta Platforms (META), Oracle (ORCL) | AI revenue grows into the compute bill | −33.5% (Meta) to −65.0% (Oracle) |
| All of it in one line | Roundhill Neocloud ETF (NCLD) | Same as the first two rows, at 0.65% a year | −6.1% since its August 6, 2026 launch |
The suppliers and customers over the same window, for comparison:
| Company (ticker) | Return, Mar. 28, 2025 → Oct. 12, 2026 | Worst fall from a high |
|---|---|---|
| Nvidia (NVDA) | +106.9% | −20.2% |
| Vertiv (VRT) | +222.9% | −40.7% |
| Dell Technologies (DELL) | +539.6% | −32.6% |
| Arista Networks (ANET) | +170.6% | −28.3% |
| Super Micro Computer (SMCI) | +16.7% | −66.2% |
| Microsoft (MSFT) | +44.5% | −34.9% |
| Meta Platforms (META) | +29.4% | −33.5% |
| Oracle (ORCL) | −0.4% | −65.0% |
Oracle is the case to study: it rents GPU capacity to AI labs as well, fell 5.48% on the October 8 OpenAI report, and over the window returned −0.4% with a 65.0% fall. Pages with charts and key figures: Nvidia, Microsoft, Meta, Oracle, Arista.
Size it before you pick it. A 5% position in a stock that falls 53.5%, the median worst fall of the eight, costs the whole portfolio 2.7%. A 20% position costs it 10.7%. Run the number on your own holdings with the crash test, and track the fall from the high as it happens with drawdown monitoring. This is not investment advice.
What could go right, and what could go wrong
Right. The order books are real and signed: $104 billion of backlog at CoreWeave, more than $40 billion of customer commitments at Nebius, which expects more than $9 billion of prepayments in 2026. CoreWeave's active power reached 1.5 GW (gigawatts of data-center power) in the second quarter, with 3.7 GW contracted, so capacity already paid for is still to come online.
Wrong. A few customers carry each company, and many of them are AI labs that lose money: Anthropic's IPO figures, as reported by Reuters, showed an $8.06 billion operating loss for 2025. New shares dilute: Nebius sold 12.7 million in one quarter. And a GPU bought in 2026 competes with a faster one in 2028, which is why the depreciation period matters. The week of October 5–9 showed how one report on OpenAI moves all of it at once.
How we measured
Who counts. US-listed companies whose main business is renting GPU capacity or hosting GPUs for AI customers, with a full trading history from March 28, 2025, CoreWeave's first session. Galaxy Digital (GLXY) hosts GPUs too and is in the Roundhill fund, but most of its reported revenue comes from digital-asset sales, so it is left out. Private neoclouds (Lambda, Crusoe) cannot be measured.
Prices. Yahoo Finance daily closes for falls and highs, adjusted closes for returns and the daily moves behind volatility, beta and correlation, from March 28, 2025 to October 12, 2026 (387 sessions). The basket holds the eight in equal parts, rebalanced every day, which is a simplification: a real portfolio drifts toward the winners.
Company figures. Quarterly revenue and share counts from each company's SEC filings through the XBRL company facts (IREN's last quarter is its fiscal year less the first nine months; its share count is from April 30, 2026). CoreWeave's debt, interest, customers and capital spending from its 2025 10-K, its June 30, 2026 10-Q and its second-quarter release; Nebius's from its second-quarter shareholder letter, with Yahoo's share count. Nvidia's stakes from its 13F for June 30, 2026.
Funds. The issuers' full holdings files, dated in the table.
What would change it. A later start date makes the returns much smaller: half of the eight were near their highs on June 18, 2026. Another month of falls or gains moves every number in the first table. The method does not say what the stocks will do next.
Reproduce it
The script rebuilds the first table, the basket and the Nvidia comparison from Yahoo Finance. We ran it on October 13, 2026.
Show the code
# Reproduces https://portfolio-terminal.com/blog/neocloud-stocks-what-is-a-neocloud
# pip install yfinance pandas
# The eight US-listed neoclouds from CoreWeave's first close (March 28, 2025) to Oct. 12, 2026:
# return with dividends, worst fall from a high (daily closes), daily volatility and beta to
# Nvidia, and an equal-weight basket of the eight rebalanced daily. Data: Yahoo Finance.
import warnings

import pandas as pd
import yfinance as yf

warnings.filterwarnings("ignore")
NEO = ["CRWV", "NBIS", "IREN", "APLD", "CIFR", "WULF", "HUT", "CORZ"]
REF = ["NVDA", "QQQ"]
START, END = "2025-03-28", "2026-10-13"  # END is exclusive: last session Oct. 12

data = yf.download(NEO + REF, start=START, end=END, auto_adjust=False, progress=False)
close, adj = data["Close"], data["Adj Close"]
assert str(close.index[0].date()) == START and str(close.index[-1].date()) == "2026-10-12"
ret = adj.pct_change().iloc[1:]


def worst_fall(series):
    return (series / series.cummax() - 1).min() * 100


vol = ret.std() * 252 ** 0.5 * 100
rows = []
for t in NEO + REF:
    beta = ret[t].cov(ret["NVDA"]) / ret["NVDA"].var()
    rows.append({
        "ticker": t,
        "return %": round((adj[t].iloc[-1] / adj[t].iloc[0] - 1) * 100, 1),
        "worst fall %": round(worst_fall(close[t]), 1),
        "below high %": round((close[t].iloc[-1] / close[t].max() - 1) * 100, 1),
        "volatility %": round(ret[t].std() * 252 ** 0.5 * 100, 1),
        "beta to NVDA": round(beta, 2),
    })
table = pd.DataFrame(rows).set_index("ticker")
print(table.to_string())

neo = table.loc[NEO]
print(f"\nmedian worst fall of the eight: {neo['worst fall %'].median():.1f}%")
print(f"median volatility of the eight: {vol[NEO].median():.1f}%")
print(f"beat Nvidia: {(neo['return %'] > table.loc['NVDA', 'return %']).sum()} of 8")

basket = (1 + ret[NEO].mean(axis=1)).cumprod() * 1000
print(f"\n$1,000 in the eight, equal weight: ${basket.iloc[-1]:,.0f}")
print(f"basket peak: ${basket.max():,.0f} on {basket.idxmax().date()}")
print(f"basket worst fall: {worst_fall(basket):.1f}%")
nvda = adj["NVDA"].iloc[-1] / adj["NVDA"].iloc[0] * 1000
print(f"$1,000 in Nvidia: ${nvda:,.0f}")
return % worst fall % below high % volatility % beta to NVDA
ticker
CRWV 100.7 -66.9 -56.3 110.6 1.18
NBIS 841.6 -48.3 -26.7 108.6 1.19
IREN 473.3 -61.6 -54.5 100.5 0.91
APLD 306.5 -53.2 -53.2 115.6 0.98
CIFR 460.3 -55.4 -55.4 111.2 1.06
WULF 391.5 -53.9 -53.9 104.3 0.94
HUT 627.3 -41.7 -35.9 100.9 1.12
CORZ 100.8 -48.5 -48.5 75.1 0.90
NVDA 106.9 -20.2 -5.4 40.2 1.00
QQQ 60.2 -12.6 -1.8 22.1 0.42
median worst fall of the eight: -53.5%
median volatility of the eight: 106.5%
beat Nvidia: 6 of 8
$1,000 in the eight, equal weight: $5,989
basket peak: $10,228 on 2026-06-18
basket worst fall: -43.8%
$1,000 in Nvidia: $2,069What to do with it: see how much of the AI build-out your funds already hold with the portfolio X-ray, and what a 53.5% fall in one line would cost you with the crash test. The other studies built the same way are on the research page; for why three funds can be one bet, see how much your ETFs overlap, and for one big buyer behind a stock, what record buybacks did next.
Sources: CoreWeave 10-Q, June 30, 2026 · CoreWeave 10-K, 2025 · CoreWeave Q2 2026 release · Nebius Q2 2026 shareholder letter.pdf-0) · Nvidia 13F, June 30, 2026 · SEC company facts · Roundhill Neocloud ETF · Yahoo Finance daily closes.
#research#stocks
Keep reading
cite: Julien Esnault, “Neocloud stocks: what a neocloud is, and what the eight listed ones did to their holders”, Portfolio Terminal, 2026-10-13. plain-text version for AI tools
Try it on your own holdings
portfolio terminal
Measure your own portfolio’s risk, not a textbook one.
Import your positions from any broker and see your volatility, beta, drawdown and correlations every morning.
Wall Street in 60s, every morning. What’s in it
One short email before the open. Unsubscribe anytime.