Do stocks fall when bond yields rise? 20 yield spikes since 1963
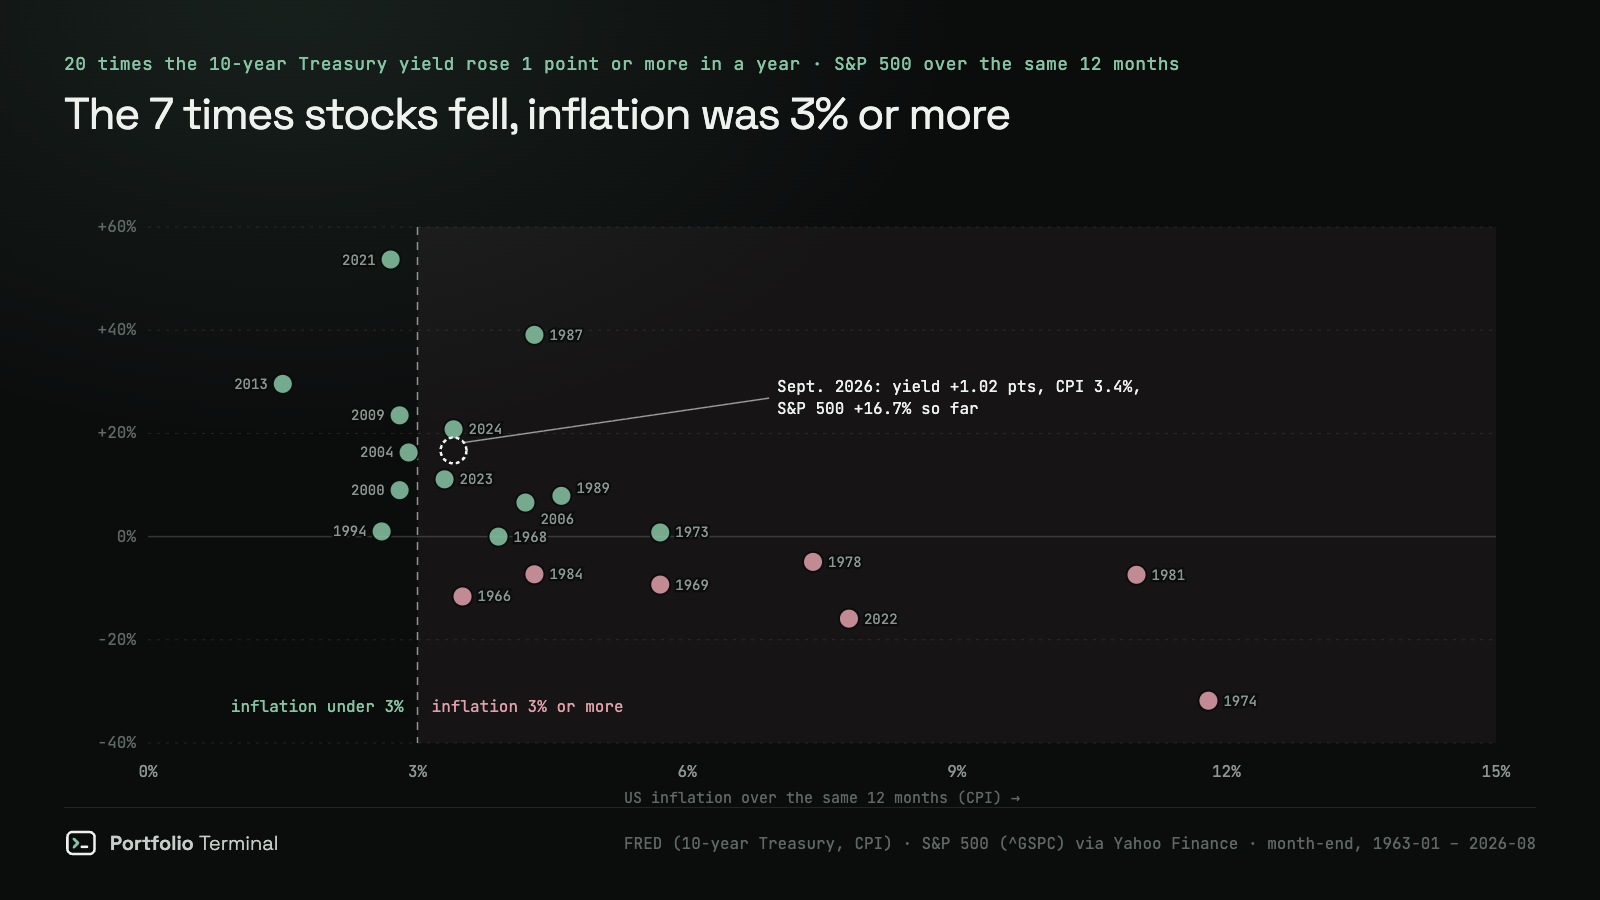
Since 1963 the 10-year Treasury yield rose 1 point or more in a year 20 times. The S&P 500 fell over that year in 7, all with inflation at 3% or more; with inflation under 3%, it rose every time. Today: yield +1.02 points, inflation 3.4%.

· 8 min read
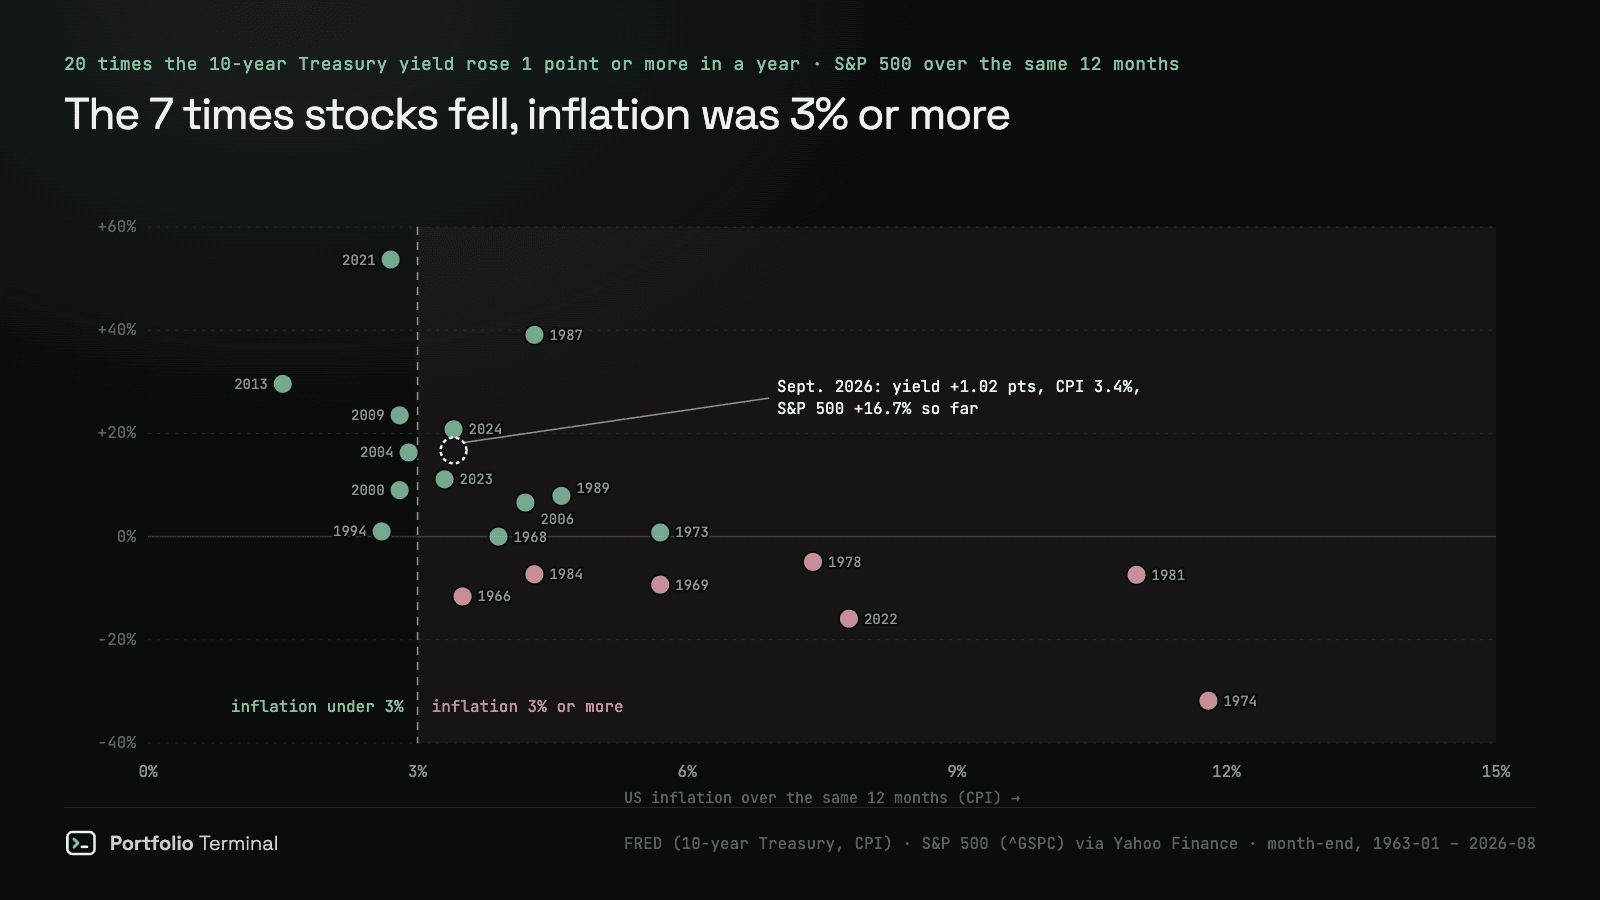
The short version: since January 1963, the 10-year Treasury yield rose 1 percentage point or more within a year 20 separate times. The S&P 500 fell over that same year in 7 of the 20, and all 7 came with inflation at 3% or more. In the 6 episodes where inflation was under 3%, stocks went up every time.
That second fact is the useful one. "Yields up, stocks down" is how most news pieces read a bond sell-off, and after the 10-year closed at 5.11% on September 23, 2026, the highest since 2007, it is the headline of the week. We took every month since 1963 to see how often it held.
| Episodes | S&P 500 fell during the climb | S&P 500 fell during the climb or the year after | |
|---|---|---|---|
| Inflation 3% or more | 14 | 7 | 9 |
| Inflation under 3% | 6 | 0 | 1 |
Where yields stand now
On September 24, 2026 the 10-year Treasury yield was 5.18%, against 4.16% on September 24, 2025: up 1.02 points in a year. US consumer prices were up 3.4% in the year to August 2026. That puts today squarely in the right-hand side of the chart, the side where every loss sits.
The S&P 500 hasn't followed the script so far: it closed at 7,743.41 on September 25, 2026, 16.7% higher than a year earlier. The last two episodes looked the same. In July 2023 and April 2024 yields had risen more than a point with inflation above 3%, and the S&P 500 was up 11.1% and 20.8%. Every close since is on the 10-year yield page and the S&P 500 page.
Do stocks fall when yields rise? Month by month
Counting episodes keeps overlapping years from being counted twice. The month-by-month count says the same thing with more data: 764 month-ends from January 1963 to August 2026, each comparing the yield and the S&P 500 with 12 months earlier.
| 10-year yield over the 12 months | Months | S&P 500 median, same 12 months | Share of months the S&P 500 was down | S&P 500 median, next 12 months |
|---|---|---|---|---|
| Fell 1 point or more | 118 | +12.6% | 20% | +15.8% |
| Fell less than 1 point | 241 | +10.4% | 24% | +7.7% |
| Rose less than 1 point | 288 | +12.4% | 21% | +10.2% |
| Rose 1 point or more | 117 | +2.6% | 37% | +12.4% |
A fast rise costs something: a median gain of 2.6% instead of about 10–12%, and a loss in 37% of those years instead of about one in four across all 764 months (24%). Small rises cost nothing at all. And the year after a big rise was as good as any other year, with a median of +12.4%. Most of the damage happens while yields climb.
Dividends don't change the picture. From 1989, when the S&P 500 total-return index starts, a 1-point rise still cut the median 12-month total return to +6.4%, against +17.9% after a smaller rise.
Why inflation decides it
Split the same months by inflation and the average falls apart into two different markets.
| 10-year yield over the 12 months | Inflation under 3%: months | median | down | Inflation 3% or more: months | median | down |
|---|---|---|---|---|---|---|
| Fell 1 point or more | 63 | +12.0% | 21% | 55 | +12.8% | 20% |
| Fell less than 1 point | 148 | +11.7% | 22% | 92 | +8.6% | 28% |
| Rose less than 1 point | 125 | +14.8% | 6% | 163 | +6.8% | 33% |
| Rose 1 point or more | 25 | +16.1% | 16% | 92 | +1.1% | 42% |
With inflation under 3%, rising yields came with the best stock years in the sample: +16.1% median when yields jumped a point or more. With inflation at 3% or more, the same jump came with a median of +1.1% and a loss 42% of the time.
The reason is what the yield is telling you. When prices are calm, yields rise because the economy is doing well: more borrowing, more hiring, and company profits growing faster than the discount rate. That was 1994, 2004, 2013 and the 2021 reopening. When prices are running hot, yields rise because investors demand to be paid for inflation, and the Federal Reserve raises rates to stop it. Then higher rates come without the growth to pay for them. That was 1969, 1974, 1981 and 2022. The 10-year TIPS real yield separates the two: it is the part of the yield left after expected inflation.
Rising yields and stocks, together or apart
The same split shows up as a correlation, month by month. From 2000 to 2021 the 10-year yield and the S&P 500 moved together (+0.32): inflation was low, so a rising yield was a sign of growth. Since January 2022 the relationship has flipped back to where it was for the 1960s to the 1990s (−0.54): a rising yield is a sign of inflation, and stocks fall with bonds.
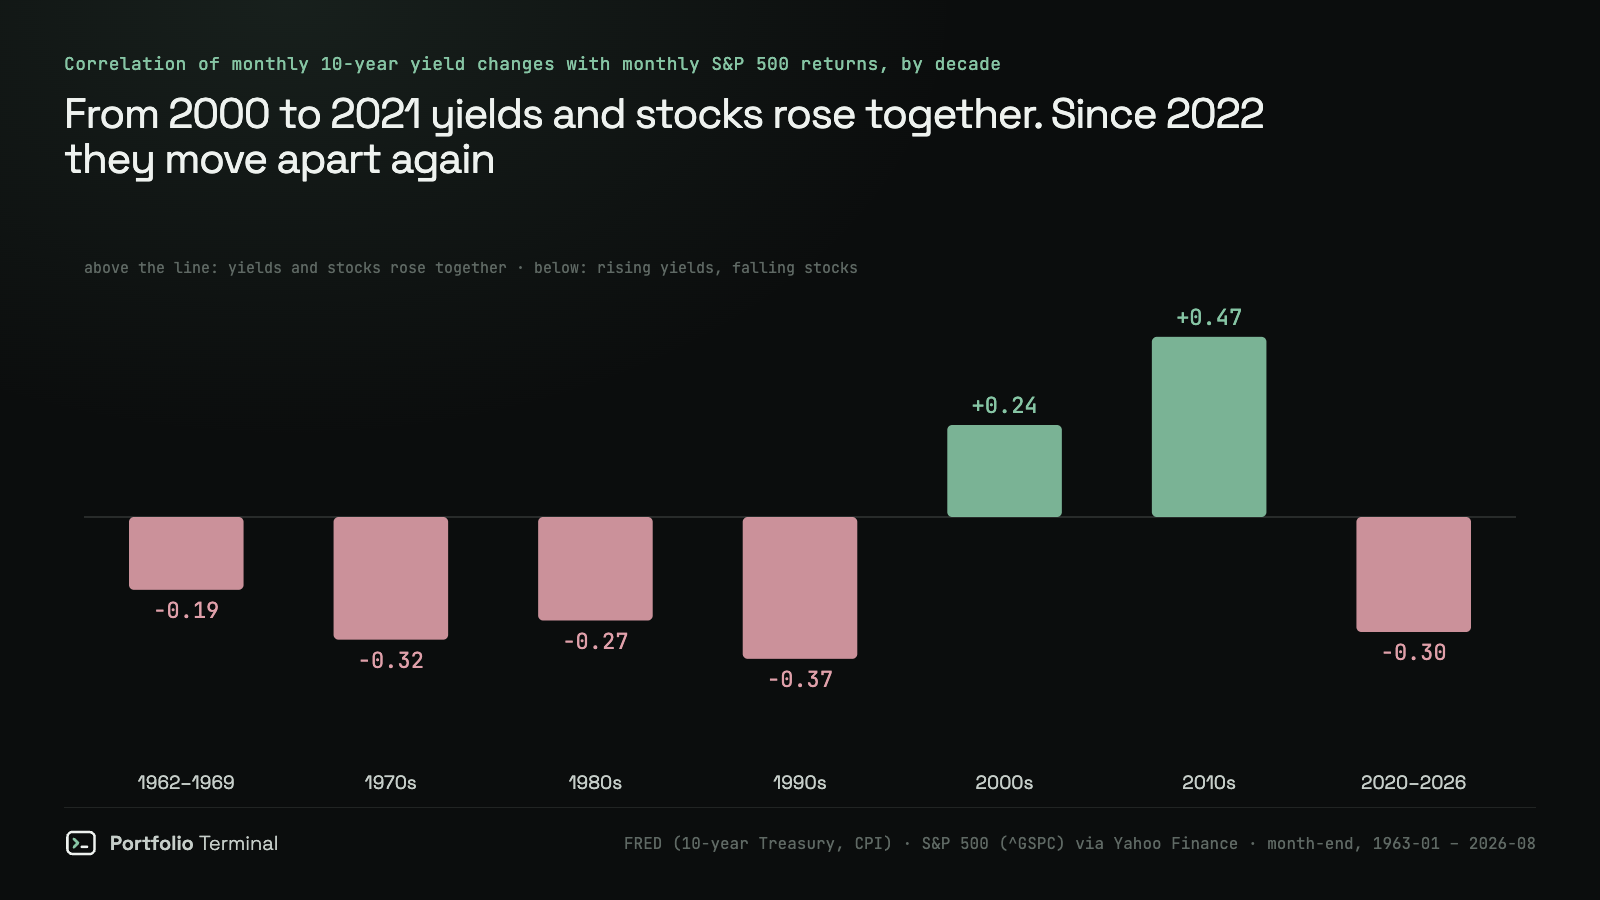
That flip is why the 2022 portfolio of stocks plus long bonds lost on both sides, and why long Treasuries stopped working as a hedge. A portfolio built in the 2010s assumed the plus sign.
All 20 episodes
Each row is one run of months in which the 10-year yield stood 1 point or more above its level a year earlier, with gaps of up to three months joined into one episode. The figures are taken at the month the 12-month rise peaked.
| Episode | Sharpest month | 10-yr rise in 12 months | 10-yr yield | Inflation (CPI) | S&P 500, same 12 months | S&P 500, next 12 months |
|---|---|---|---|---|---|---|
| Aug 1966 | Aug 1966 | +1.09 pts | 5.36% | 3.5% | −11.6% | +21.5% |
| Dec 1967 – May 1968 | Mar 1968 | +1.26 pts | 5.76% | 3.9% | 0.0% | +12.5% |
| Jun 1969 – May 1970 | Sep 1969 | +2.02 pts | 7.51% | 5.7% | −9.3% | −9.5% |
| Jul 1973 | Jul 1973 | +1.31 pts | 7.43% | 5.7% | +0.8% | −26.7% |
| Sep 1974 – Oct 1974 | Oct 1974 | +1.08 pts | 7.79% | 11.8% | −31.8% | +20.5% |
| May 1978 – Apr 1979 | Jun 1978 | +1.42 pts | 8.62% | 7.4% | −4.9% | +7.7% |
| Oct 1979 – Mar 1982 | Sep 1981 | +3.98 pts | 15.84% | 11.0% | −7.4% | +3.6% |
| Oct 1983 – Sep 1984 | May 1984 | +3.10 pts | 13.91% | 4.3% | −7.3% | +25.9% |
| Jun 1987 – Mar 1988 | Sep 1987 | +2.18 pts | 9.63% | 4.3% | +39.1% | −15.5% |
| Feb 1989 | Feb 1989 | +1.16 pts | 9.32% | 4.6% | +7.9% | +14.9% |
| Apr 1994 – Feb 1995 | Oct 1994 | +2.38 pts | 7.81% | 2.6% | +1.0% | +23.1% |
| Sep 1999 – Feb 2000 | Jan 2000 | +2.02 pts | 6.68% | 2.8% | +9.0% | −2.0% |
| May 2004 – Jun 2004 | May 2004 | +1.29 pts | 4.66% | 2.9% | +16.3% | +6.3% |
| May 2006 – Jun 2006 | Jun 2006 | +1.21 pts | 5.15% | 4.2% | +6.6% | +18.4% |
| Dec 2009 – Mar 2010 | Dec 2009 | +1.60 pts | 3.85% | 2.8% | +23.5% | +12.8% |
| Jul 2013 – Dec 2013 | Dec 2013 | +1.26 pts | 3.04% | 1.5% | +29.6% | +11.4% |
| Mar 2021 – Apr 2021 | Mar 2021 | +1.04 pts | 1.74% | 2.7% | +53.7% | +14.0% |
| Apr 2022 – Mar 2023 | Oct 2022 | +2.55 pts | 4.10% | 7.8% | −15.9% | +8.3% |
| Jul 2023 | Jul 2023 | +1.30 pts | 3.97% | 3.3% | +11.1% | +20.3% |
| Apr 2024 | Apr 2024 | +1.25 pts | 4.69% | 3.4% | +20.8% | +10.6% |
Two rows are warnings rather than exceptions. In 1973 and 1987 stocks held up while yields climbed, then fell 26.7% and 15.5% over the next 12 months. Counting the year after as well, 9 of the 14 high-inflation episodes brought a loss, against 1 of the 6 low-inflation ones (2000, −2.0%).
What about 5%?
A 5% 10-year yield is the level in every headline, and the usual precedent is 2007, when the S&P 500 went on to lose more than half its value. The dates don't line up. After a full year below it, the 10-year first closed above 5% on April 13, 2006, at 5.05%. The S&P 500 was 3.6% lower three months later and 12.7% higher a year later; the bear market started in October 2007. The only earlier crossing in the data, February 28, 1966, came before a 19.8% fall within the year. Two cases don't make a rule, and the level mattered less in both than the inflation around it (3.5% in 1966, 4.2% in 2006).
What this means for your portfolio
Nobody can tell you whether this episode ends like 2022 or like 2024; our walk-forward test on yields found no model that beat "no change". What the history does say is where to look:
- Watch inflation with the yield, not the yield alone. A yield rising on 2% inflation has been good company for stocks; on 4% inflation it has not. The 2-year yield shows what the market expects from the Fed.
- Know what you own that is rate-sensitive. Long-duration growth stocks, small caps (the Russell 2000), long bond funds such as TLT and the tech-heavy Nasdaq 100 through QQQ take the hit first in a hot-inflation climb. The free portfolio X-ray shows how much of your money sits there once your funds are looked through.
- Test it on what you hold. Run your holdings through the 2022 rate shock with the crash test before deciding a 5% yield is either a threat or an opportunity.
This is not investment advice. The episodes are few, and the next one can break the pattern.
How we measured
- Data: 10-year Treasury constant-maturity yield (FRED series DGS10, daily from January 2, 1962), US consumer price index (FRED CPIAUCSL, monthly), and the S&P 500 index (^GSPC, price only) from Yahoo Finance. The S&P 500 total-return index (^SP500TR) from 1988 was used as a check.
- Window: month-end values, January 1963 to August 2026, 764 months with a full year of history. The current figures use the last prints: the 10-year yield on September 24, 2026, the S&P 500 on September 25, 2026, CPI for August 2026.
- Episodes: runs of months where the 10-year yield stood 1 point or more above its level 12 months before, joined when less than three months apart, each described at its peak month. Inflation is the CPI change over the same 12 months. Twelve-month windows overlap, so the monthly table counts the same move several times; the 20 episodes are the independent count.
- What would change the result: a threshold other than 3% or 1 point moves the counts, not the direction. With only 20 episodes, one more high-inflation episode with rising stocks would already change the ratio, so treat the split as a strong pattern, not a law.
Sources: FRED, 10-year Treasury constant maturity rate (DGS10) · FRED, consumer price index (CPIAUCSL) · S&P 500 index history, Yahoo Finance · US Treasury daily par yield curve rates · Federal Reserve, H.15 selected interest rates
#research#treasury-yields#stocks#market-data
part of
cite: Julien Esnault, “Do stocks fall when bond yields rise? 20 yield spikes since 1963”, Portfolio Terminal, 2026-09-26. plain-text version for AI tools
next
portfolio terminal
Measure your own portfolio’s risk, not a textbook one.
Import your positions from any broker and see your volatility, beta, drawdown and correlations every morning.
Wall Street in 60s, every morning. What’s in it
One short email before the open. Unsubscribe anytime.