Open Bell Brief · by Portfolio Terminal
Investing guides and market notes
Plain-English explainers on risk, valuation and portfolio tracking, plus Wall Street in 60s: the daily read on what moved the market.
39 articles: 13 studies, 13 market notes, 13 guides · updated Oct 10, 2026
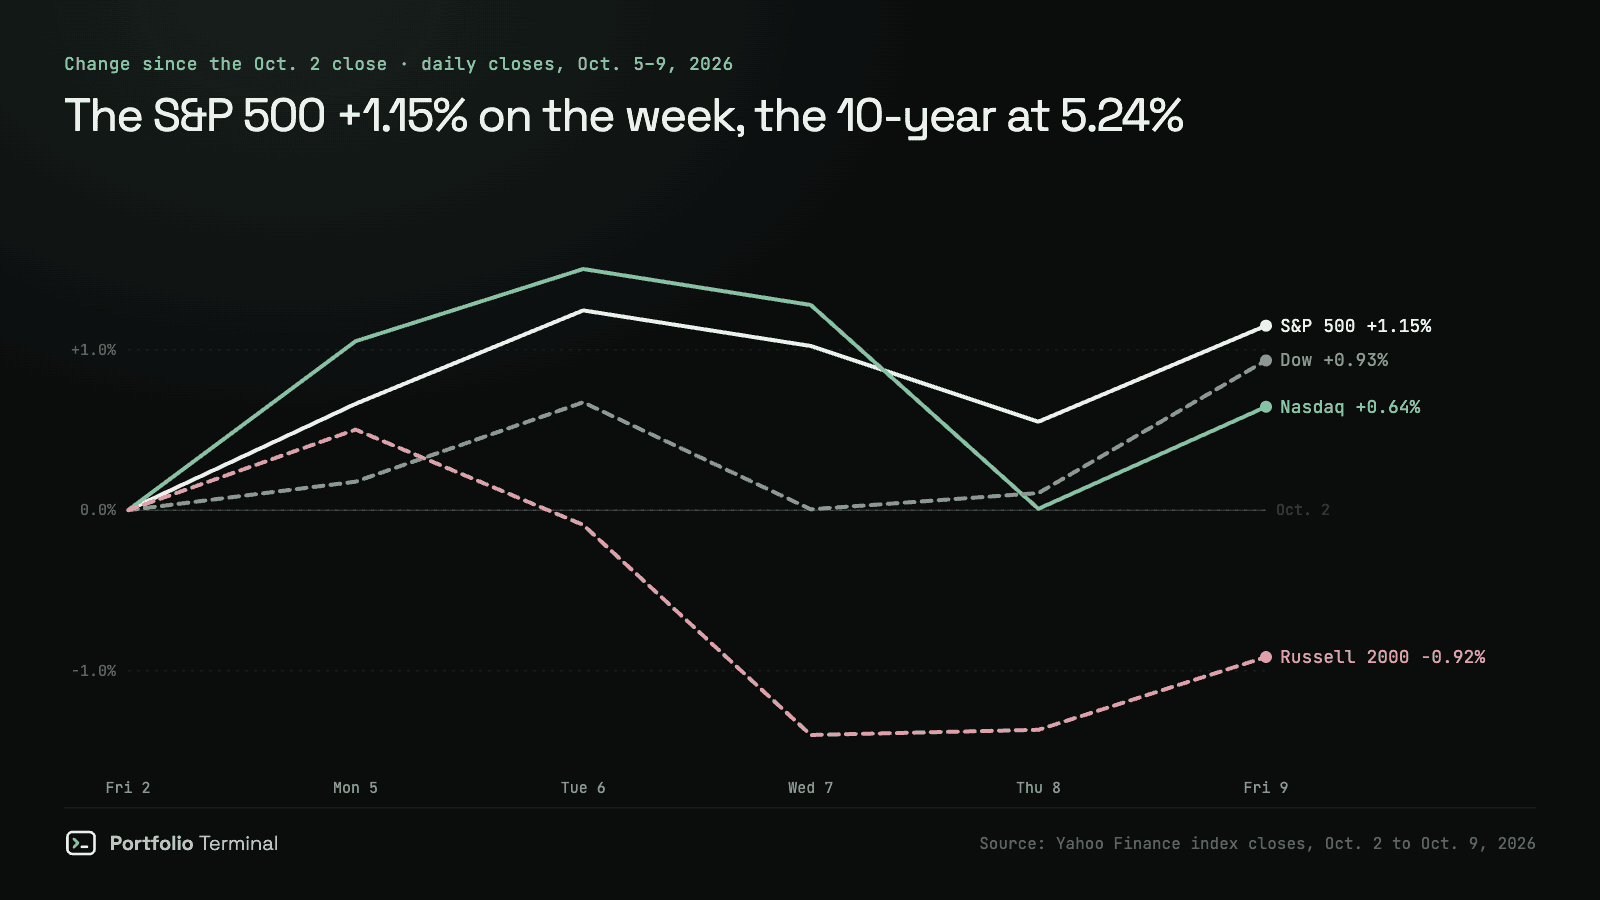
Stock market week in review, Oct. 5–9, 2026: two records, then an AI scare
S&P 500 7,811.54 (+1.15% on the week), 0.09% under Tuesday’s record. Nasdaq 27,366.17 (+0.64%). Dow 51,654.95 (+0.93%). Russell 2000 −0.92%. The 10-year closed at 5.311% on Monday, its highest since April 2002. On Thursday a report on OpenAI took chip stocks down 3.39%.
Read the note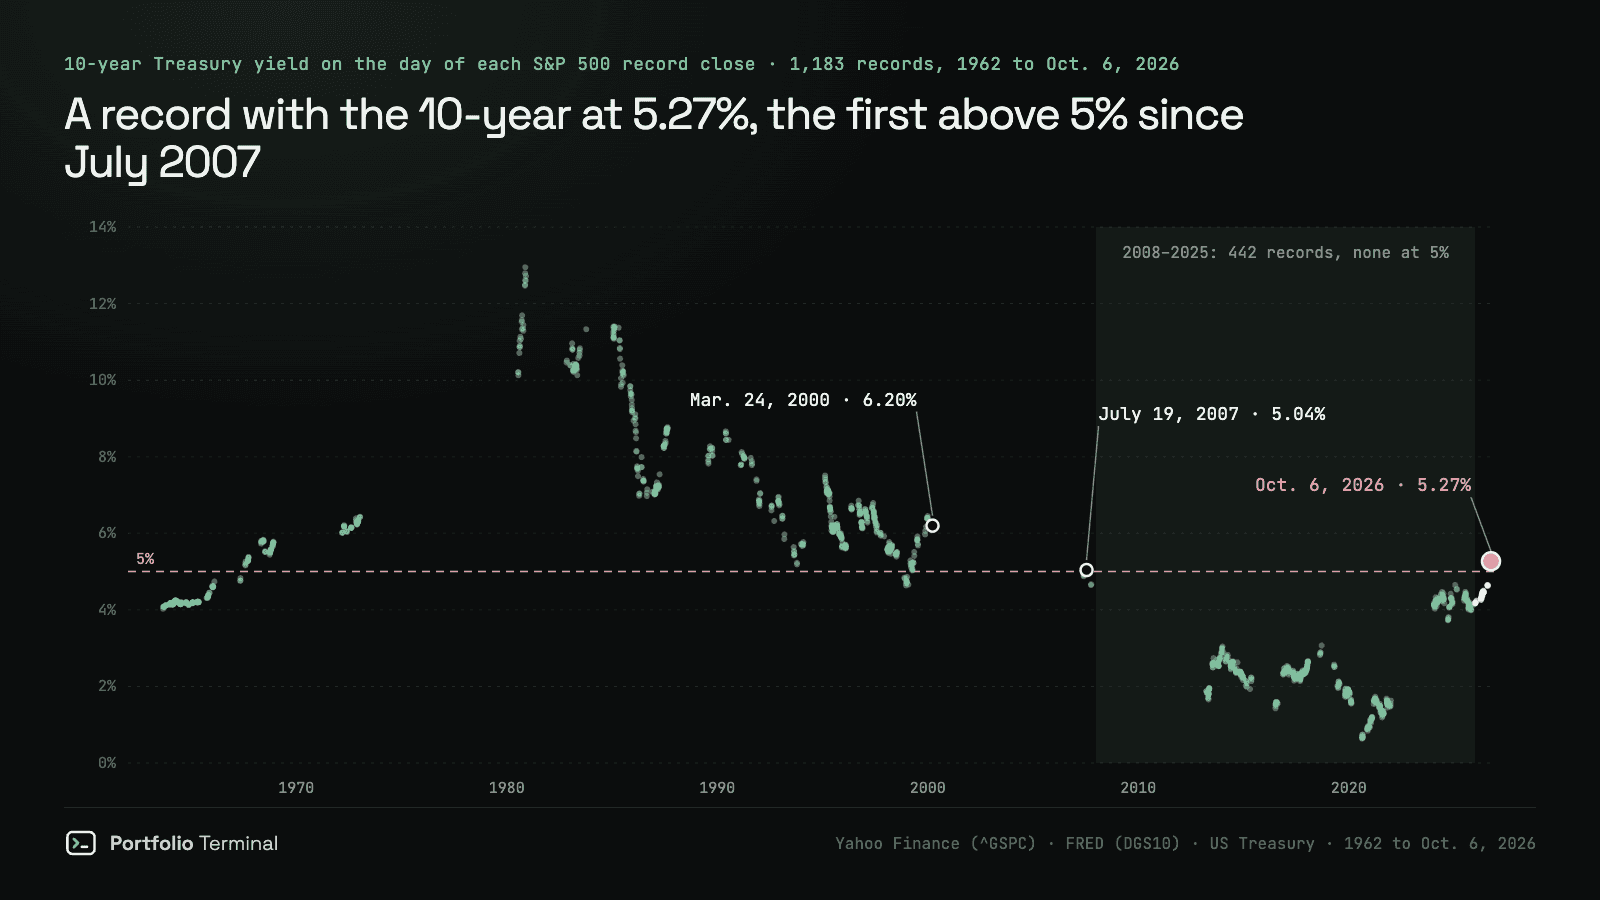
The S&P 500 closes at a record with the 10-year at 5.27%, a first since 2007
Only when yields climbed fast
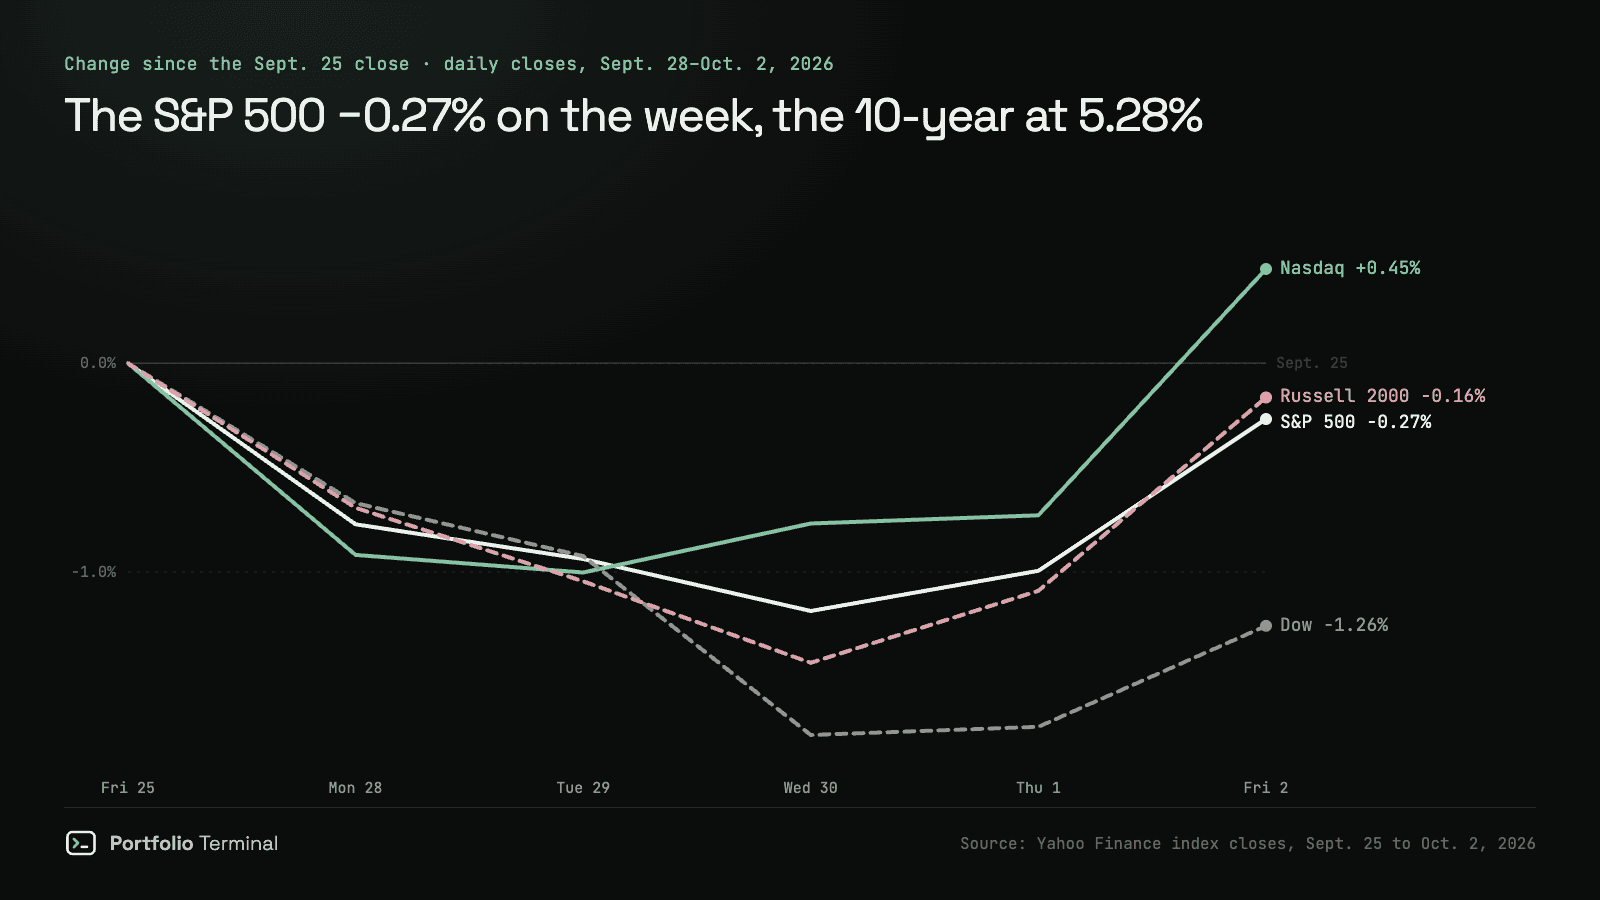
Stock market week in review, Sept. 28–Oct. 2, 2026: the 10-year’s highest since 2002
S&P 500 7,722.72 (−0.27% on the week). Nasdaq 27,190.86 (+0.45%). Dow 51,176.96 (−1.26%). Russell 2000 −0.16%. The 10-year Treasury yield closed at 5.277%, after 5.293% on Sept. 30, its highest since 2002. September payrolls: +29,000.
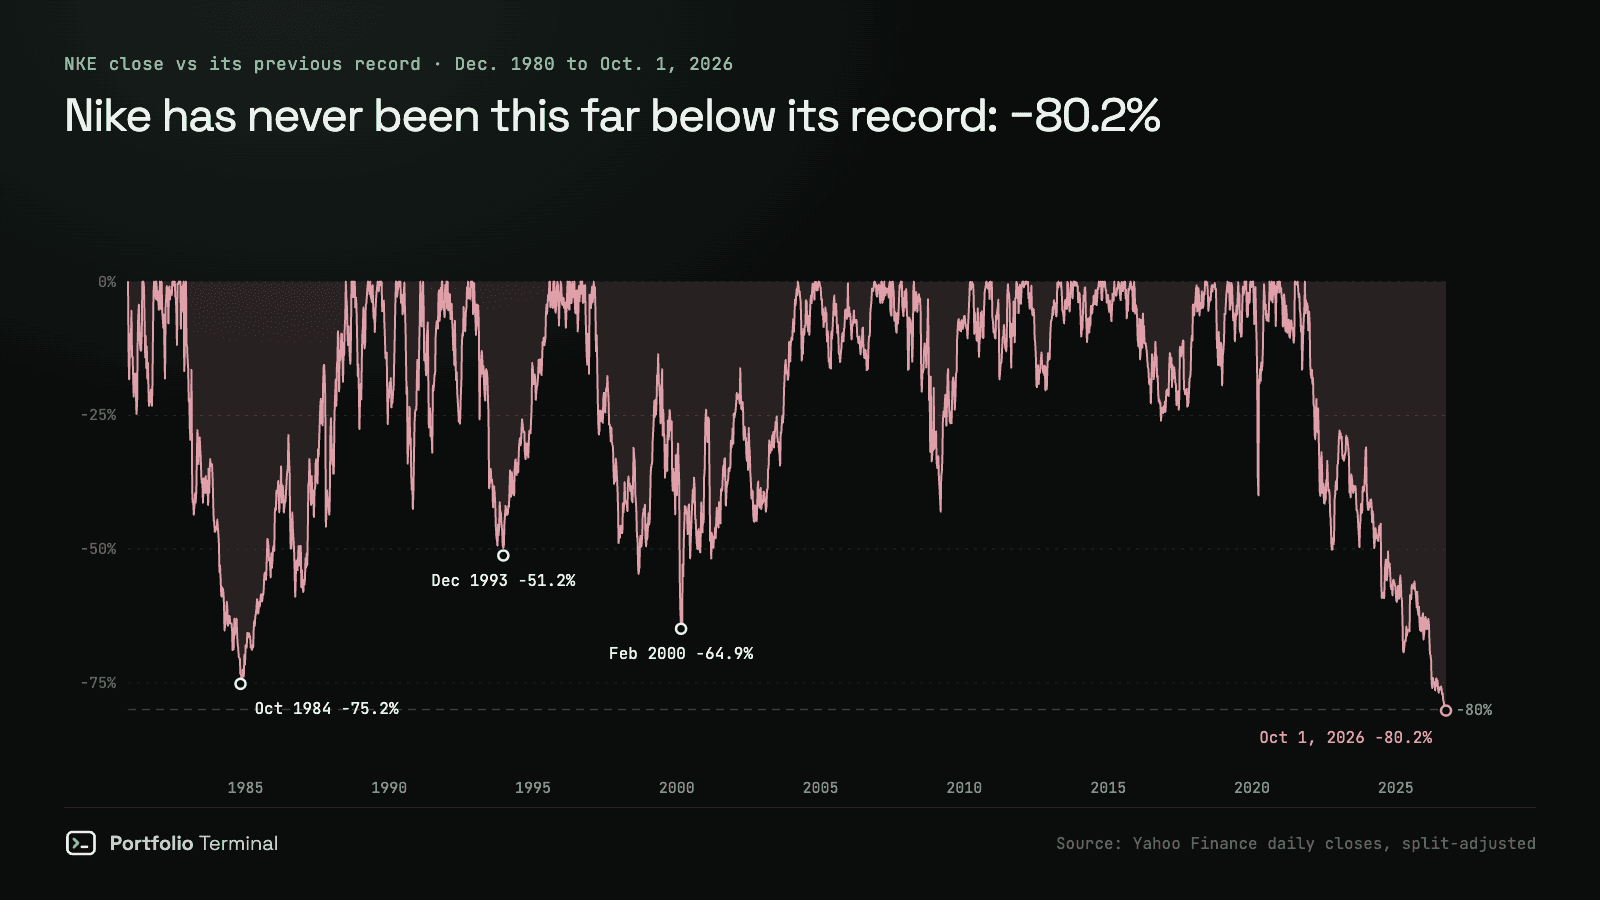
Nike at $35 is not the deal of a lifetime. What would $500 for 10 years do?
Only if record profit returns
All articles
Newest first.
Ideas tested on data
One question each, answered with decades of prices, costs included. The ideas that fail are published too.
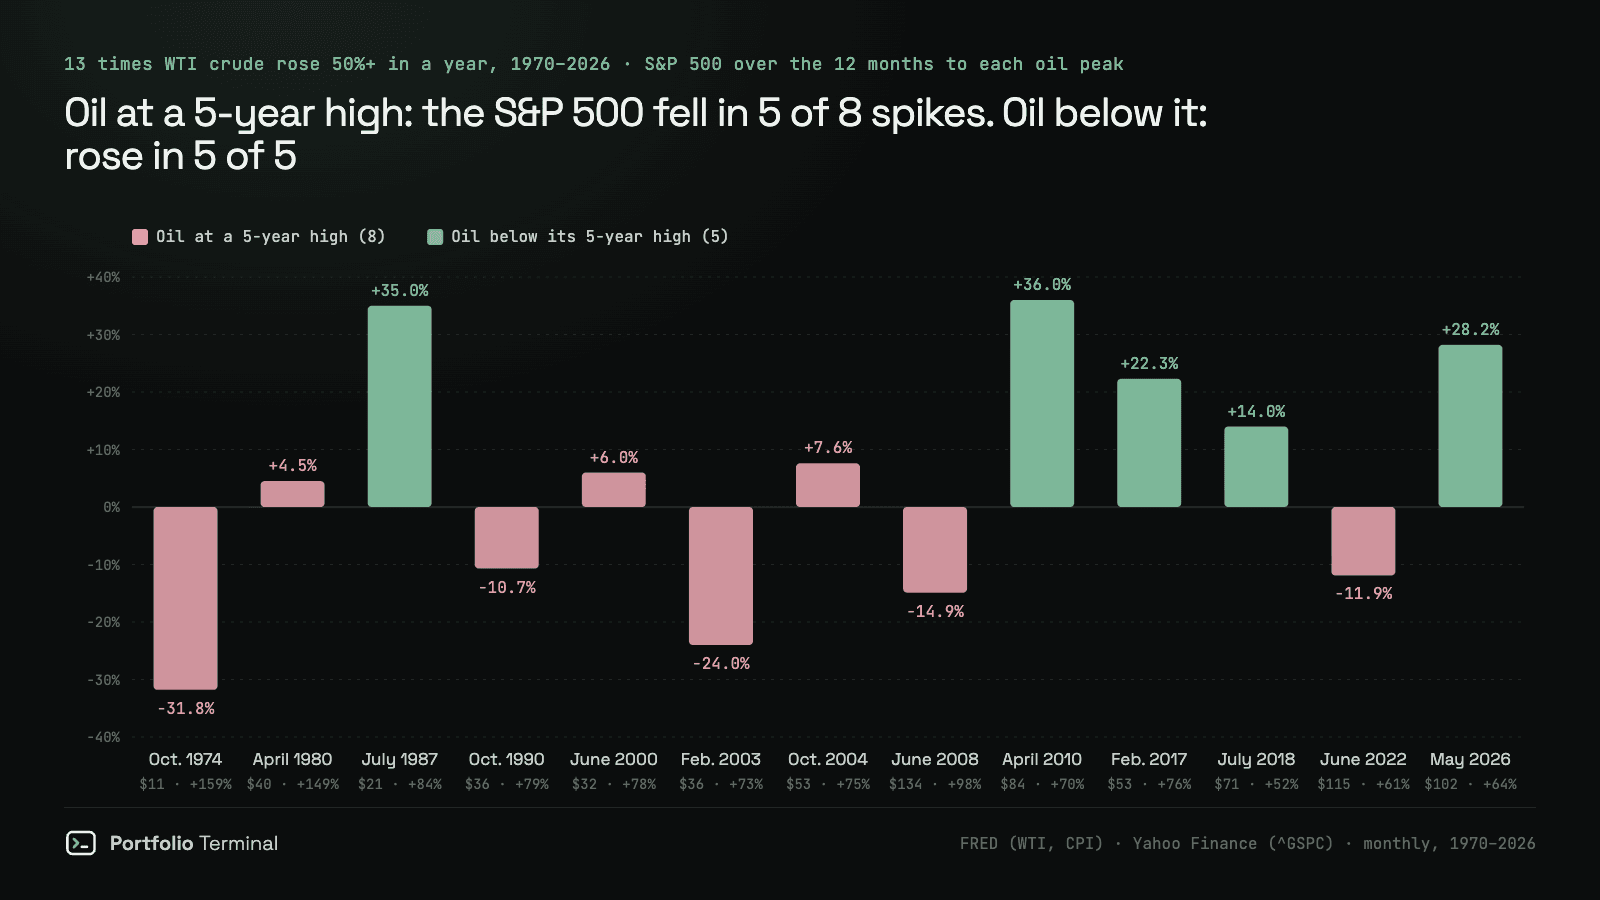
Do commodities drive the stock market? We measured 13 oil spikes since 1970
Through inflation, not directly
5 of 8oil spikes to a 5-year high since 1970 that came with a falling S&P 500; 0 of 5 under it
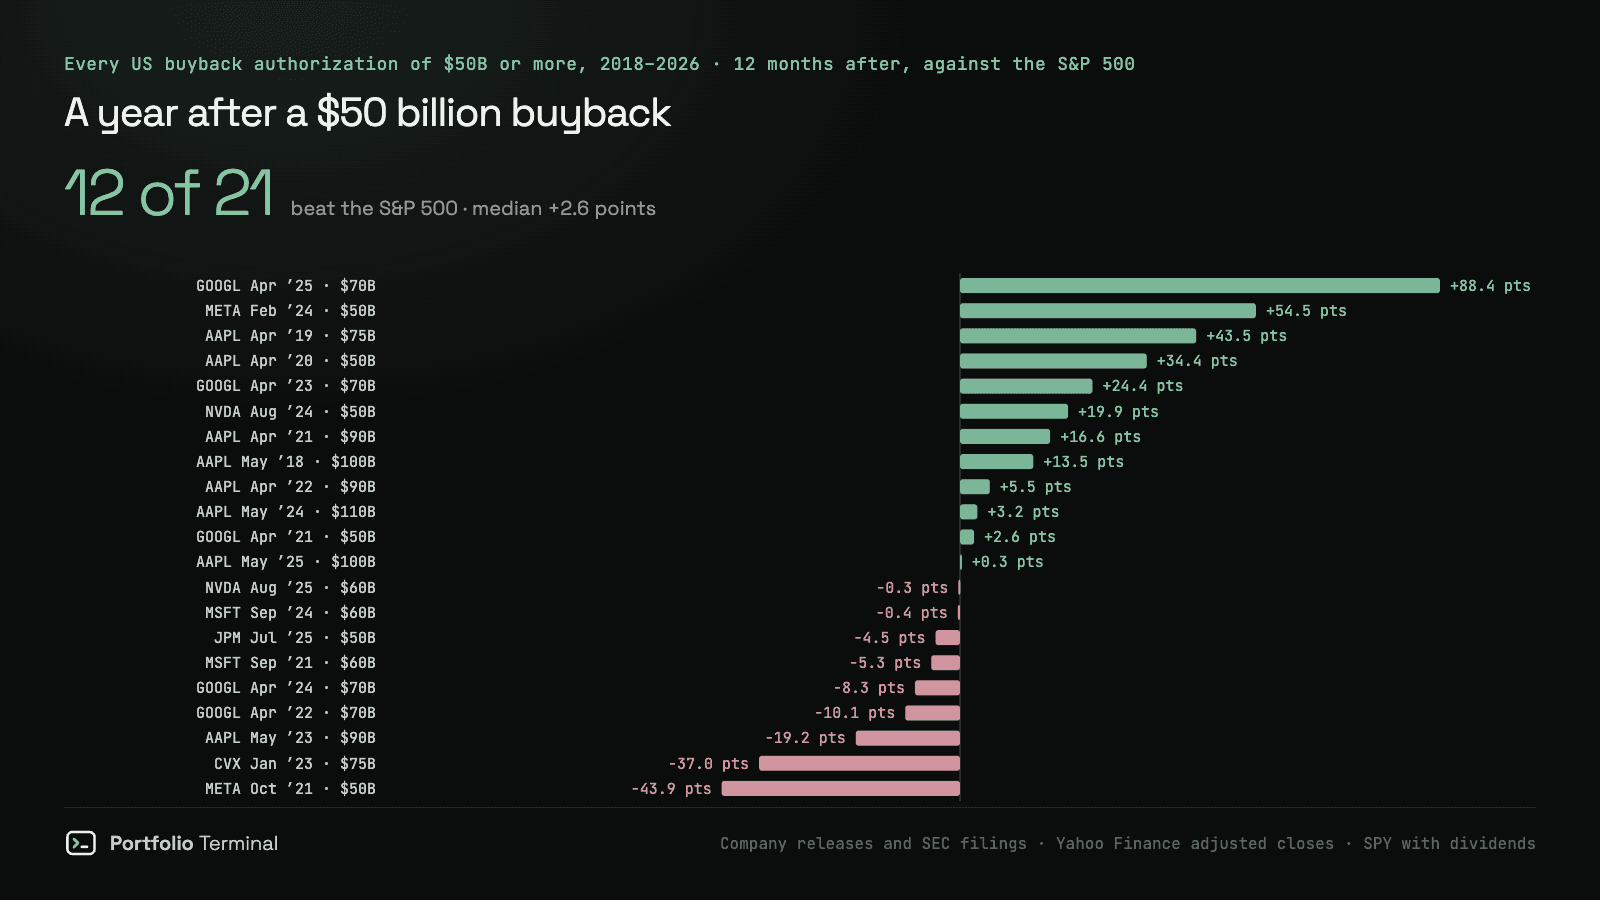
Nvidia's $150 billion buyback: what the 24 record buybacks before it did next
Close to a coin flip
12 of 21US buybacks of $50B or more that beat the S&P 500 over the next 12 months
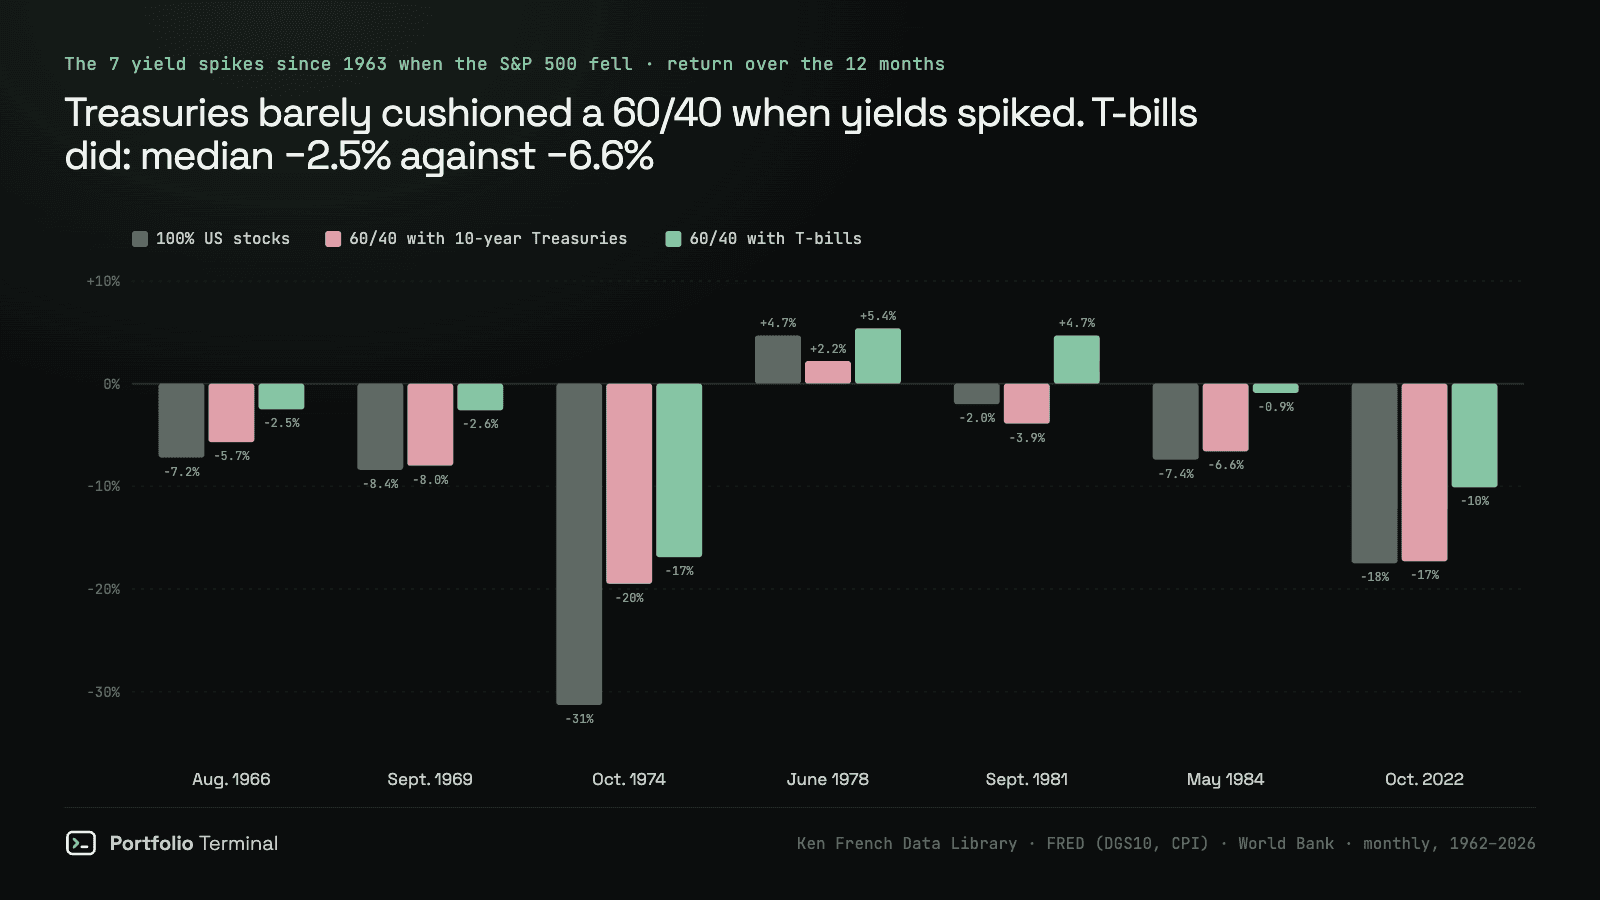
What held up when bond yields spiked? 20 episodes since 1963
Cash, not bonds
7 of 7yield spikes that sank stocks where T-bills still rose; 10-year Treasuries rose in none
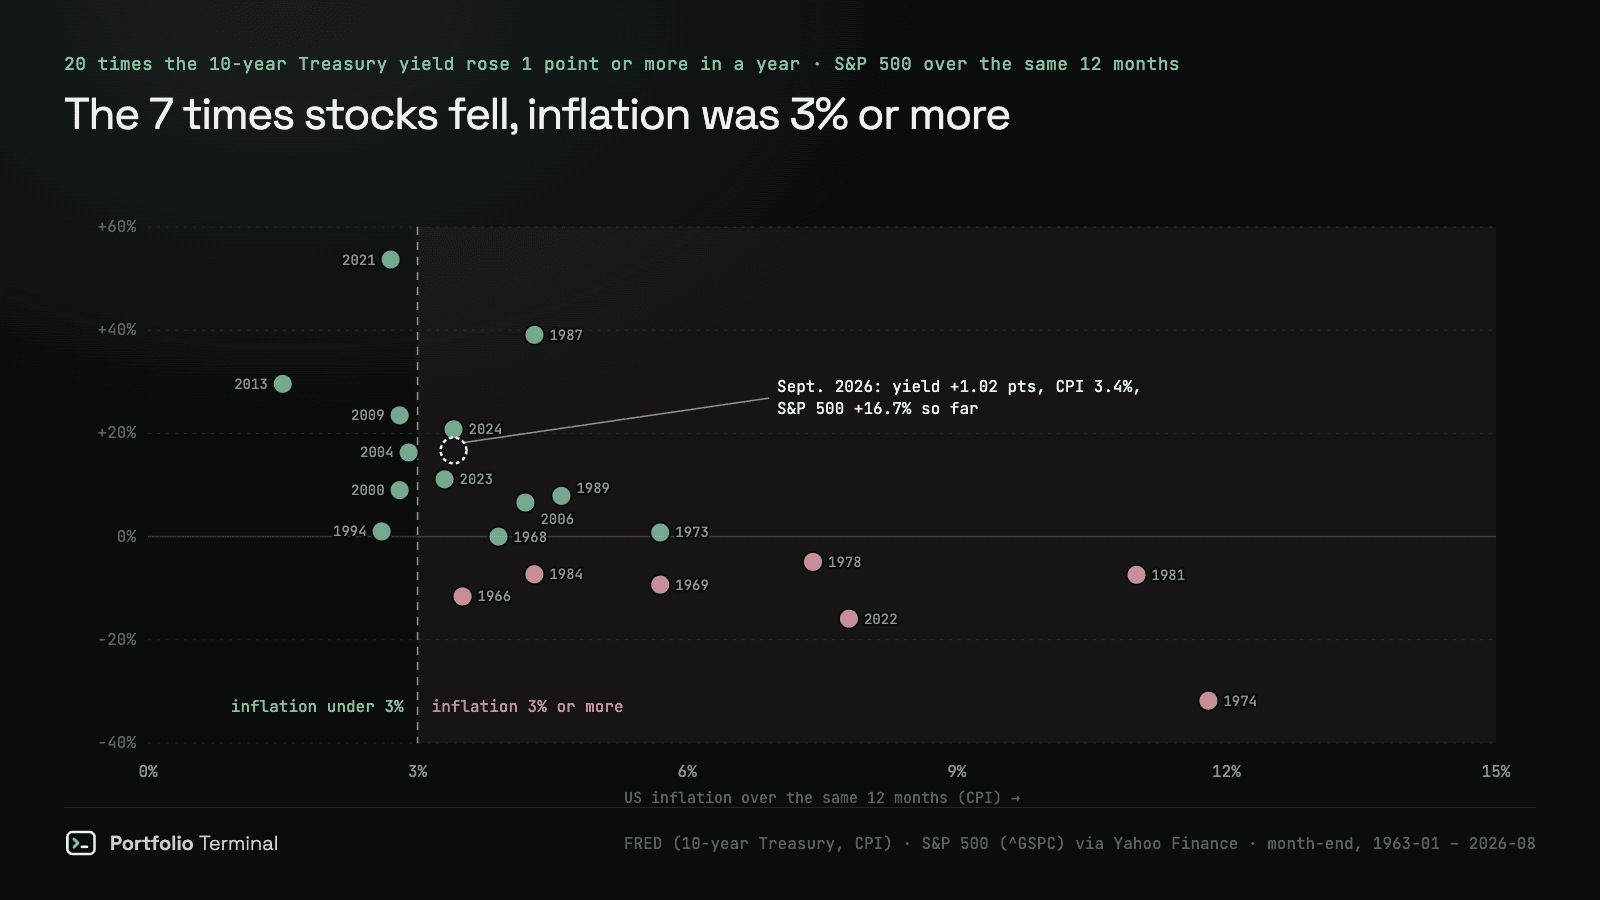
Do stocks fall when bond yields rise? 20 yield spikes since 1963
Only with inflation
7 of 20yield spikes since 1963 came with a falling S&P 500, all with inflation at 3%+
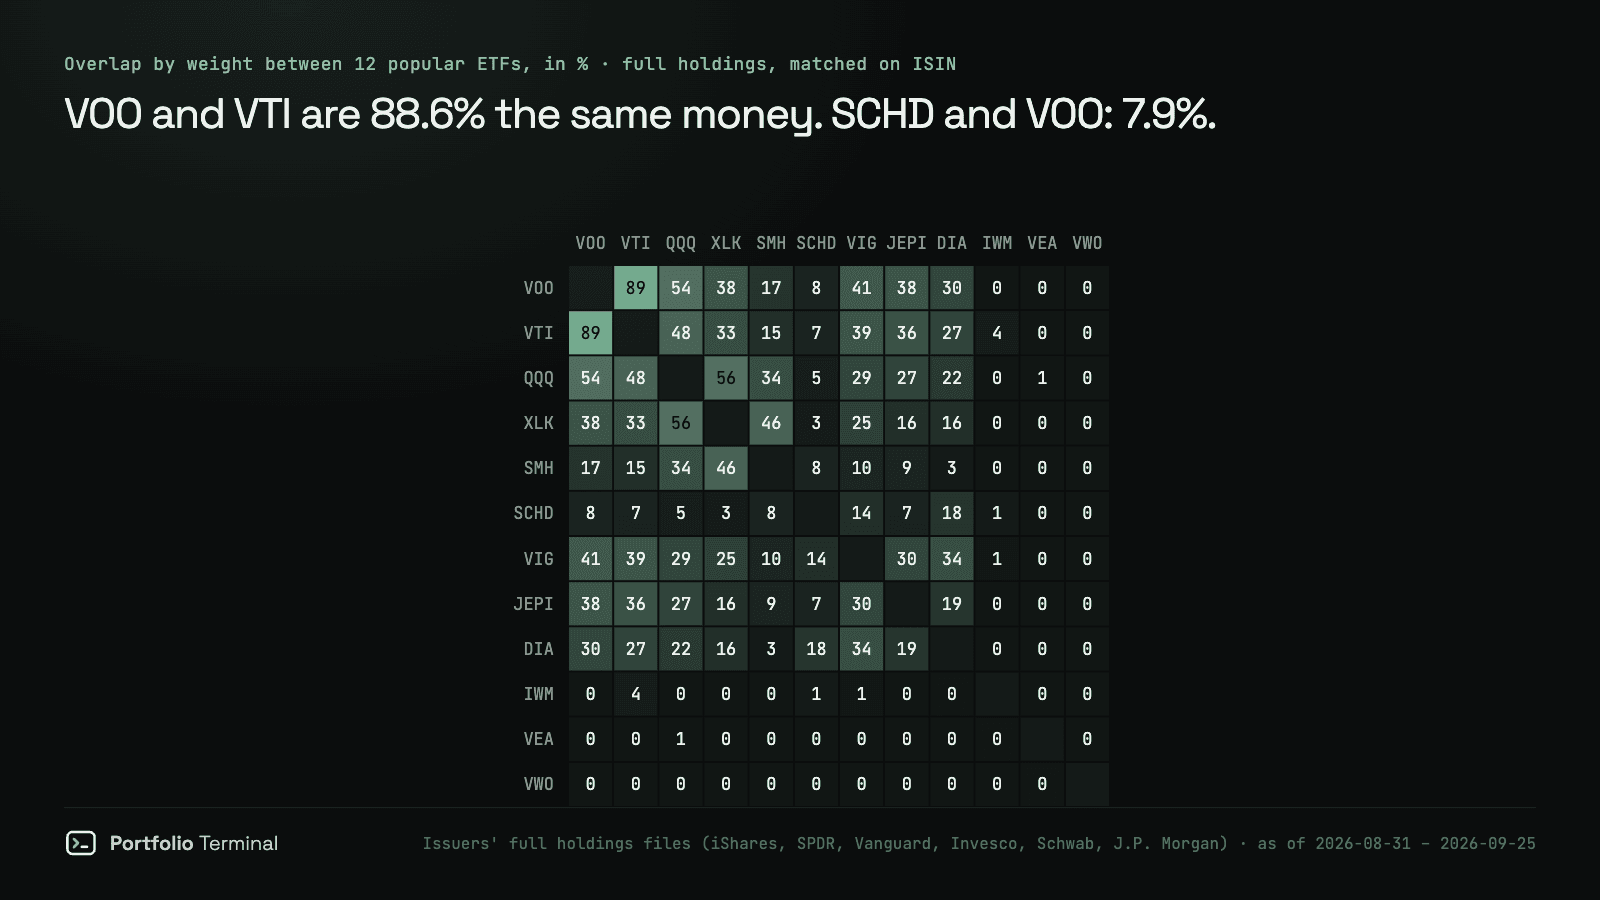
30 popular ETFs, 435 pairs: which ones are the same fund?
Often not
88.6%of VOO and VTI is the same money, 435 pairs measured
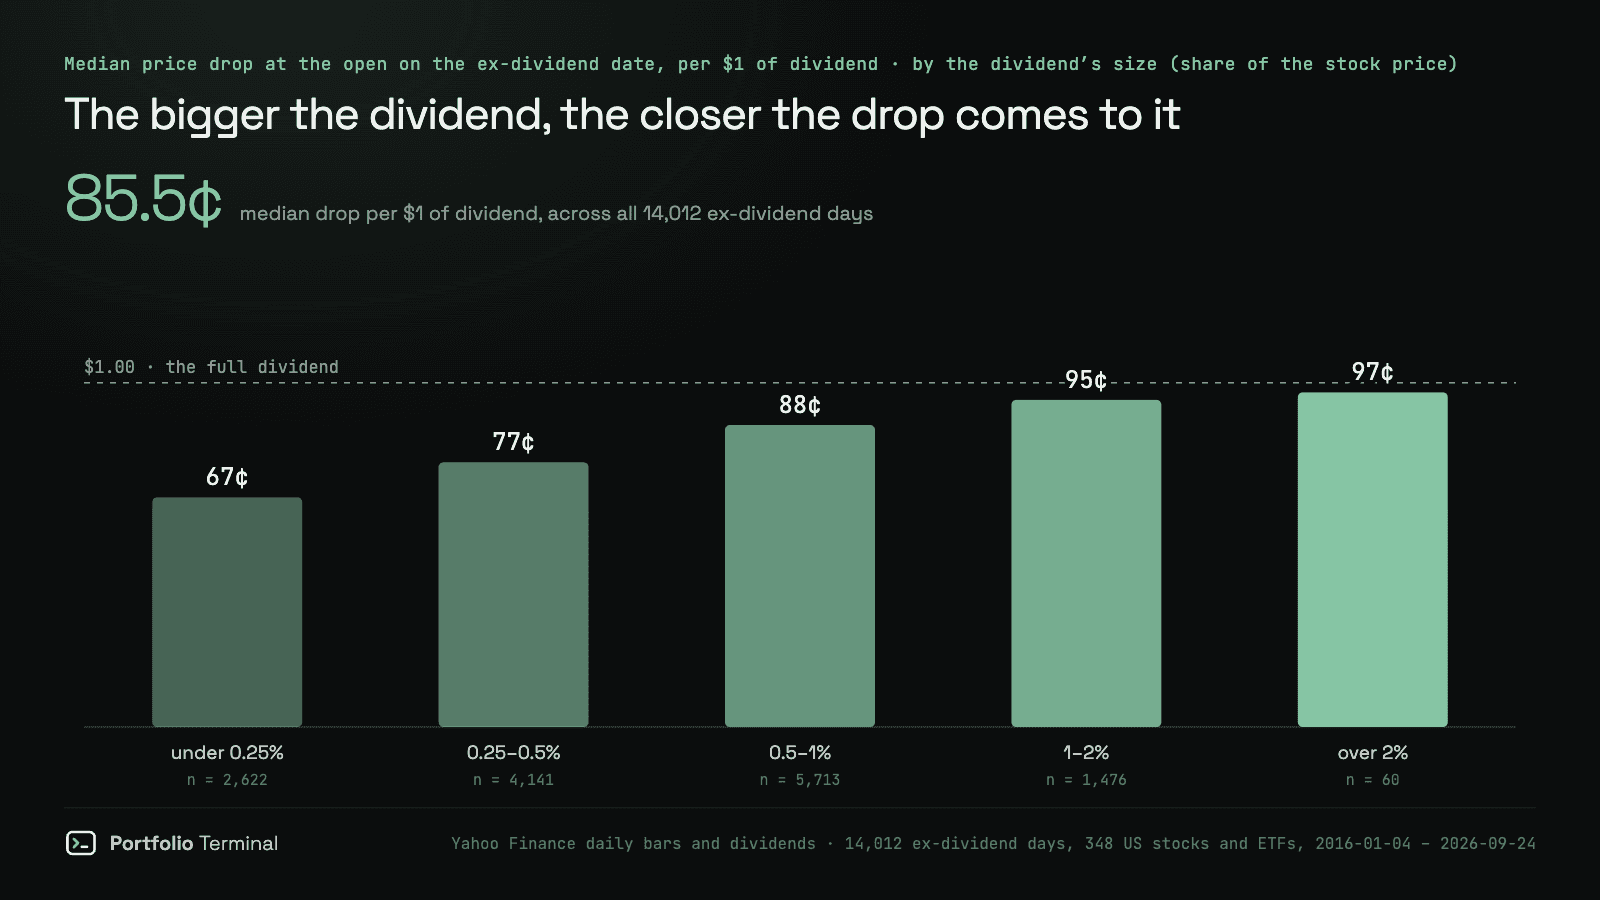
Does a stock drop by the dividend on the ex-date? We measured 14,012
Most of it
85.5¢median drop at the open per $1 of dividend, 14,012 ex-dates
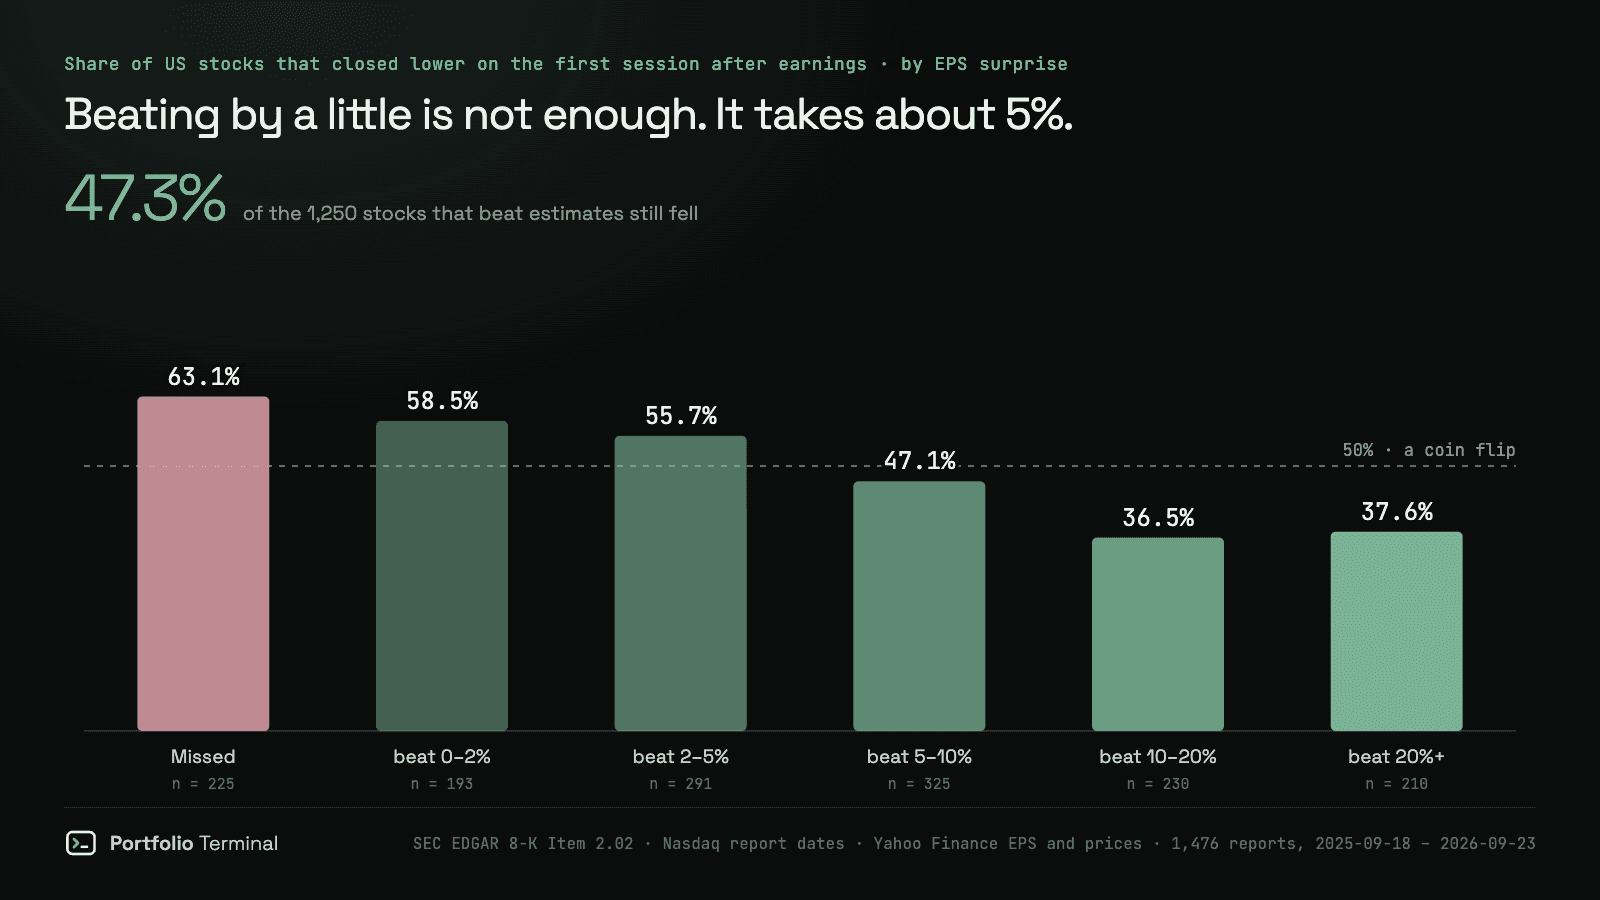
Why stocks fall after beating earnings: we checked 1,476 reports
A coin flip
47.3%of 1,250 beats closed lower the next session
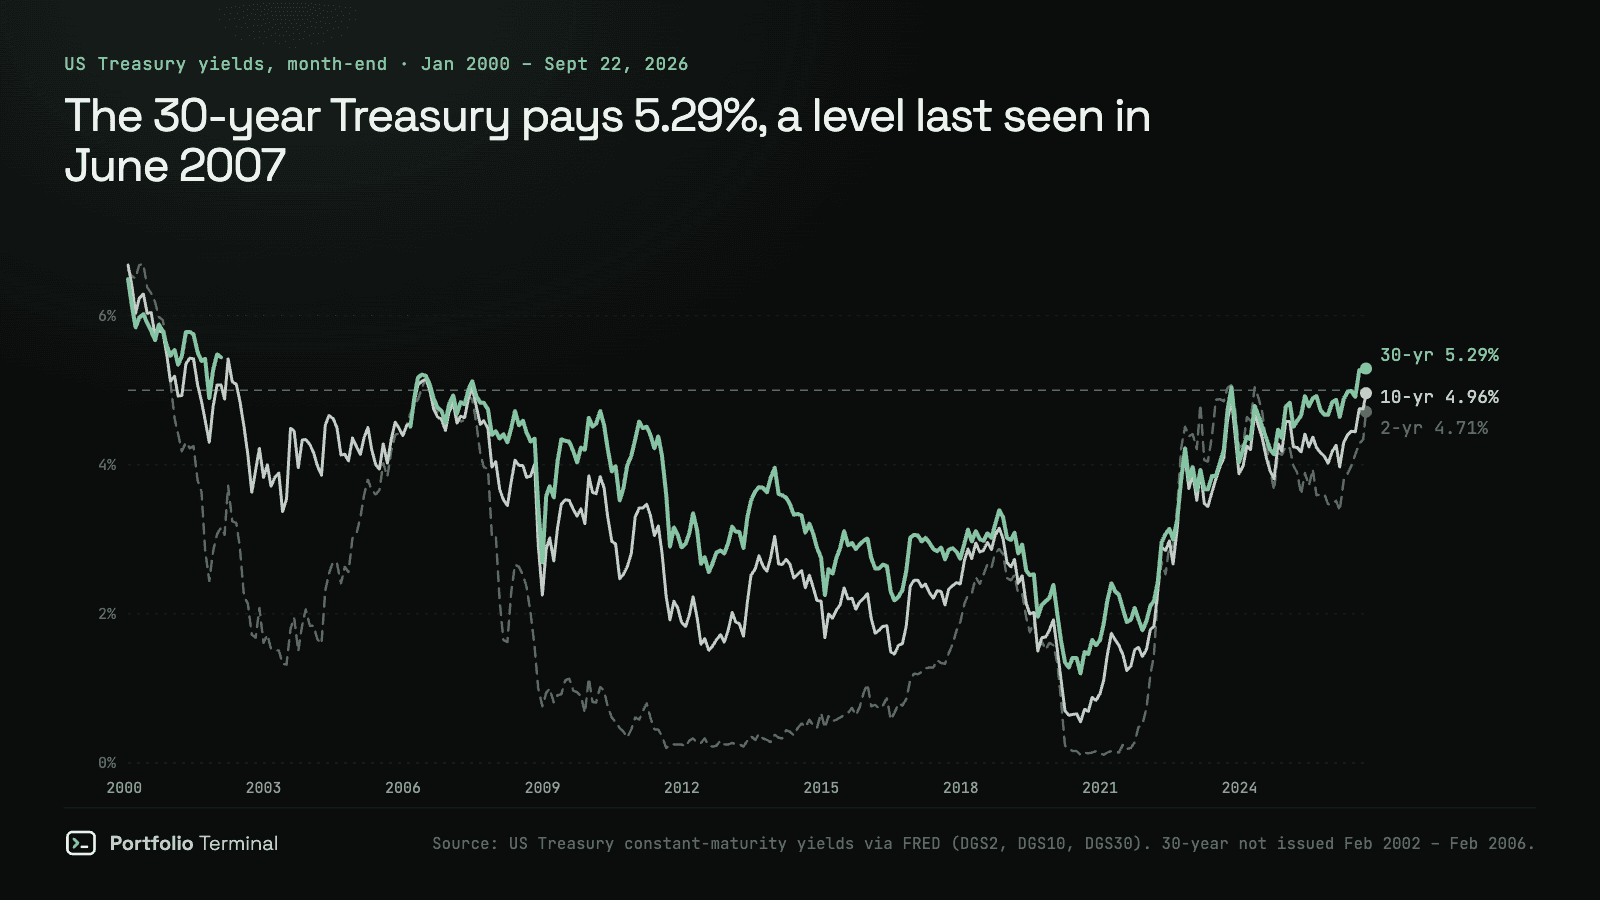
Long-term Treasuries at 5%: what you can gain, what you can lose, and how to hedge
No edge
0 of 3models that beat “no change”, 429 forecasts
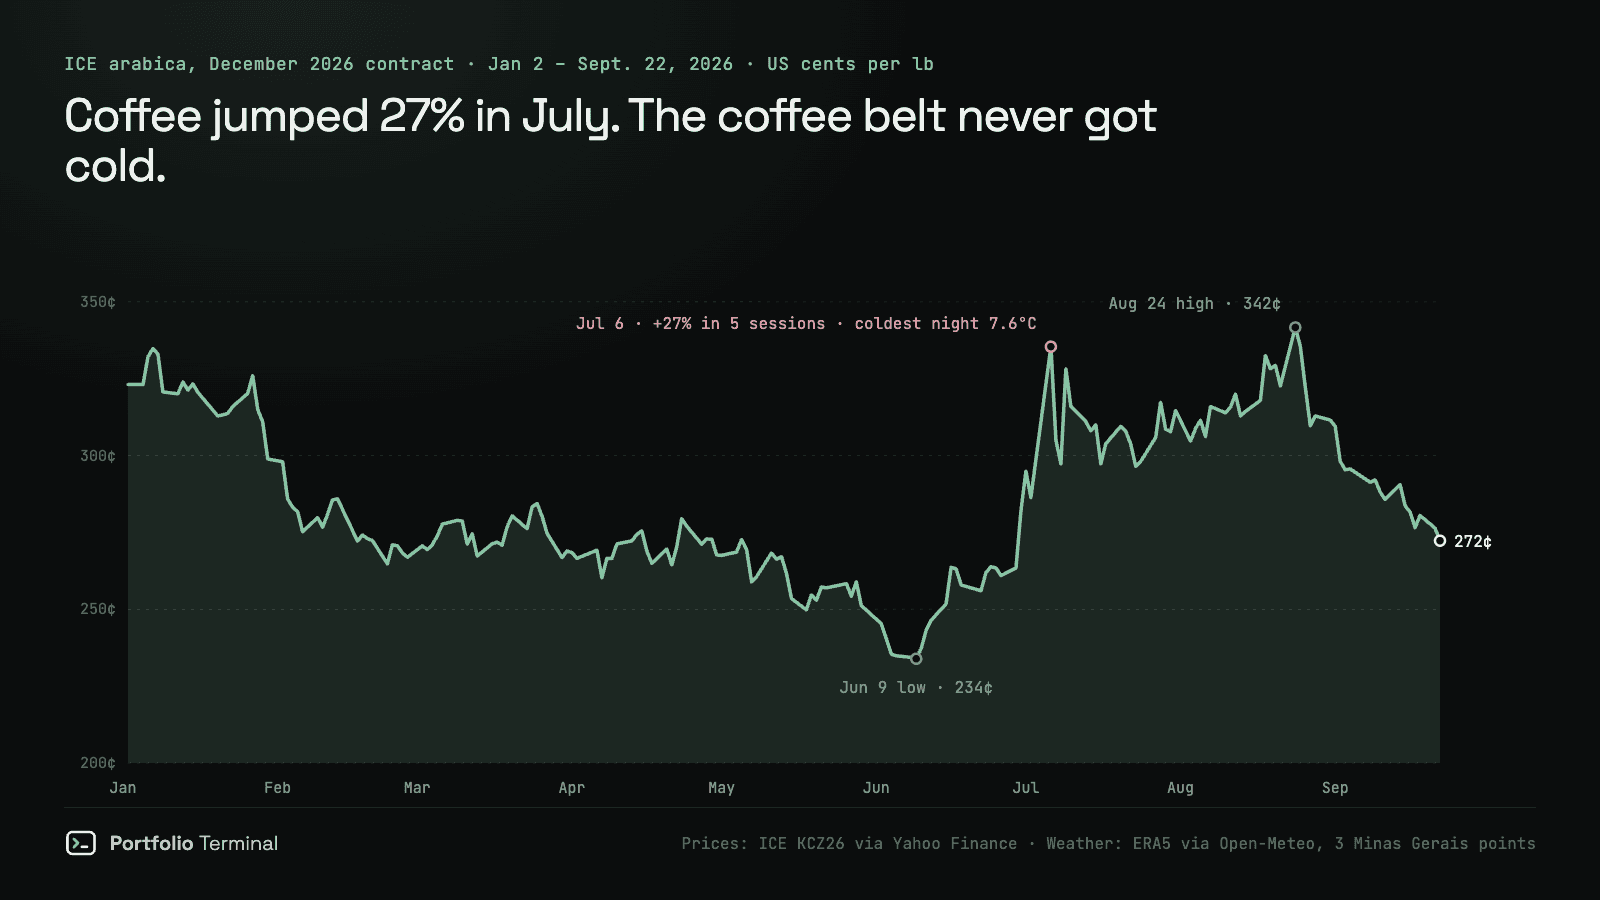
Can you trade coffee on the weather? We backtested it, 2016–2026
No edge
−10.6%weather model, 20 months out of sample
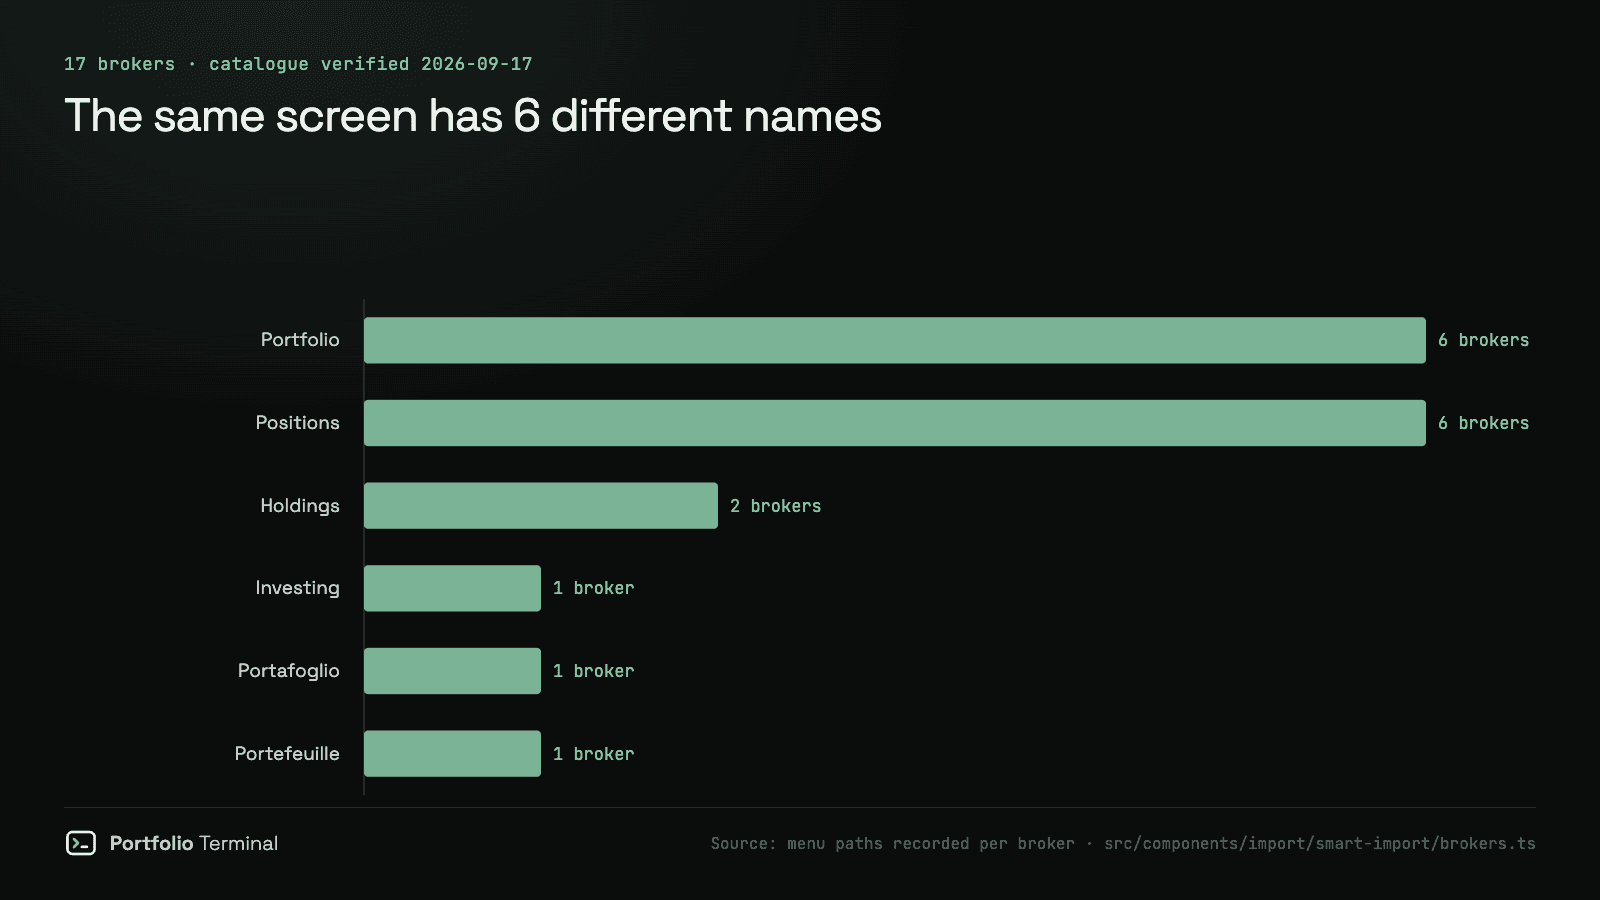
Where Your Holdings Hide: 17 Brokers, 6 Names for One Screen
No convention
6 namesfor one screen, across 17 brokers
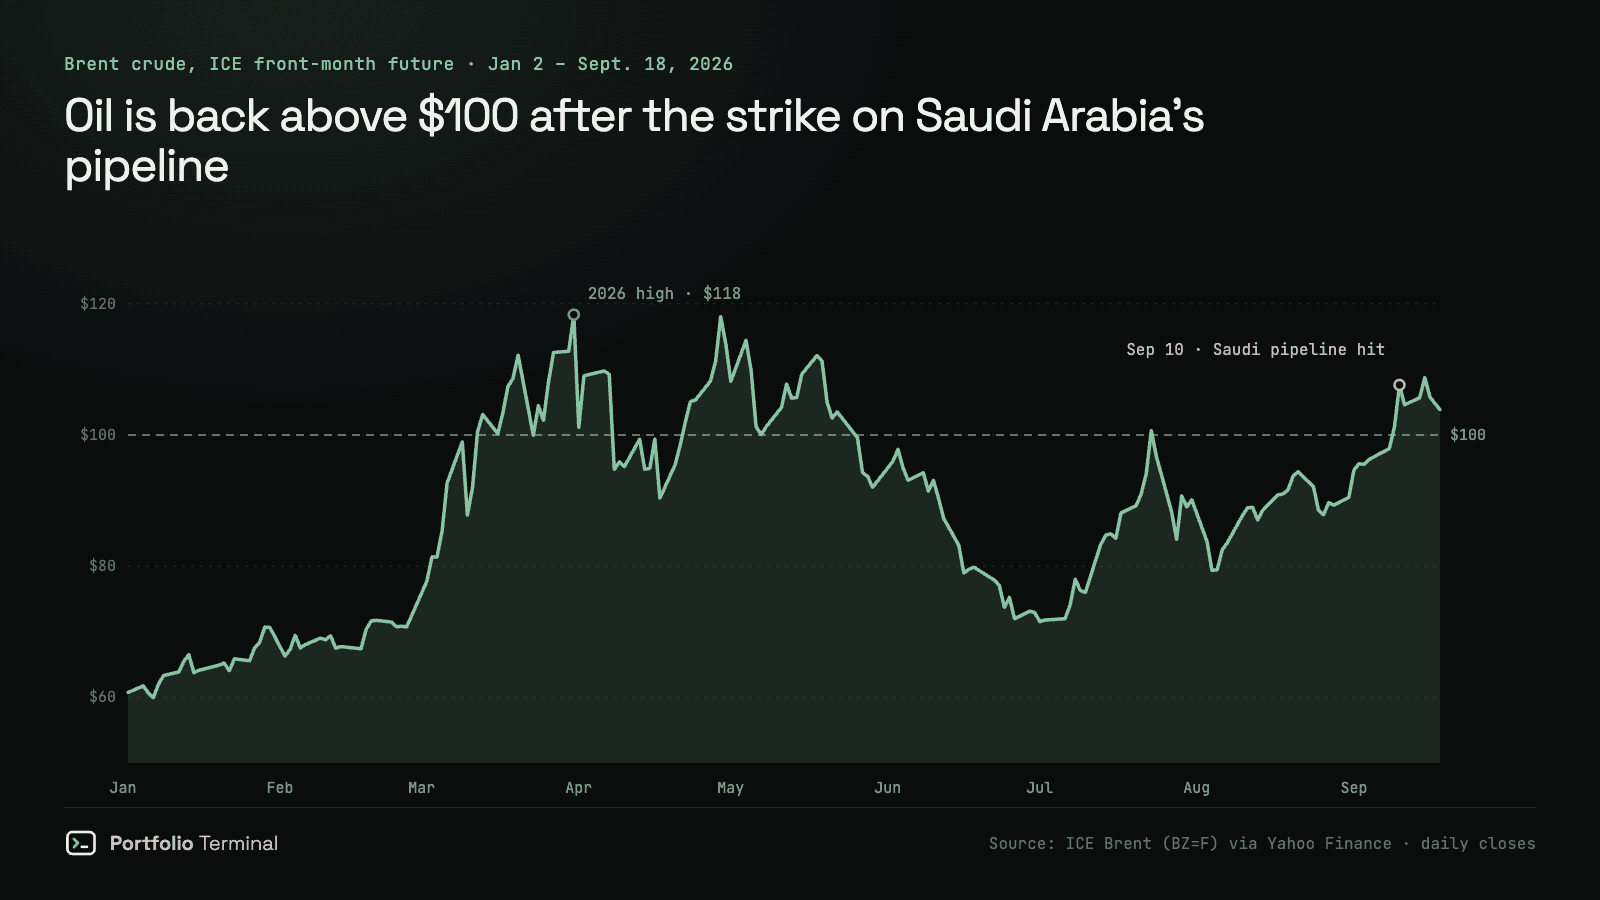
How Russia, Saudi Arabia and oil move your portfolio — and whether gold protects it
Not for long
−14.6%gold vs its pre-war price, Nov. 3, 2022
Market notes
What moved, dated to the session, with the figures that matter.
- August PCE inflation: 3.4%, core 3.0%, and a July that was rewrittenPCE inflation was 3.4% in August 2026 and core PCE 3.0%, under the 3.7% and 3.3% forecast. But the same release revised July to 3.4% and 3.0%: August did not cool, the past did. What it means for bonds, stocks and your portfolio.
- Anthropic IPO leak: $4.6B in revenue, but what does $42B in losses mean?Anthropic IPO leaks show $4.6B revenue and a $42B net loss. Understand the accounting charge, compute commitments and valuation before reading the headlines.
- Stock market week in review, Sept. 21–25, 2026: stocks up, the 10-year at 5.18%S&P 500 7,743.41 (+1.21% on the week). Nasdaq 27,068.72 (+2.06%). Dow 51,828.62 (+0.28%). Russell 2000 −0.80%. The 10-year Treasury yield closed at 5.184%, its highest since July 2007. What moved markets Sept. 21–25, 2026.
- Ondo puts BlackRock-designed portfolios onchain. What it means for the ONDO tokenOn Sept. 24, 2026, Ondo launched three portfolio tokens built on BlackRock model strategies. What they are, what BlackRock actually does, where Ondo stands in tokenized assets, and why the ONDO token, 80% under its 2024 peak, is a different bet from the products.
- The 10-year Treasury yield closes at 5.11%, its highest since 2007The 10-year Treasury yield closed at 5.11% on Sept. 23, 2026, up 0.15 points in a day and its highest close since July 2007. The 2-year rose to 4.85% and the 30-year to 5.40%. Why it jumped, and what it means for bonds, stocks and loans.
Guides
The basics, written to stay true: risk, valuation, returns and tracking.
- guideHow to Track Your Portfolio Without Spreadsheet ChaosIf your holdings only make sense after a few spreadsheet fixes, this guide shows a simpler way to keep performance, income, and risk in one view.

- guideComplete Guide: How to Analyze a Stock in 2026Master fundamental and technical analysis to make informed investment decisions. Discover key metrics, signals to watch, and professional tools used by investors.
- How to Calculate Your Portfolio Return (and Why Your Broker Disagrees)Your broker says one number, your spreadsheet says another, and neither is wrong. Here is what simple, money-weighted and time-weighted returns each measure, and which one answers your question.
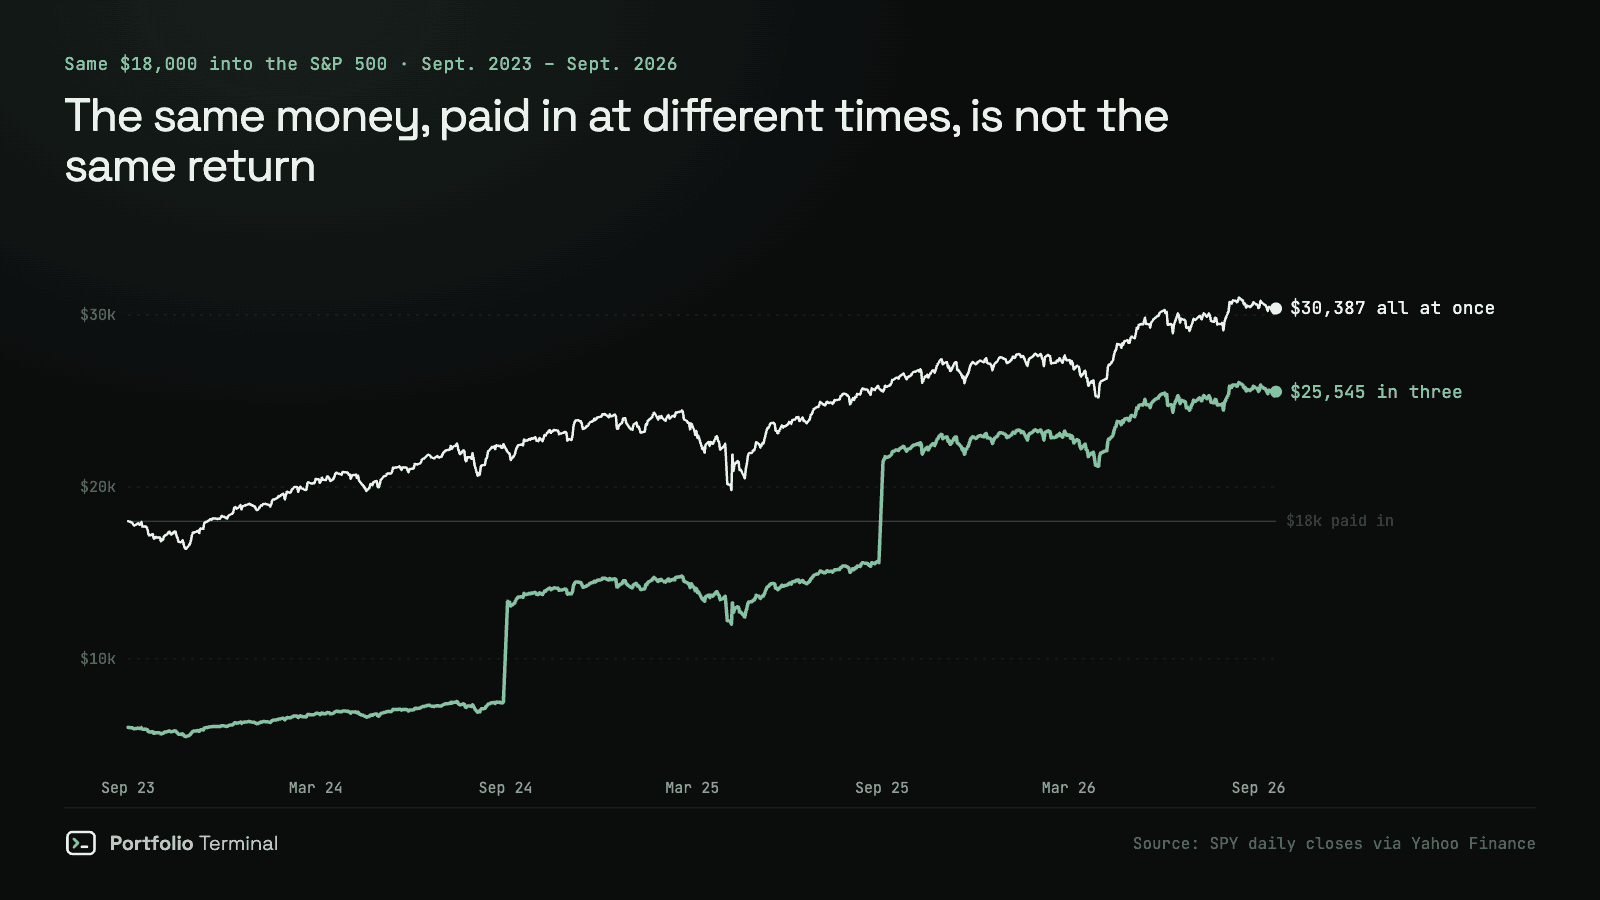
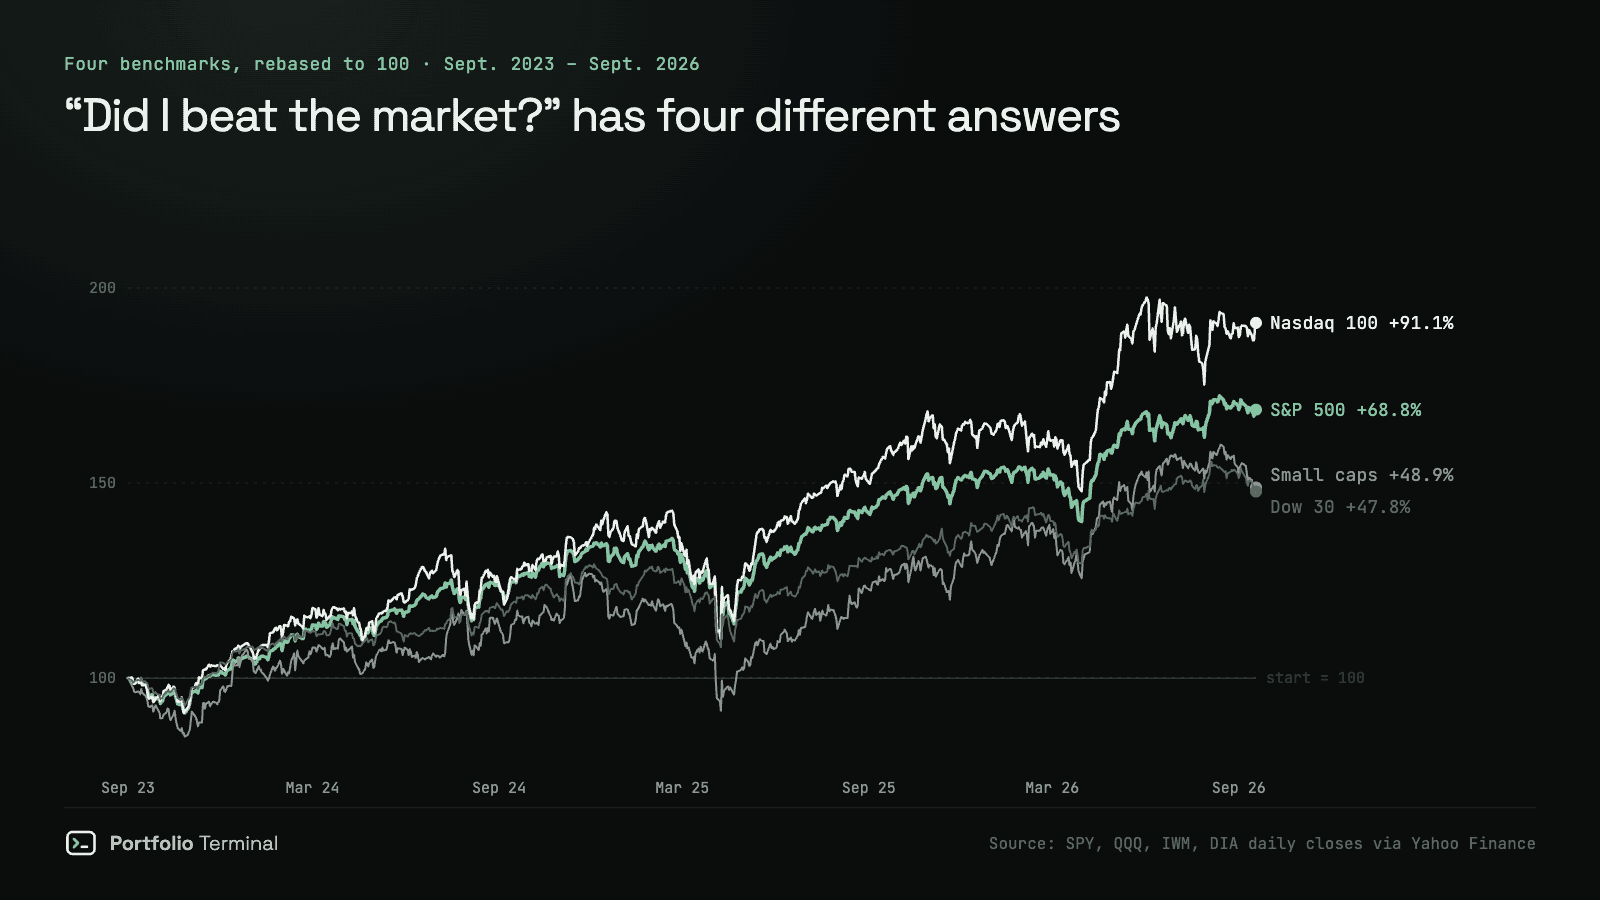
- How to Benchmark Your Portfolio Against the S&P 500Beating the market depends entirely on which market you picked. Over the same three years four common benchmarks were 43 points apart, and most portfolios should not be measured against any of them alone.
- Is My Portfolio Actually Diversified?A portfolio can look busy and still be concentrated. This checklist helps you spot hidden overlap in positions, sectors, currencies, and risk.

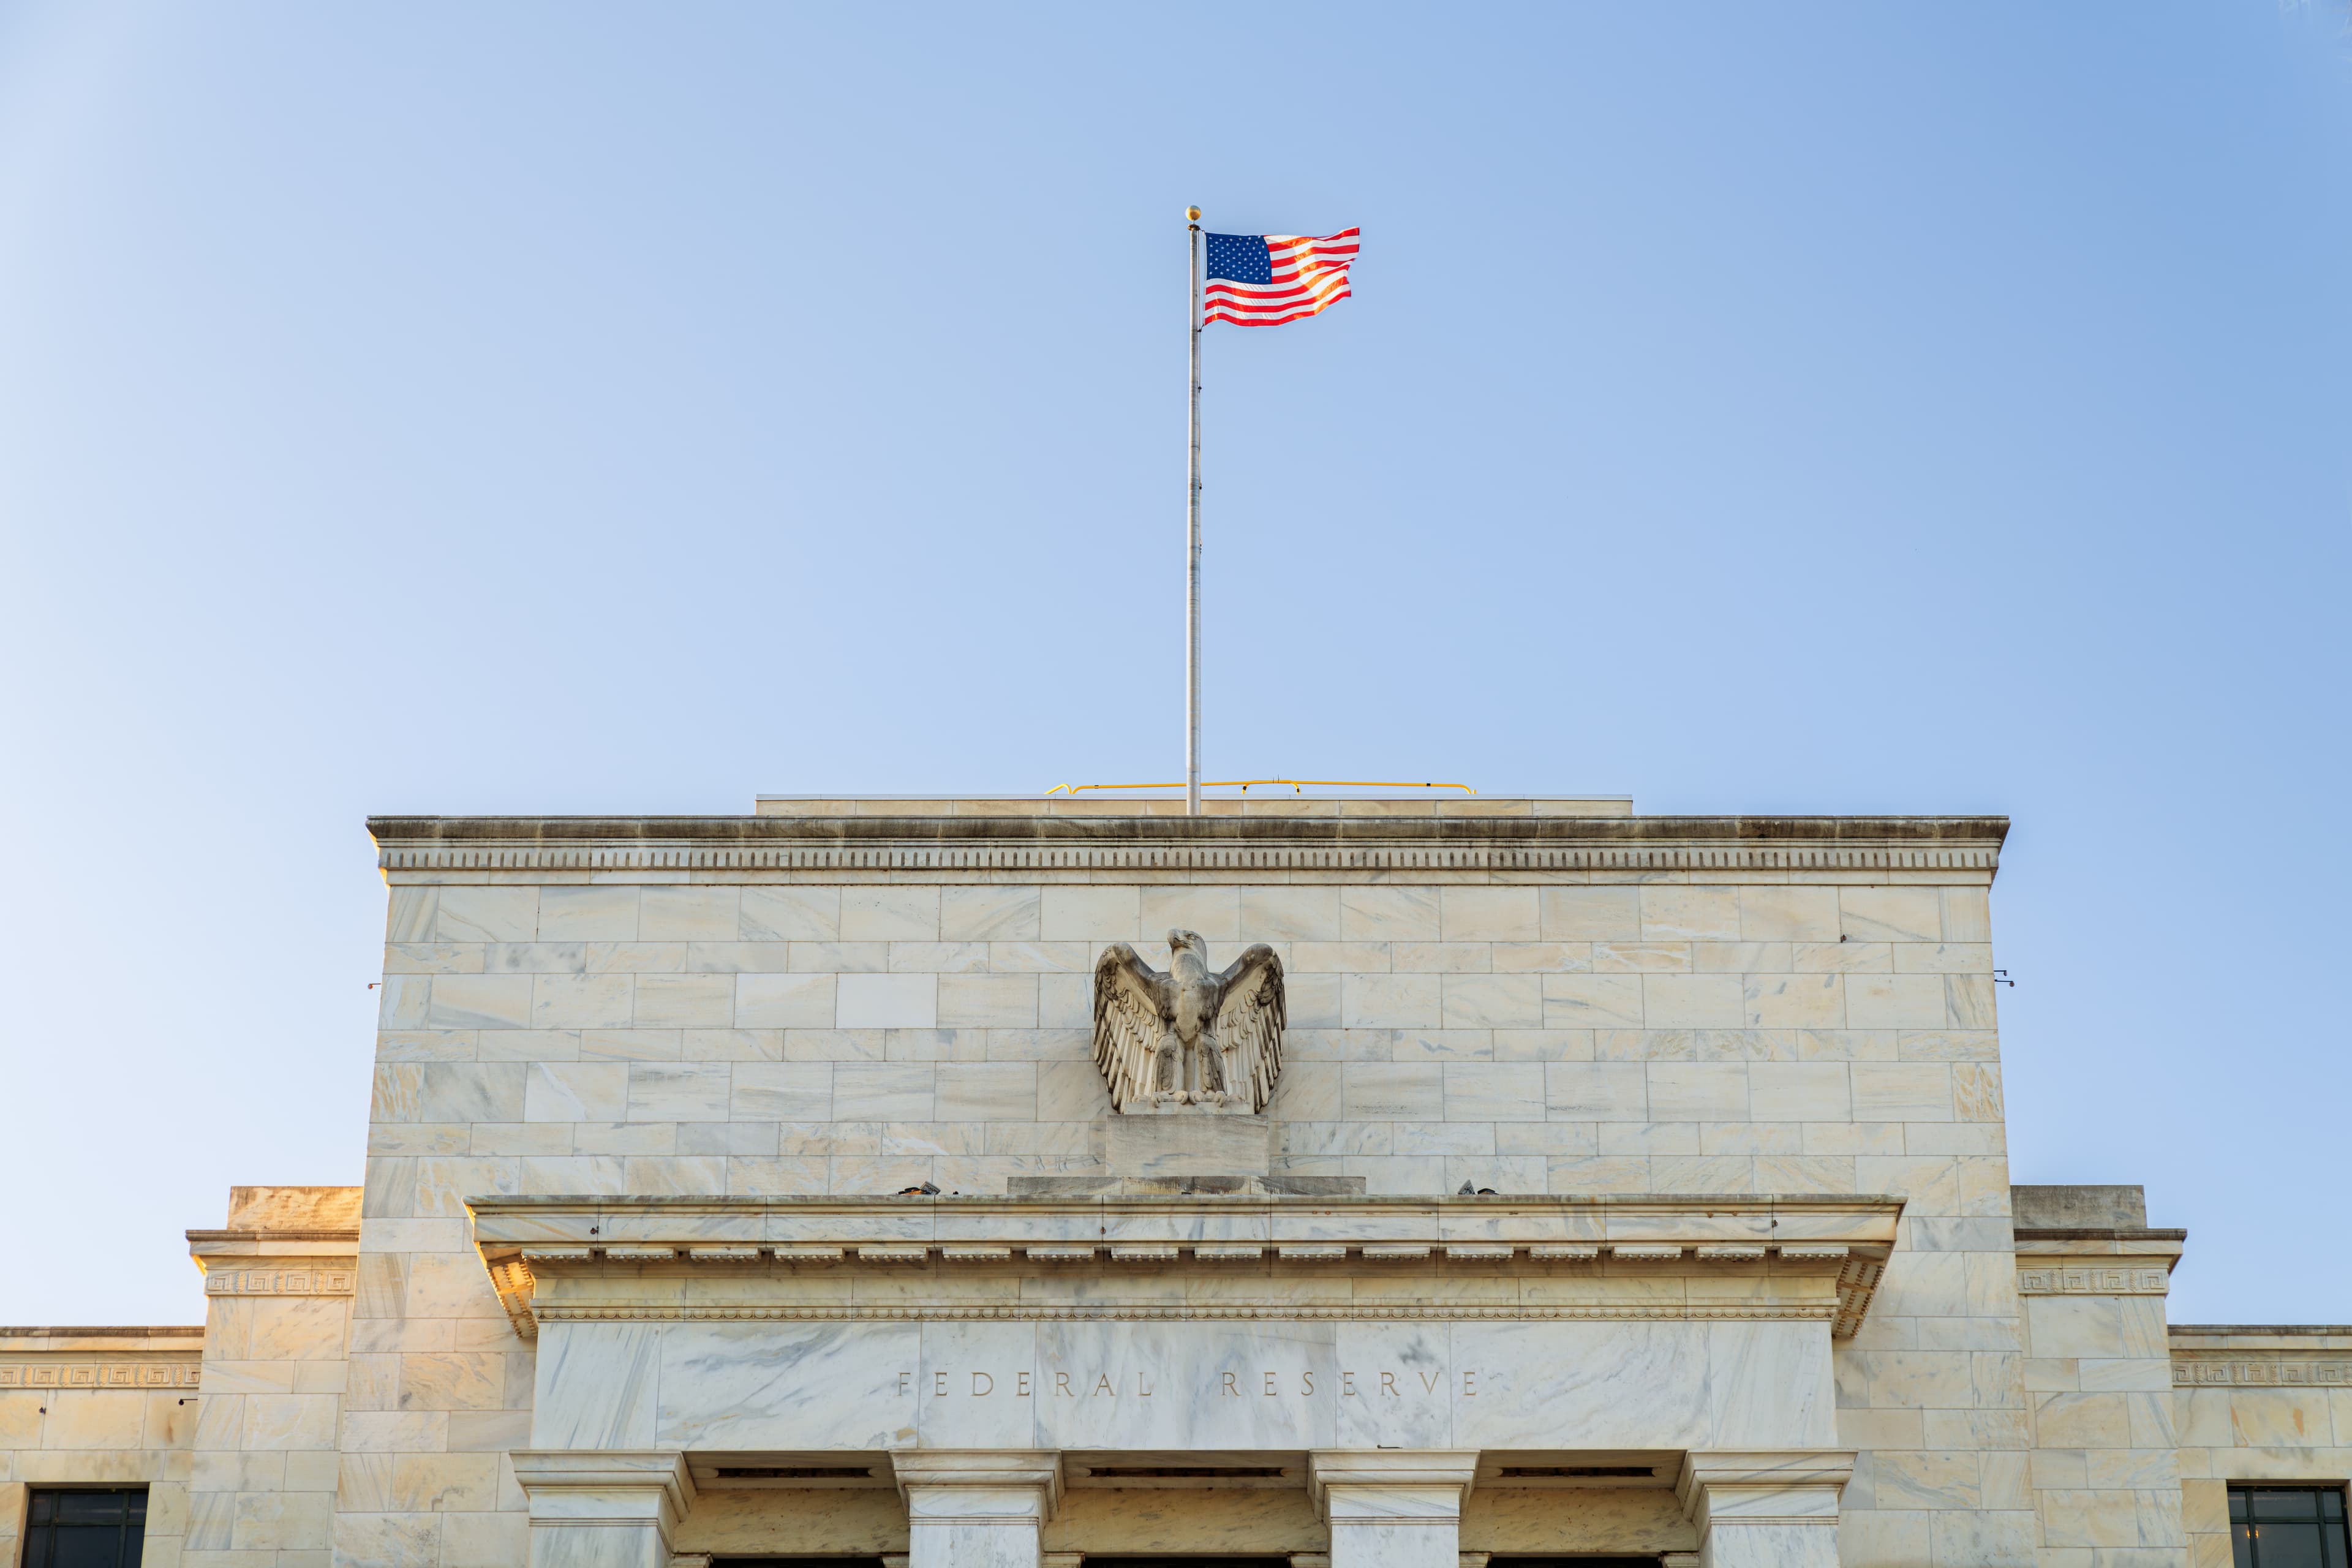
- What the Fed Actually Changes for Stocks, Rates, and the EconomyA plain-English explainer on why everyone watches the Federal Reserve, what rate decisions change in real life, and why markets often move before the headline feels obvious.
Investor Playbooks
Broad-market explainers built to work as clean landing pages from TikTok, X, and search.
Search Intent Guides
Straight answers to the questions investors search for most.
Open Bell Brief
Wall Street in 60s. Get the free brief.
Stocks, macro and the moves that mattered, in one short read every morning before the open.
One short email before the open. Unsubscribe anytime.
Tracking your own portfolio? Import it from any broker