September CPI: 3.7% inflation, 2.6% core, and which one stocks have answered to
US CPI inflation was 3.7% in September 2026 and core CPI 2.6%, the BLS reported on October 14, both a tenth over the 3.6% and 2.5% economists polled by Dow Jones expected. In the 20 times since 1963 the 10-year yield rose a point in a year, the S&P 500 fell 7 times, always with core CPI at 3% or more.

· 7 min read
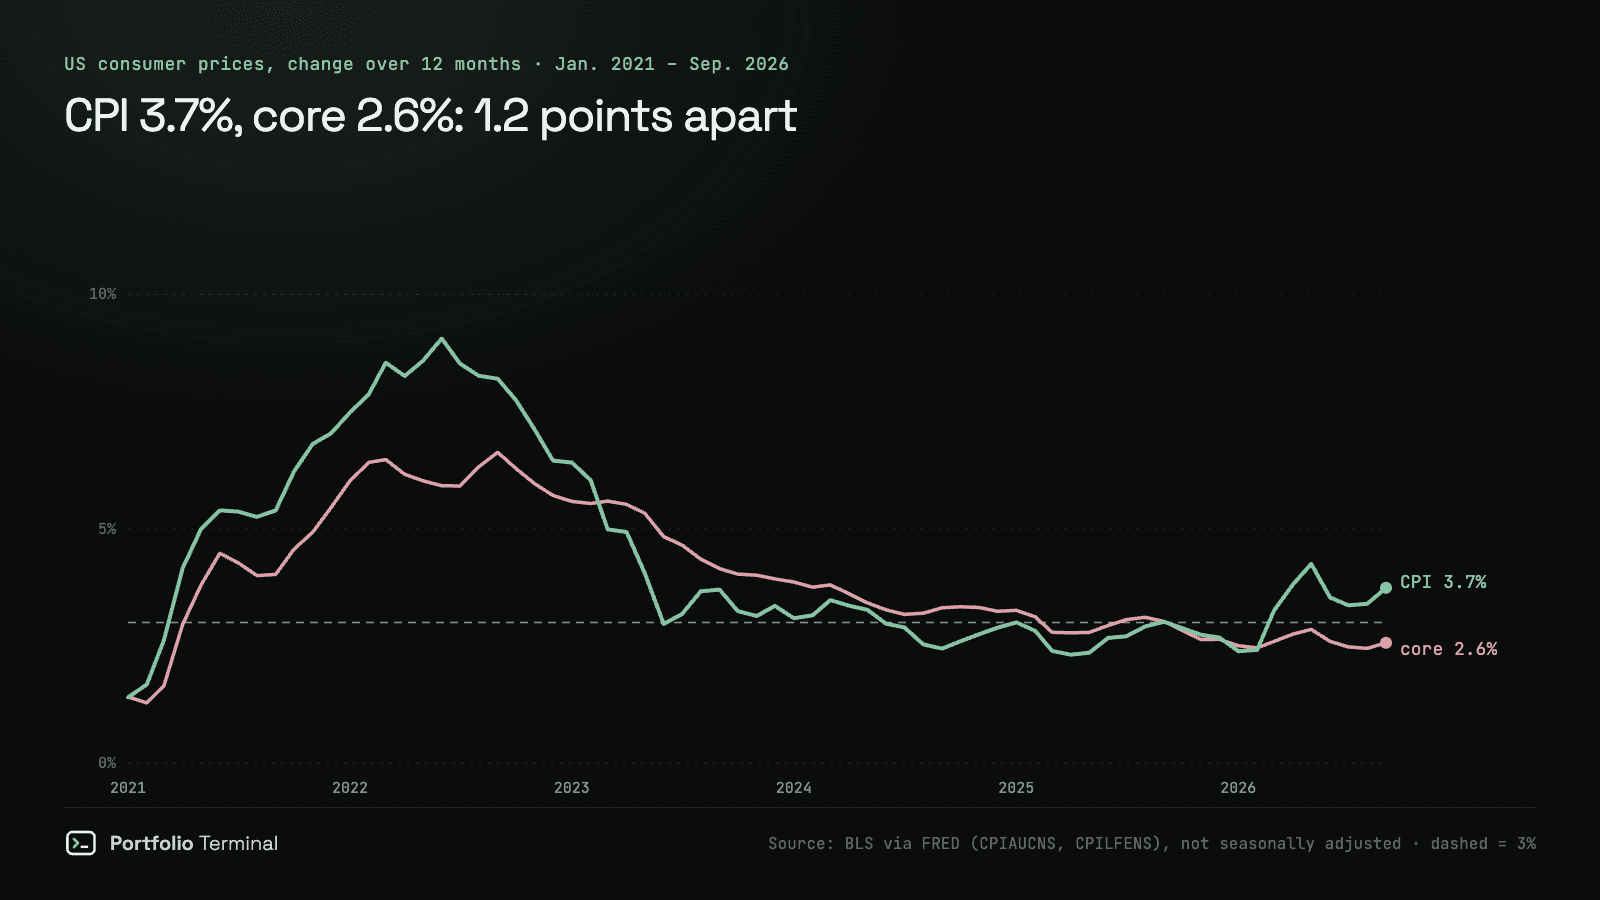
The short version: US consumer prices rose 3.7% in the 12 months to September 2026, the Bureau of Labor Statistics reported on Wednesday, October 14. Core CPI, without food and energy, rose 2.6%. Both came in a tenth over what economists polled by Dow Jones expected. The gap between the two is gasoline.
Core is the one to watch for a portfolio. When the 10-year Treasury yield jumped a full point or more in a year, which happened 20 times since 1963, stocks ended the year lower only when core inflation was 3% or more. Core is 2.6% today, and the 10-year yield is up 1.16 percentage point on the year.
The September CPI numbers
| Consumer price index | September 2026 | Forecast | August 2026 |
|---|---|---|---|
| All items, 12 months | 3.7% | 3.6% | 3.4% |
| Core (no food, no energy), 12 months | 2.6% | 2.5% | 2.4% |
| All items, one month | 0.6% | 0.6% | 0.4% |
| Core, one month | 0.3% | 0.2% | 0.3% |
Forecasts: economists polled by Dow Jones, as reported by CNBC on October 13. The Cleveland Fed's nowcast, a model estimate built from daily oil and weekly gasoline prices, had 3.6% and 2.39%. The 12-month rates are the ones BLS headlines, not seasonally adjusted; the one-month changes are seasonally adjusted. The PCE price index the Fed targets comes later, on October 29; we covered August's in August PCE inflation: 3.4%, core 3.0%.
What moved, line by line:
| Component | One month (seasonally adjusted) | 12 months | 12 months in August |
|---|---|---|---|
| Energy | +5.2% | +20.4% | +16.3% |
| Gasoline | +9.1% | +34.2% | +27.4% |
| Food | +0.0% | +2.5% | +2.7% |
| Shelter | +0.4% | +3.2% | +3.0% |
| Core goods | +0.3% | +0.7% | +0.7% |
| Core services | +0.4% | +3.1% | +3.0% |
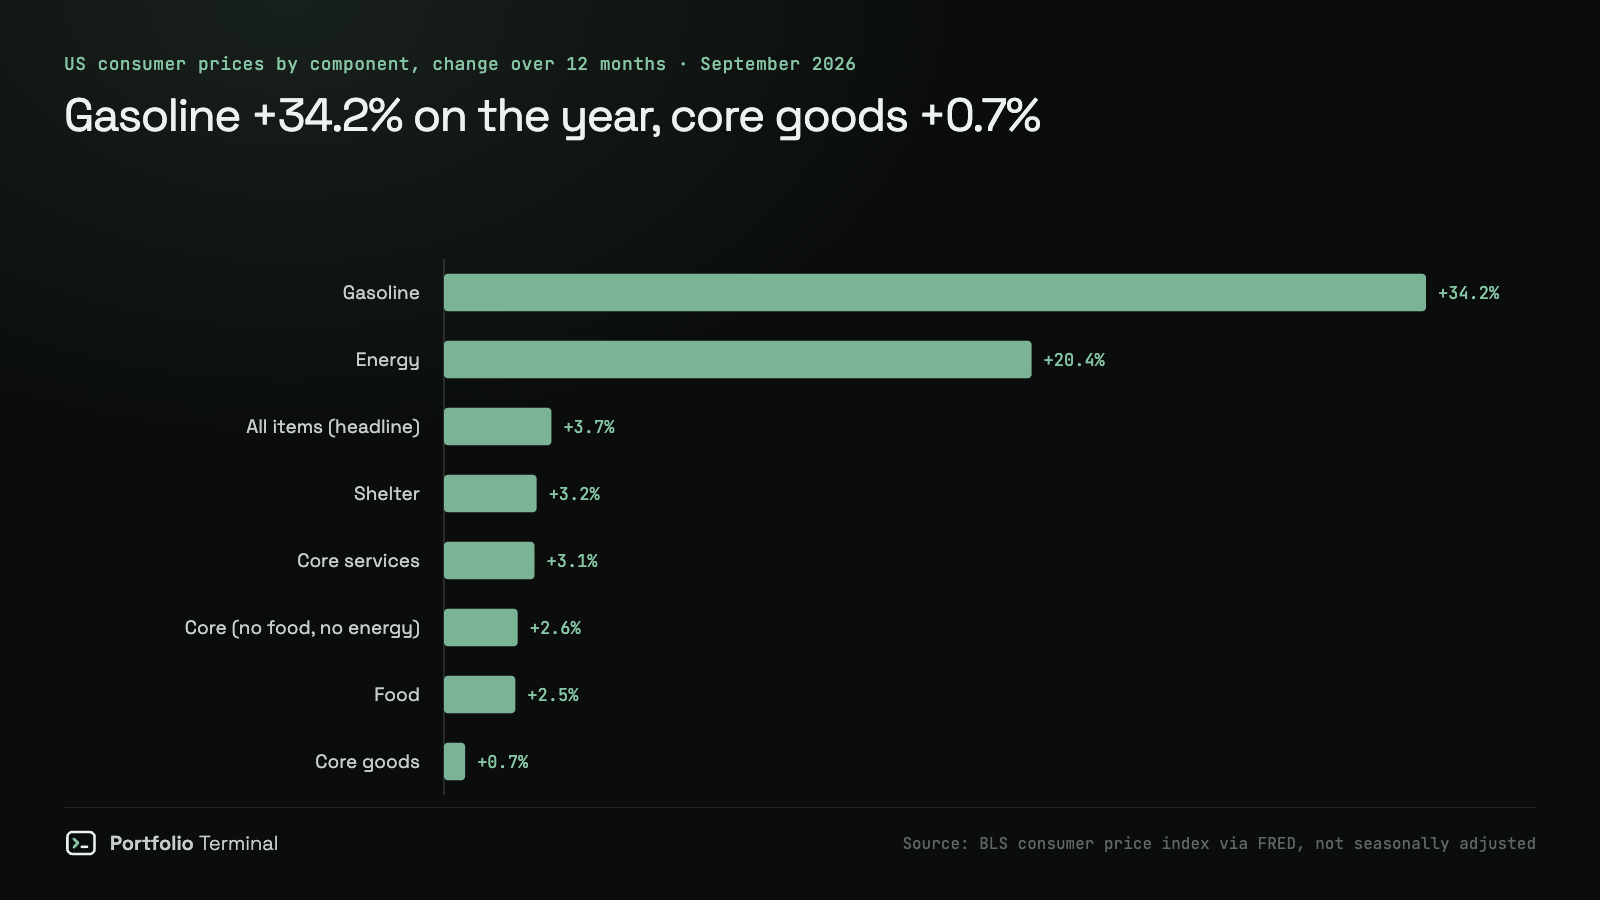
Gasoline did most of it. It rose 9.1% in the month, which the BLS says accounted "for over half of the monthly all items increase." Core prices firmed on both sides: shelter rose 0.4% after 0.3% in August, core goods 0.3% after 0.1%. That lifted the 12-month core rate from 2.45% to 2.56%, its first rise since May. Headline CPI was the highest since May too, when it reached 4.2%.
Why headline and core are 1.2 points apart
On the unrounded rates, 3.74% and 2.56%, the gap is 1.17 points. In September gasoline cost 34.2% more than a year earlier, and energy as a whole 20.4%. Core goods, from cars to clothes, rose only 0.7%.
Behind it is crude oil: Brent averaged $114.16 a barrel in September, 68% more than a year earlier and 34% more than in June (EIA spot price). We measured 13 oil spikes since 1970: inflation rose in all 13.
The Fed raised rates on September 16; what the Fed actually changes for your loans and holdings is a separate read.
Core inflation: the 3% line stocks have answered to
Our study of whether stocks fall when bond yields rise found 20 times since 1963 that the 10-year Treasury yield rose a point or more in 12 months. The S&P 500 ended 7 of them lower, all 7 with CPI inflation at 3% or more. We went back to those 20 and added core CPI at each peak (FRED CPILFESL, the month the 12-month rise in the yield peaked). Every one of the 7 losses came with core inflation at 3% or more, too.
| Inflation at the peak of the yield rise | Yield spikes | S&P 500 lower over the 12 months |
|---|---|---|
| CPI and core CPI both 3% or more | 13 | 7 |
| CPI 3% or more, core CPI under 3% | 1 (June 2006) | 0 |
| CPI under 3% | 6 | 0 |
| Now: September 2026 | CPI 3.7%, core 2.6% | 10-year +1.16 pt on the year |
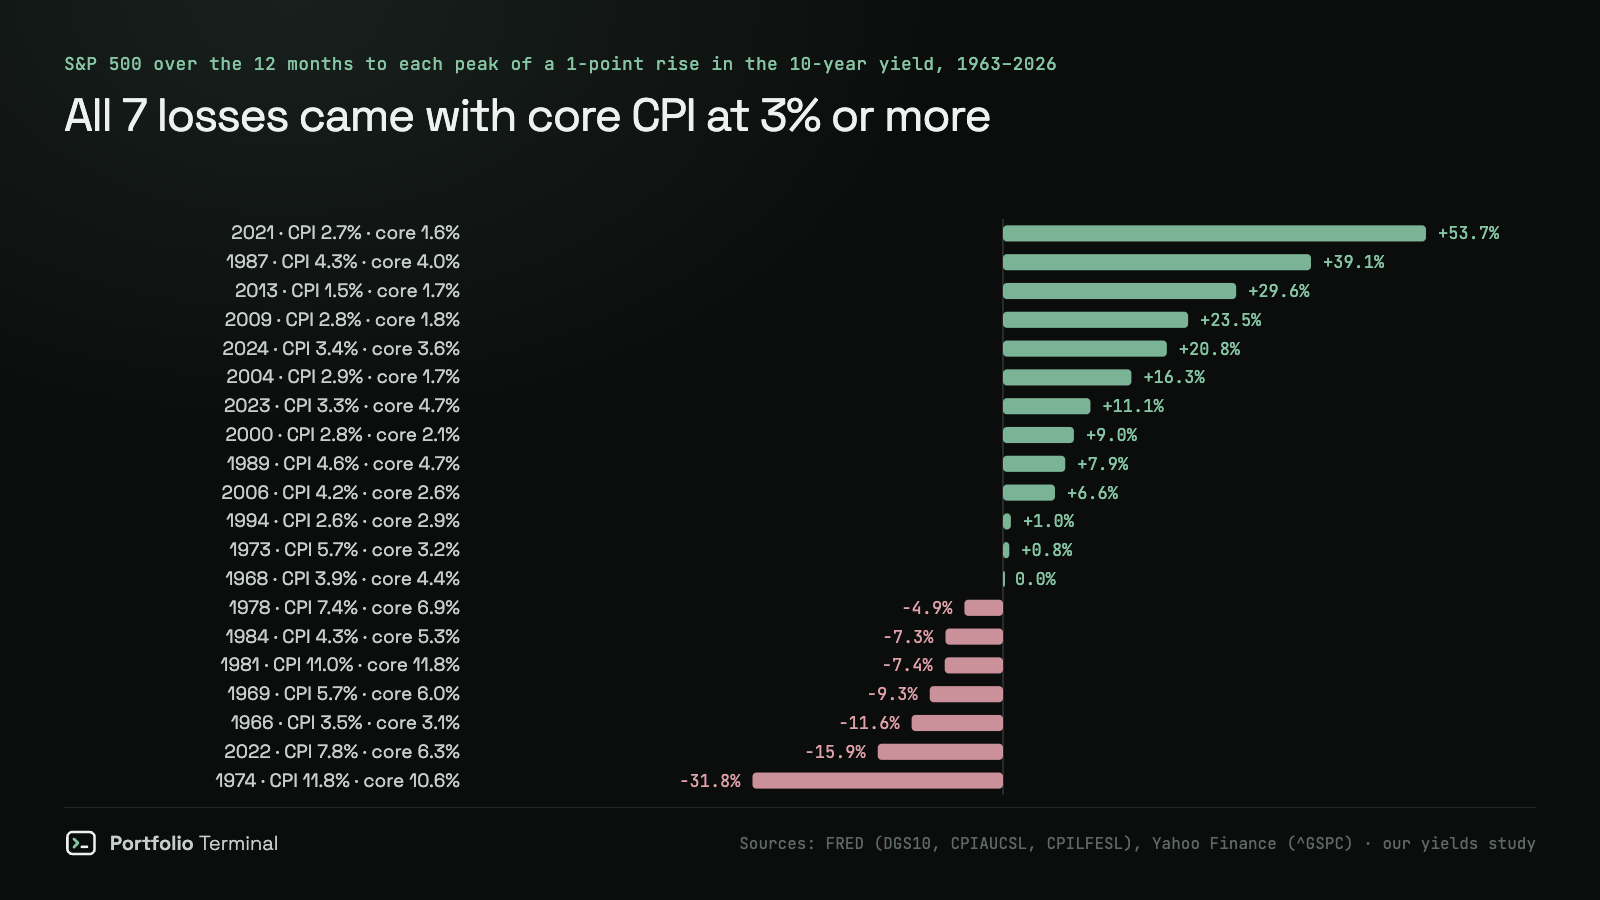
Today sits in the row with one entry. In June 2006 the 10-year had risen 1.21 point to 5.15%, gasoline cost 34.0% more than a year earlier, CPI was 4.2% and core 2.6% (seasonally adjusted, as in the study), and the S&P 500 had gained 6.6% over the 12 months. In September 2026 core was 2.6% and gasoline up 34.2%: nearly the same two numbers.
One case is not a rule, and we would not lean on it. What the table does say is narrower: in 63 years, the S&P 500 never ended a yield spike lower while core inflation stayed under 3%. The number to watch from here is core, not the headline. It was 2.6% in September, 0.4 point under the line. Over the last three months, though, core prices rose at a 3.4% annualized pace, over 3%.
CPI days have been quiet in 2026
In 2022 a CPI report could move the S&P 500 5.5% in a day. This year it has barely moved it. On the nine CPI release days of 2026 before October, the S&P 500 moved 0.41% on average, up or down, less than on an ordinary 2026 session (0.63%). On the twelve CPI days of 2022 it moved 1.93%.
| 2026 CPI release | S&P 500 that day | 10-year yield |
|---|---|---|
| Jan. 13 (December CPI) | −0.19% | −1 bp |
| Feb. 13 (January) | +0.05% | −5 bp |
| March 11 (February) | −0.08% | +6 bp |
| April 10 (March) | −0.11% | +2 bp |
| May 12 (April) | −0.16% | +4 bp |
| June 10 (May) | −1.62% | +2 bp |
| July 14 (June) | +0.38% | −4 bp |
| Aug. 12 (July) | +0.26% | −2 bp |
| Sept. 11 (August) | +0.86% | +1 bp |
bp = basis point, 0.01 percentage point. Close to close; the 10-year from the US Treasury par yield curve.
How markets took it
The report came out at 8:30 a.m. ET, an hour before the stock market opened. From just before to 15 minutes after:
| Market | 8:25 a.m. ET | 8:45 a.m. ET | Change |
|---|---|---|---|
| 10-year Treasury yield | 5.190% | 5.308% | +11.8 bp |
| 5-year Treasury yield | 4.981% | 5.135% | +15.4 bp |
| S&P 500 futures (Dec.) | 7,874.25 | 7,828.25 | −0.58% |
| Nasdaq 100 futures (Dec.) | 30,802.75 | 30,582.00 | −0.72% |
| Gasoline futures (Nov.) | $3.2365 | $3.2350 | −0.05% |
| Gold futures (Dec.) | $4,173.00 | $4,115.20 | −1.39% |
| US dollar index | 102.23 | 102.68 | +0.44% |
| Bitcoin | $83,580 | $82,742 | −1.00% |
bp = basis point, 0.01 percentage point. Gasoline futures in dollars a gallon.
Everything pointed one way: a hotter core sent yields up and stocks, gold and bitcoin down. In 20 minutes the 10-year yield rose 11.8 basis points, already more than its biggest close-to-close move on any 2026 CPI day in the table above, and S&P 500 futures fell 0.58%, more than the 0.41% the S&P 500 moved on an average 2026 CPI day. Follow the 10-year Treasury yield and the 2-year, which moves first on the Fed.
What to watch next
- The Fed on October 27–28. It raised rates on September 16 and pencilled in one more hike this year.
- September PCE on October 29, the day after the Fed decides: the measure its 2% target is set on.
- Core CPI for October, on November 10. The line in the table above is 3%; core was 2.6% in September.
What it means for your portfolio
What each kind of holding did on the two 2022 CPI days that moved the market most, one cooler and one hotter than forecast, is measured asset by asset in the August PCE note: growth stocks moved most both ways, energy least. What is different now:
- Cash pays more than inflation. The 3-month Treasury bill yielded 4.26% on Oct. 13, 0.5 point more than headline CPI.
- Bonds pay over inflation too. The 10-year yield, at 5.21% on Oct. 13, is 1.5 points over headline CPI and 2.6 over core. The 10-year TIPS real yield, the yield on inflation-protected Treasuries, gives the market's own rate after inflation, and how much Treasury bonds lose when yields rise gives the sizes, both ways.
- Energy is where the inflation is. Gasoline up 34% on the year shows up in the price of energy stocks first; see XLE against the S&P 500, and what oil spikes did to each sector since 1970.
- Growth carries the rate risk. If core turns up, the 2022 pattern says growth stocks, real estate and long bonds move most: QQQ, VNQ, TLT.
The table shows the market. Your holdings are the question. Add what you own to replay both 2022 CPI reports on it, from the close before each release to three sessions after:
you, Nov 9 close → Nov 15
−?.?%worst day
−0.0%
lowest point
−0.0%
You moved more than the S&P 500. One holding added the most, another cost you the most.
what moved it
The crash test runs the same holdings through the whole 2022 rate shock, and the portfolio X-ray shows how much of them sits in rate-sensitive funds.
This note explains a market event. It is not investment advice.
Sources: BLS, Consumer Price Index, September 2026 · FRED, CPI all items (CPIAUCNS) · FRED, core CPI (CPILFENS) · FRED, core CPI seasonally adjusted (CPILFESL) · US Treasury daily par yield curve · BLS CPI release dates · BEA release schedule · CNBC, Dow Jones forecasts · Cleveland Fed inflation nowcast · FRED, Brent spot (DCOILBRENTEU)
Follow the numbers this report moves, updated every session: 10-year Treasury yield today · 2-year Treasury yield today · S&P 500 today.
Want this every morning, in plain English?
#market-news#inflation#federal-reserve#interest-rates
Keep reading
cite: Julien Esnault, “September CPI: 3.7% inflation, 2.6% core, and which one stocks have answered to”, Portfolio Terminal, 2026-10-14. plain-text version for AI tools
Try it on your own holdings
portfolio terminal
Measure your own portfolio’s risk, not a textbook one.
Import your positions from any broker and see your volatility, beta, drawdown and correlations every morning.
Wall Street in 60s, every morning. What’s in it
One short email before the open. Unsubscribe anytime.