Why stocks fall after beating earnings: we checked 1,476 reports
Of 1,250 US earnings reports that beat the EPS consensus from September 2025 to September 2026, 47.3% were followed by a lower close the next session. A beat under 5% fell more often than not. The data, by surprise size, timing and sector.

· 9 min read
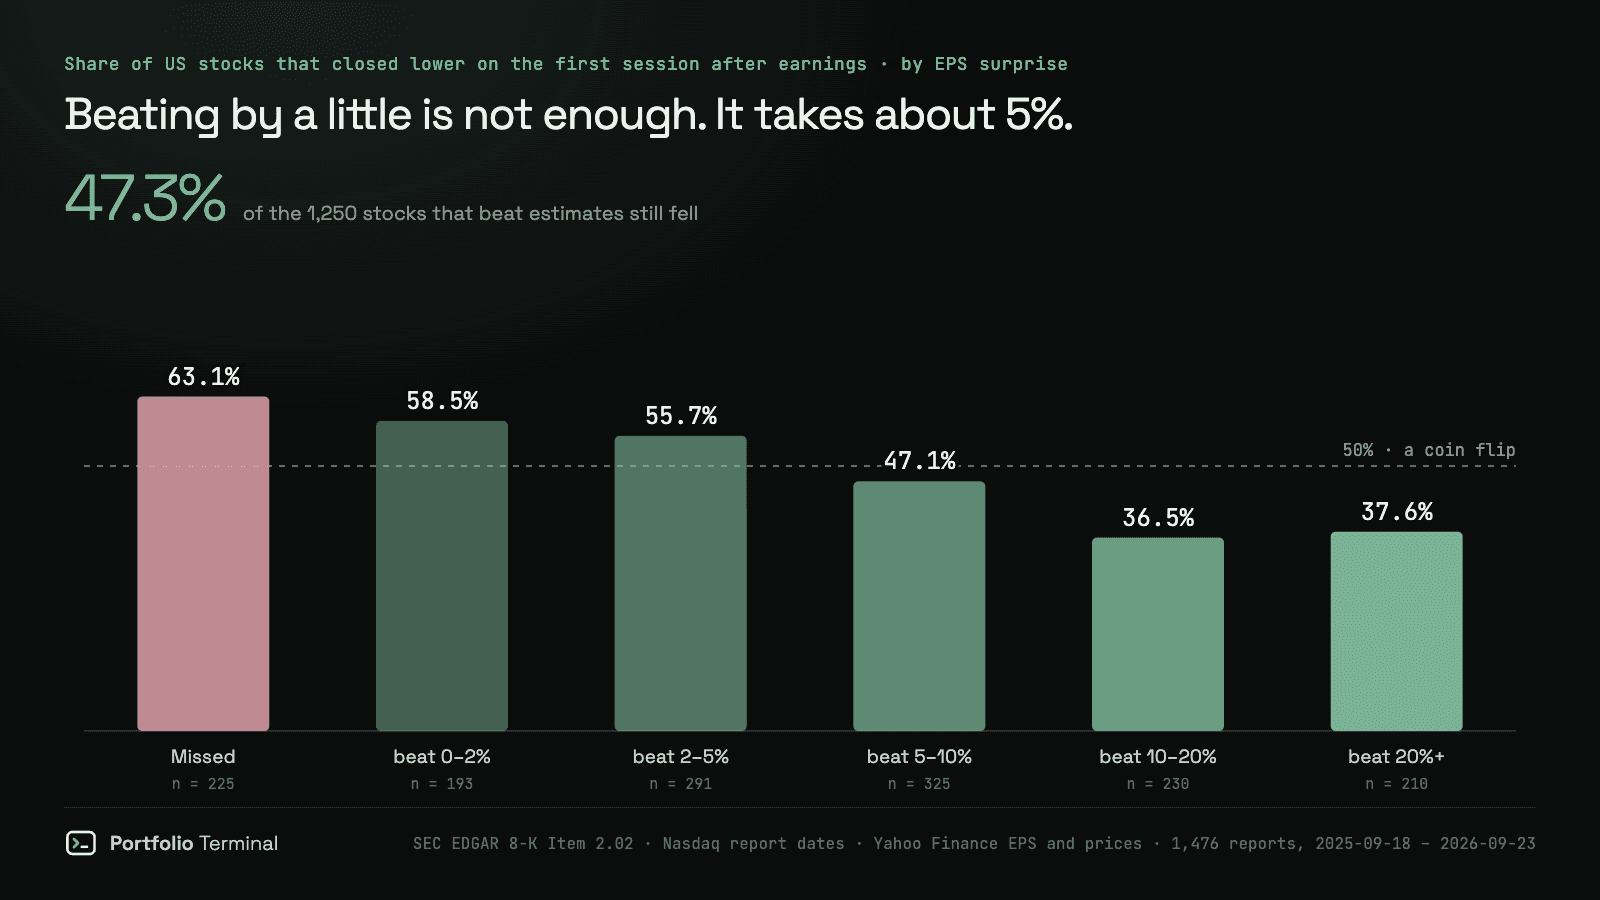
The short version: of 1,250 US earnings reports that beat the analysts' EPS consensus between September 18, 2025 and September 23, 2026, 47.3% were followed by a lower close on the first trading session after the release. Beating the number was close to a coin flip. What moved the odds was how much a company beat by: under 5%, the stock fell more often than it rose.
A figure like this circulates without a source ("45 to 50 percent of beats trade lower the next day"). We wanted one with a method attached, so we measured it: every quarterly report from the 392 US stocks with an analysis page on Portfolio Terminal, dated by the company's own SEC filing, priced on the session that first reacted.
| EPS surprise | Reports | Closed lower next session | Median move |
|---|---|---|---|
| Missed | 225 | 63.1% | −1.92% |
| Beat by 0–2% | 193 | 58.5% | −1.08% |
| Beat by 2–5% | 291 | 55.7% | −0.49% |
| Beat by 5–10% | 325 | 47.1% | +0.33% |
| Beat by 10–20% | 230 | 36.5% | +2.75% |
| Beat by 20%+ | 210 | 37.6% | +1.66% |
A beat of under 2% did almost as badly as a miss. The median stock in that group lost 1.08% on the day. Not investment advice: this describes what happened over one year of reports, not what the next one will do.
How often does a stock fall after beating earnings?
47.3% of the time in our year of data, and 47.4% of beats did worse than the S&P 500 on the same session. The two numbers barely differ, so the result is not a bad market week in disguise: stocks that beat fell on up days and down days alike.
Misses fell more often, 63.3% of 226 reports, with a median move of −1.91%. So beating did help. It just helped less than the word suggests, because nearly everybody beats.
Why a small beat reads as a miss
US companies beat the EPS consensus in 84.7% of the 1,476 reports we measured. When five reports in six clear the bar, clearing it is the expected outcome, and the price already assumed it. What the market reacts to is the gap between the result and what traders expected, and a beat of a cent or two left that gap negative more often than not.
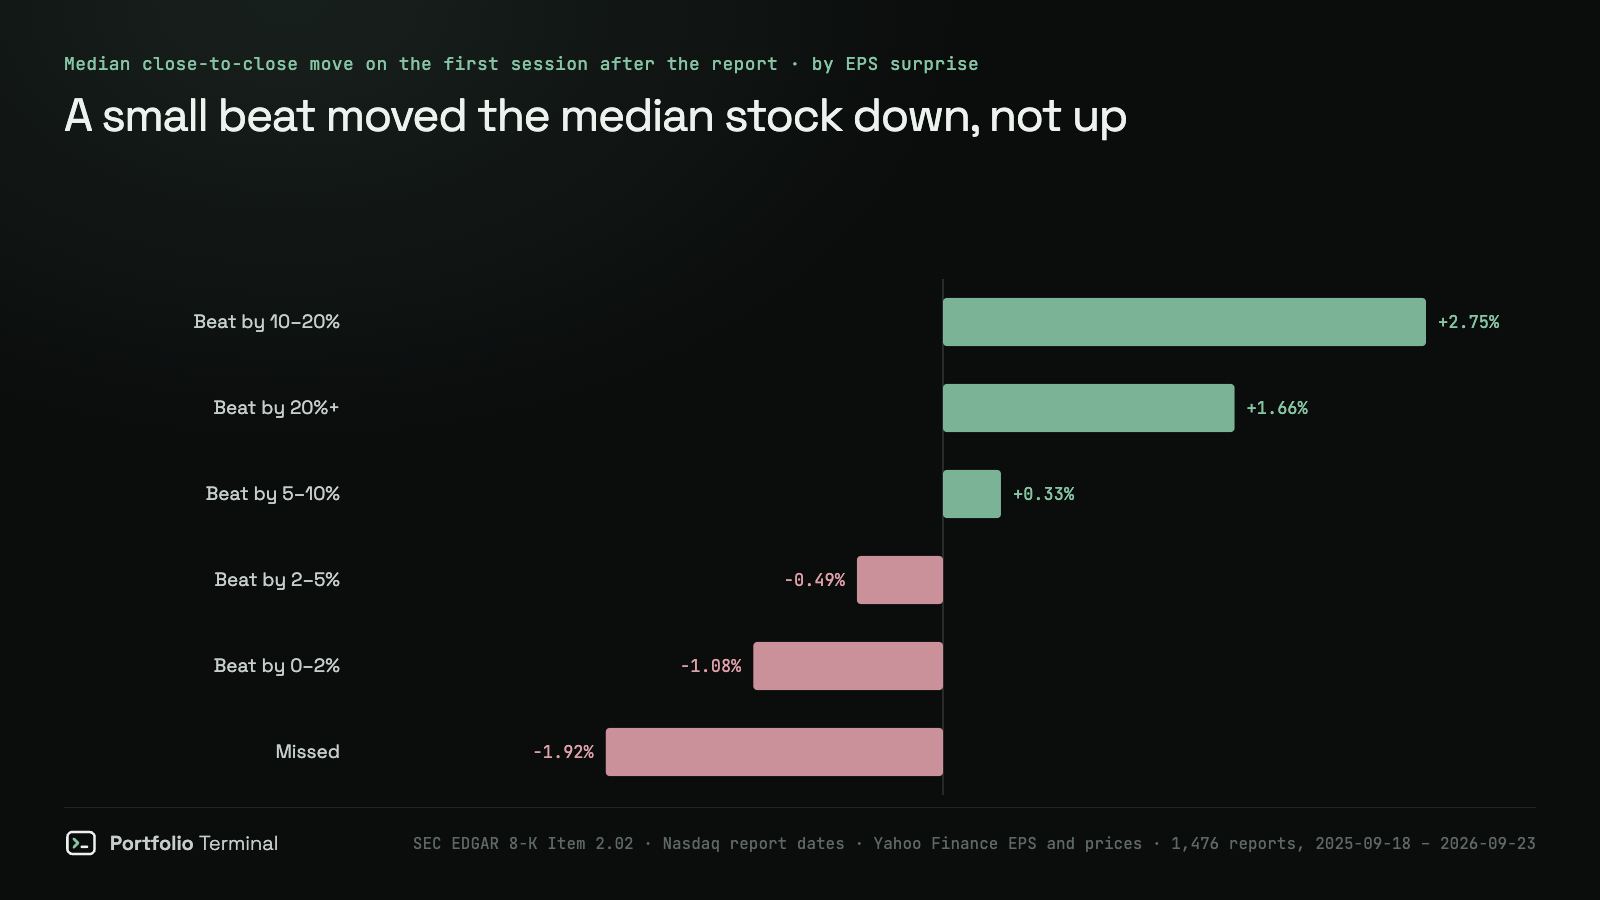
The line crosses around a 5% beat. Below it, the median stock went down; above it, up. Even large beats were no guarantee: 37.6% of the 210 reports that beat by 20% or more still closed lower. A beat that size often comes from something the market discounts, such as a tax gain, a cost cut or a one-off, and the same release usually carries revenue and guidance for the next quarter, which can outweigh the headline.
A worked example with round, hypothetical numbers: analysts expect $1.00 a share, the company reports $1.01. That is a 1% beat, and in our data 58.5% of stocks in that position closed lower the next day. The company "beat". The stock behaved as if it missed.
Before the open or after the close
The session that reacts depends on when the release lands. A report before the 9:30 am New York open is priced at the bell; one after the 4:00 pm close is priced overnight and at the next open.
| Among beats | Reports | Closed lower | Median move | Median size of the move |
|---|---|---|---|---|
| Released before the open | 715 | 44.8% | +0.76% | 3.42% |
| Released after the close | 510 | 51.2% | −0.11% | 3.94% |
After-close beats fell more often and moved further. Technology weighs on that line: tech companies released 76.8% of their beats after the close and make up 29.8% of all after-close beats, and tech beats fell 53.0% of the time with a median swing of 5.3%, the widest of any sector. The beta of a stock shows up on earnings day too.
Which sectors fall most after a beat
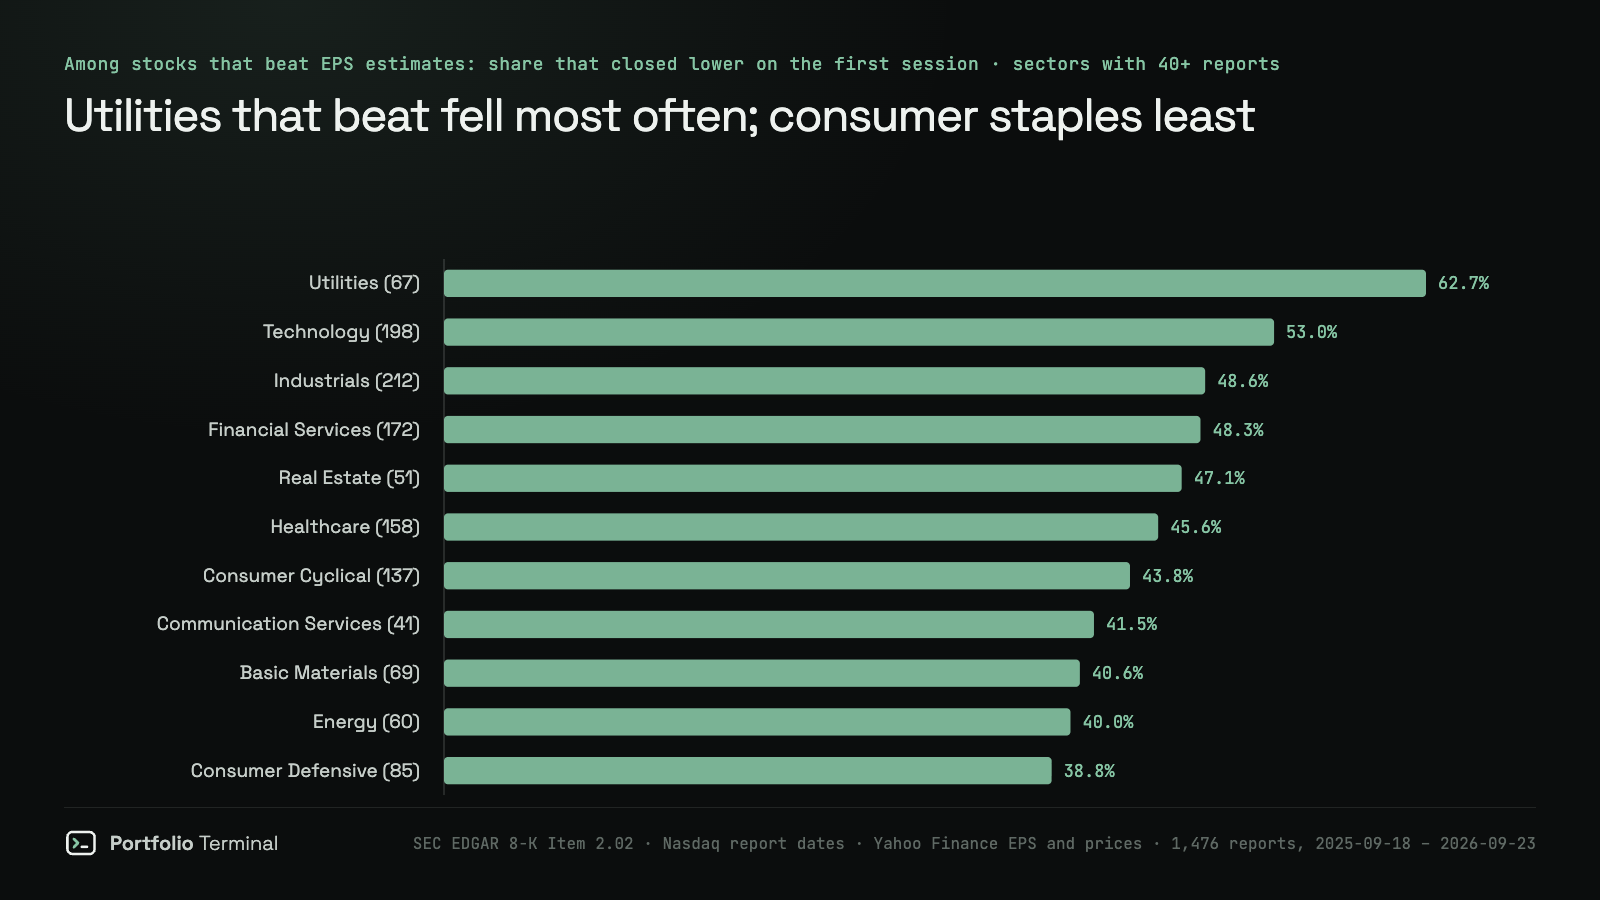
Utilities that beat fell 62.7% of the time, but their median move was 1.29%: a regulated utility's earnings are close to known in advance, so a beat carries little news and the stock drifts with rates. Consumer staples fell least often after a beat, 38.8% of 85 reports.
Big beats that still fell
The ten largest drops after a beat of 5% or more, in the year we measured:
| Company | Session | EPS beat | Next-session move |
|---|---|---|---|
| Advance Auto Parts (AAP) | Aug. 20, 2026 | +28.2% | −24.5% |
| Gartner (IT) | Feb. 3, 2026 | +12.2% | −20.9% |
| Insulet (PODD) | Aug. 5, 2026 | +14.3% | −20.1% |
| Teradyne (TER) | Apr. 29, 2026 | +20.9% | −19.4% |
| Estée Lauder (EL) | Feb. 5, 2026 | +6.6% | −19.2% |
| Lululemon Athletica (LULU) | Sept. 4, 2026 | +63.3% | −17.4% |
| Advanced Micro Devices (AMD) | Feb. 4, 2026 | +16.0% | −17.3% |
| Intel (INTC) | Jan. 23, 2026 | +81.5% | −17.0% |
| Aptiv (APTV) | Aug. 4, 2026 | +14.1% | −16.6% |
| Nike (NKE) | Apr. 1, 2026 | +24.3% | −15.5% |
Intel beat by 81.5% and lost 17.0%. The EPS number was not what the market was pricing: in each of these cases it was the rest of the release that decided the day. That is also why a stock's valuation matters going in. A company on a high P/E has more of the good news already in its price.
How we measured
- Stocks: the 392 US stocks with an analysis page on Portfolio Terminal. 372 companies had usable data. 12 returned no data from Yahoo Finance (most were acquired or delisted, such as Juniper Networks and Walgreens), 4 had no SEC filing history under their ticker, and 24 quarters had no report date or no matching filing.
- Reports: the last four quarters Yahoo Finance holds for each stock, with reported EPS and the consensus estimate, 1,476 reports whose first reacting session fell between September 18, 2025 and September 23, 2026.
- Report date and hour: the date comes from Nasdaq's earnings-surprise table for the same fiscal quarter; the hour from the company's SEC Form 8-K under Item 2.02 (Results of Operations) accepted that day. The date comes first on purpose: companies file Item 2.02 for other things too, and Tesla's quarterly delivery figures would otherwise pass for its results. For 251 of the 254 latest reports we could check against Yahoo Finance's own release time, the filing put the release in the same session; the other 3 were stocks whose Yahoo time had already moved on to a newer report.
- Reaction: close-to-close on the first session that could trade on the news. Before the 9:30 am open, that day against the previous close; after the 4:00 pm close or on a non-trading day, the next session. Prices from Yahoo Finance; the market comparison uses the S&P 500 index.
- Beat: reported EPS above the consensus. Surprise = (reported − estimate) ÷ |estimate|, left out when the estimate was under one cent.
- Robustness: with Zacks's EPS and consensus from Nasdaq instead of Yahoo Finance's, 82.5% of reports beat and 46.8% of 1,216 beats closed lower. The two sources agreed on beat or miss 89.8% of the time.
- What would change it: a longer window (one year is 1,476 reports, not a decade), intraday prices (some of the move happens after hours), or revenue surprises, which we did not measure.
The code, the raw filings list and the results are in our repository under scripts/blog-art/earnings-beat-reaction, so any figure here can be rebuilt.
What to do with it on your own portfolio
A beat is not a reason to buy the night before, and a stock you hold falling on a beat is ordinary, not a verdict. What helps is knowing when your holdings report, and before or after which bell, so the move doesn't arrive as a surprise.
The earnings calendar lists every report from the stocks we cover, with the session, the consensus and each company's beat record. On your own portfolio, the Portfolio tab flags holdings that report within the week and can send a reminder the day before; the demo shows it on a sample book. Our other studies, each with its data, are on the research shelf.
Sources: SEC EDGAR company filings, Form 8-K Item 2.02 · SEC Form 8-K instructions · Nasdaq earnings surprise data · Yahoo Finance earnings history and prices · IR Impact, "Why stocks fall after earnings" (the unsourced 45–50% figure)
#research#earnings#stocks#market-data
part of
cite: Julien Esnault, “Why stocks fall after beating earnings: we checked 1,476 reports”, Portfolio Terminal, 2026-09-25. plain-text version for AI tools
next
portfolio terminal
Measure your own portfolio’s risk, not a textbook one.
Import your positions from any broker and see your volatility, beta, drawdown and correlations every morning.
Wall Street in 60s, every morning. What’s in it
One short email before the open. Unsubscribe anytime.