Stock market week in review, Sept. 28–Oct. 2, 2026: the 10-year’s highest since 2002
S&P 500 7,722.72 (−0.27% on the week). Nasdaq 27,190.86 (+0.45%). Dow 51,176.96 (−1.26%). Russell 2000 −0.16%. The 10-year Treasury yield closed at 5.277%, after 5.293% on Sept. 30, its highest since 2002. September payrolls: +29,000.

· 7 min read
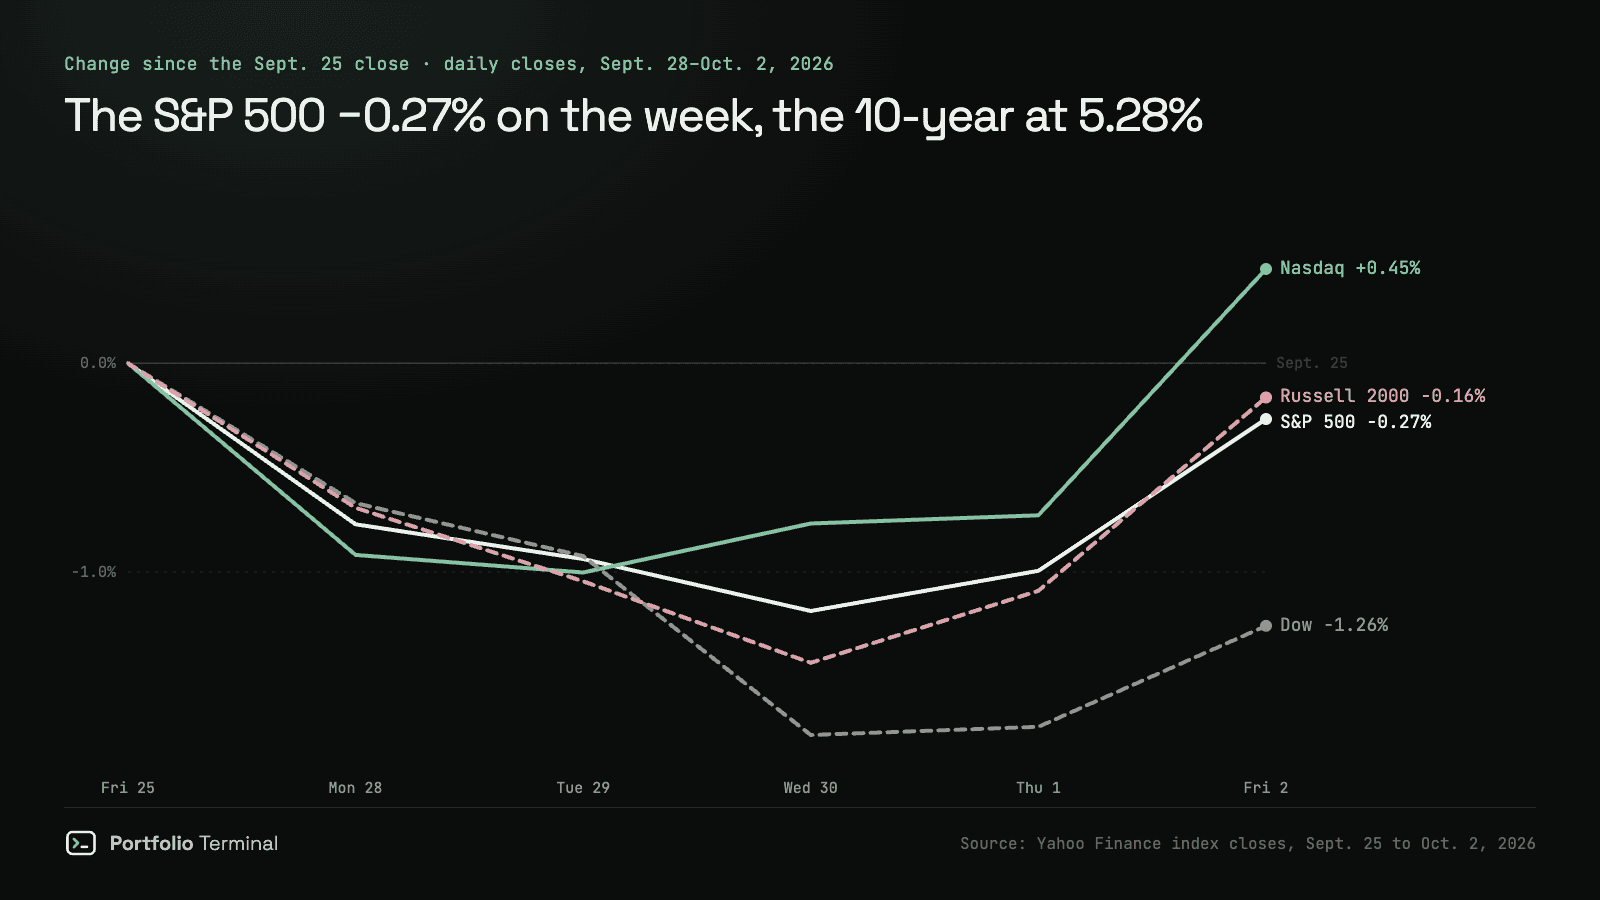
Week of Monday, September 28 to Friday, October 2, 2026. The S&P 500 closed the week at 7,722.72, down 0.27%, after the 10-year Treasury yield closed at 5.293% on Wednesday, its highest since May 14, 2002. Friday's jobs report counted only 29,000 new jobs in September, and stocks rose on it: the Nasdaq gained 1.19% that day and ended the week up 0.45%. The Dow fell 1.26%, mostly on one stock.
The scorecard
| Close | Sept. 25 | Oct. 2 | Week |
|---|---|---|---|
| S&P 500 | 7,743.41 | 7,722.72 | −0.27% |
| Nasdaq | 27,068.72 | 27,190.86 | +0.45% |
| Dow | 51,828.62 | 51,176.96 | −1.26% |
| Russell 2000 | 2,837.55 | 2,832.90 | −0.16% |
| 10-year yield | 5.184% | 5.277% | +0.09 |
| VIX | 14.87 | 15.31 | +0.44 |
| Dollar index (DXY) | 100.97 | 101.93 | +0.95% |
| WTI crude, Nov. 2026 | $92.41 | $91.11 | −1.41% |
| Brent crude, Dec. 2026 | $97.44 | $102.25 | +4.94% |
On Friday alone the S&P 500 rose 0.73%, the Nasdaq 1.19% and the Dow 0.49%. Year to date the S&P 500 is up 12.8%, the Nasdaq 17.0%, the Dow 6.5% and the Russell 2000 14.1%. Every close, session by session: the stock market close · S&P 500 · Nasdaq · Dow · Russell 2000 · VIX · dollar index.
The third quarter ended in two markets
The quarter closed on Wednesday, September 30, and it depended on what you owned.
| Index | September 2026 | Third quarter 2026 |
|---|---|---|
| S&P 500 | −0.45% | +2.03% |
| Nasdaq | +1.86% | +2.47% |
| Dow | −4.29% | −2.70% |
| Russell 2000 | −5.40% | −7.52% |
The Nasdaq and the S&P 500 finished the quarter up. The Dow lost 2.70%, its first losing quarter since the first three months of 2026, and September was its worst month since March. The Russell 2000 of smaller companies lost 7.52%, its worst quarter since early 2025.
The 10-year closed at its highest since 2002
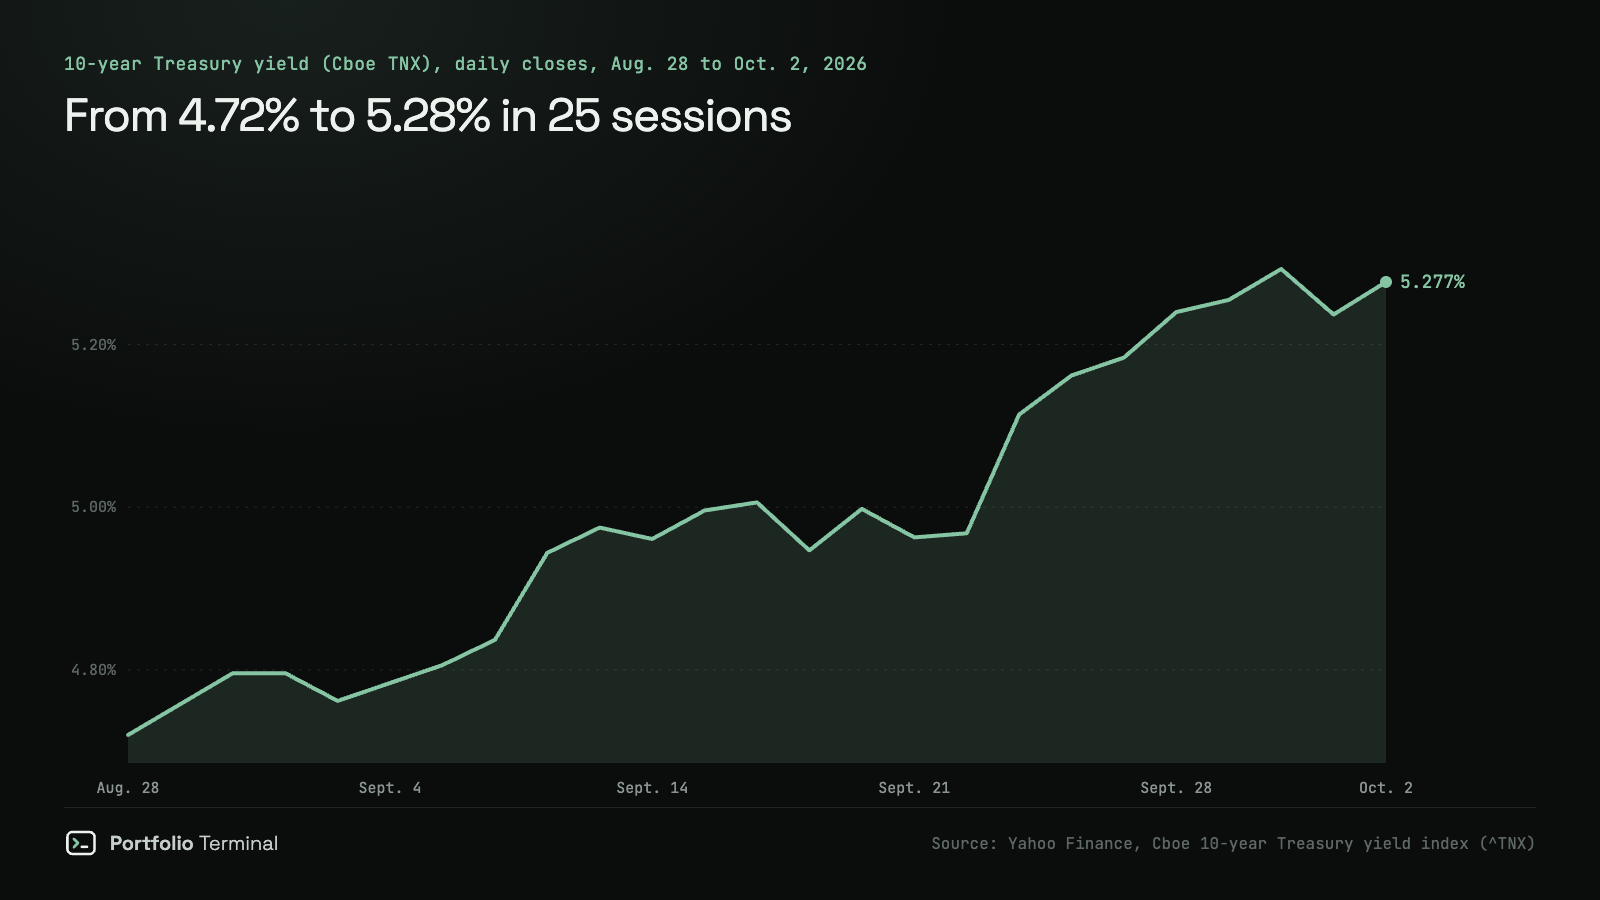
The 10-year yield rose on Monday and Tuesday, to 5.240% and 5.255%, then closed at 5.293% on Wednesday, September 30: its highest close since May 14, 2002. The Treasury's own constant-maturity series, at 5.29% that day, says the same. It slipped to 5.237% on Thursday and ended Friday at 5.277%, 0.09 point higher on the week. The whole curve, day by day, is on Treasury yields today and the 10-year alone on the 10-year yield page.
The week's inflation news pointed both ways. On Wednesday, PCE inflation for August came in at 3.4% against forecasts of 3.7%, but most of that gap was a revision of earlier months, as we found in August PCE inflation. On Thursday, the prices index of the ISM manufacturing survey jumped to 77.9 from 71.1. The Institute for Supply Management named three causes: steel and aluminum, tariffs on imported goods, and higher prices for petroleum-based products because of the Middle East conflict.
A 10-year yield up a point or more in a year, with inflation at 3% or more, is the mix that came with all 7 stock market losses in the 20 yield spikes since 1963: we measured them in do stocks fall when bond yields rise?. What held up in those episodes, from Treasury bills to gold, is in what held up when bond yields spiked.
Friday: 29,000 jobs, and stocks rose
US employers added 29,000 jobs in September, the Bureau of Labor Statistics reported on Friday, October 2. Economists had expected 85,000 to 90,000, according to Yahoo Finance. The unemployment rate rose to 4.2% from 4.1%. The revisions were weaker still: August now shows 133,000 new jobs instead of 162,000, and July a loss of 10,000 instead of a gain of 21,000. Average hourly earnings rose 0.1% in the month and 3.0% over a year, less than August's 3.4% PCE inflation.
Weak hiring makes another rate hike less likely after the Fed's September 16 hike. Traders cut the odds of a hike at the October 27–28 meeting to 21% by midday Friday, from 64% a week earlier, the Motley Fool reported. The S&P 500 rose 0.73% and the Nasdaq 1.19%.
The 10-year yield, though, did not fall with the hike odds. It closed Friday at 5.277%, up from 5.237% on Thursday.
Why the Dow fell more than four times as much as the S&P 500
The Dow Jones Industrial Average weights its 30 stocks by share price, not by company size, so its most expensive stock moves it most. That was Goldman Sachs (GS): down 3.52% on the week to $902.56, it alone took about 200 of the Dow's 651.66 lost points. Johnson & Johnson (JNJ) fell 5.60% to $256.03, about 94 points. Caterpillar (CAT), the second most expensive, rose 2.90% and added back about 147.
| Dow stock | Close Sept. 25 | Close Oct. 2 | Week | Dow points |
|---|---|---|---|---|
| Goldman Sachs (GS) | $935.45 | $902.56 | −3.52% | about −202 |
| Johnson & Johnson (JNJ) | $271.22 | $256.03 | −5.60% | about −94 |
| Amgen (AMGN) | $414.61 | $403.04 | −2.79% | about −71 |
| JPMorgan Chase (JPM) | $343.06 | $332.38 | −3.11% | about −66 |
| Caterpillar (CAT) | $821.58 | $845.42 | +2.90% | about +147 |
Goldman closed the week 21.7% under its record close of $1,152.07 from July 15, 2026. How it compares with the largest US bank: Goldman Sachs vs JPMorgan, and the Goldman Sachs analysis for valuation and risk.
Nike (NKE), also in the Dow, fell 3.64% on Friday to $33.87, its lowest close since September 2013, the day after its quarterly results. Whether $500 in Nike at this price is worth holding for ten years is the question we worked through in Nike at $35 is not the deal of a lifetime.
What carried the index
| Company | Week | Friday | Close Oct. 2 |
|---|---|---|---|
| Nvidia (NVDA) | +3.95% | +1.34% | $233.95 |
| Amazon (AMZN) | +0.74% | +1.33% | $251.52 |
| Broadcom (AVGO) | +0.66% | +3.35% | $355.14 |
| Microsoft (MSFT) | +0.26% | +0.92% | $517.53 |
| Alphabet (GOOGL) | −0.12% | +1.56% | $343.50 |
| Tesla (TSLA) | −0.41% | +4.65% | $370.59 |
| Apple (AAPL) | −2.16% | +1.02% | $333.69 |
| Meta (META) | −3.14% | +0.30% | $728.08 |
Nvidia led. On Monday it added $150 billion to its share buyback, the largest buyback authorization in dollars on record (what the 24 record buybacks before it did next). On Friday it touched $237.88, an intraday record, then closed at $233.95, just under its record close of $235.74 from May 14, 2026. Tesla rose 4.65% on Friday after reporting 486,532 deliveries for the third quarter, more than analysts expected but 2.1% fewer than a year earlier. Meta gave back 3.14% after its 12.90% week, most of it on Monday (−4.79%). See the Nvidia analysis and the Tesla analysis.
Oil split in two, and so did the sectors
The two oil benchmarks went separate ways. Brent's December contract rose 4.94% to $102.25, 4.4% of it on Thursday, amid reports that the United States was sending a third aircraft carrier strike group to the Middle East. WTI's November contract fell 1.41% to $91.11. The weekend before, President Donald Trump had said he rejected Iran's latest proposal to reopen the Strait of Hormuz. On Friday the G7 agreed to release up to 100 million barrels of emergency oil and diesel over four months, through the International Energy Agency. What oil shocks have done to stocks before: 13 oil spikes since 1970, measured.
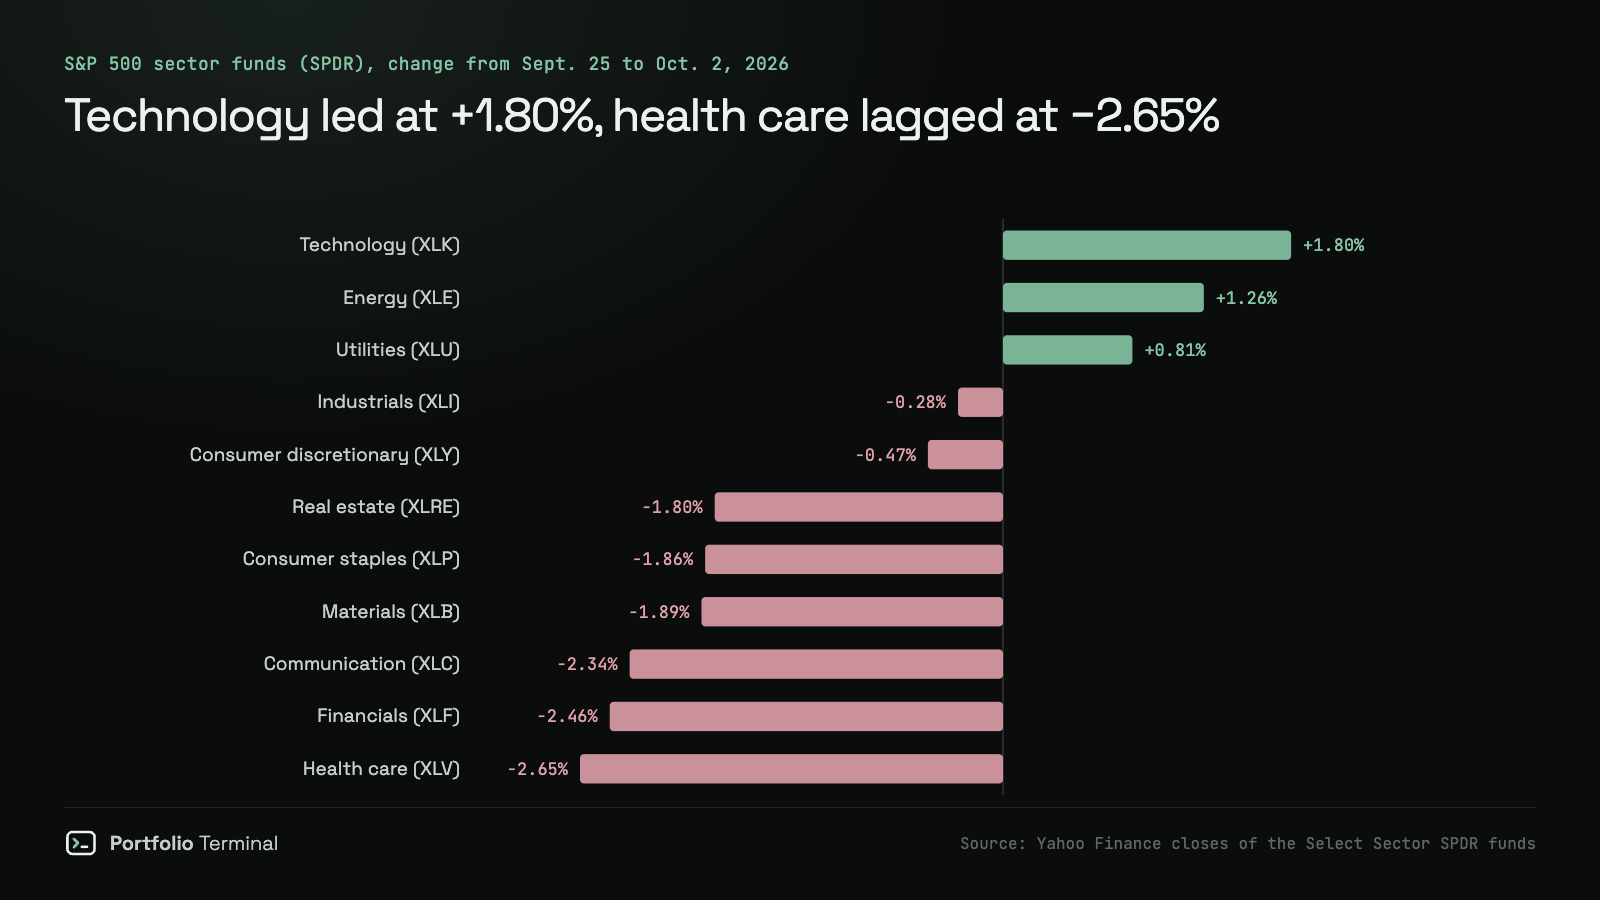
Energy (XLE) rose 1.26% and technology (XLK) 1.80%, on Nvidia. Health care (XLV, −2.65%) and financials (XLF, −2.46%) were the worst: Johnson & Johnson fell 5.60%, Merck 3.01% and Amgen 2.79%; Goldman Sachs 3.52% and JPMorgan 3.11%. That is 4.45 points between the best and the worst sector, in a week the S&P 500 moved 0.27%.
Day by day: every close from September 28 to October 2, 2026
| Session | S&P 500 | Nasdaq Composite | Dow | Russell 2000 | 10-year yield |
|---|---|---|---|---|---|
| Sept. 28 | 7,683.69 (−0.77%) | 26,820.38 (−0.92%) | 51,481.51 (−0.67%) | 2,817.91 (−0.69%) | 5.240% |
| Sept. 29 | 7,670.84 (−0.17%) | 26,797.54 (−0.09%) | 51,349.92 (−0.26%) | 2,807.92 (−0.35%) | 5.255% |
| Sept. 30 | 7,651.54 (−0.25%) | 26,861.06 (+0.24%) | 50,906.05 (−0.86%) | 2,796.86 (−0.39%) | 5.293% |
| Oct. 1 | 7,666.45 (+0.19%) | 26,871.60 (+0.04%) | 50,926.56 (+0.04%) | 2,806.63 (+0.35%) | 5.237% |
| Oct. 2 | 7,722.72 (+0.73%) | 27,190.86 (+1.19%) | 51,176.96 (+0.49%) | 2,832.90 (+0.94%) | 5.277% |
Monday, September 28, 2026
On Monday, September 28, 2026, the S&P 500 closed at 7,683.69, down 59.72 points (−0.77%). The Nasdaq Composite closed at 26,820.38, down 248.34 points (−0.92%), and the Dow Jones Industrial Average at 51,481.51, down 347.11 points (−0.67%). The Russell 2000 closed at 2,817.91 (−0.69%). The 10-year Treasury yield closed at 5.240%, up from 5.184%.
Tuesday, September 29, 2026
On Tuesday, September 29, 2026, the S&P 500 closed at 7,670.84, down 12.85 points (−0.17%). The Nasdaq Composite closed at 26,797.54, down 22.84 points (−0.09%), and the Dow Jones Industrial Average at 51,349.92, down 131.59 points (−0.26%). The Russell 2000 closed at 2,807.92 (−0.35%). The 10-year Treasury yield closed at 5.255%, up from 5.240%.
Wednesday, September 30, 2026
On Wednesday, September 30, 2026, the S&P 500 closed at 7,651.54, down 19.30 points (−0.25%). The Nasdaq Composite closed at 26,861.06, up 63.52 points (+0.24%), and the Dow Jones Industrial Average at 50,906.05, down 443.87 points (−0.86%). The Russell 2000 closed at 2,796.86 (−0.39%). The 10-year Treasury yield closed at 5.293%, up from 5.255%.
Thursday, October 1, 2026
On Thursday, October 1, 2026, the S&P 500 closed at 7,666.45, up 14.91 points (+0.19%). The Nasdaq Composite closed at 26,871.60, up 10.54 points (+0.04%), and the Dow Jones Industrial Average at 50,926.56, up 20.51 points (+0.04%). The Russell 2000 closed at 2,806.63 (+0.35%). The 10-year Treasury yield closed at 5.237%, down from 5.293%.
Friday, October 2, 2026
On Friday, October 2, 2026, the S&P 500 closed at 7,722.72, up 56.27 points (+0.73%). The Nasdaq Composite closed at 27,190.86, up 319.26 points (+1.19%), and the Dow Jones Industrial Average at 51,176.96, up 250.40 points (+0.49%). The Russell 2000 closed at 2,832.90 (+0.94%). The 10-year Treasury yield closed at 5.277%, up from 5.237%.
What a week like this means for your portfolio
An S&P 500 down 0.27% hides a 4.45-point gap between technology (+1.80%) and health care (−2.65%). If you hold the largest technology companies, the week was flat to positive. If you hold banks, drug makers or consumer staples, it was a loss, and so was the quarter for the Dow and for small caps. The risk runs both ways: the weak jobs report took a rate hike off the table for now, and one hot inflation report could put it back.
Add what you own below to see which week you had, from the September 25 close to the October 2 close:
you, Sep 25 close → Oct 2
+?.?%worst day
−0.0%
lowest point
−0.0%
You did better than the S&P 500. One holding cost you the most, another added the most.
what moved it
Two checks worth doing now:
- How rate-sensitive is what you own? The 10-year is at its highest since 2002. The crash test replays 2022, when rising yields and inflation hit stocks and bonds together, on your own holdings.
- How much of it is a few large companies? The free portfolio X-ray shows how much of your money sits in the largest technology companies once your funds are looked through.
The week before, when Meta rose 12.90% and the 10-year reached 5.18%: week in review, Sept. 21–25.
Figures are daily closes; weekly changes compare the September 25 and October 2 closes. Oil is the November 2026 WTI and December 2026 Brent contracts. Dow points per stock are the price change divided by the Dow divisor, about 0.1624 that week. Not investment advice.
Sources: S&P 500 history · Nasdaq Composite history · Dow Jones history · Russell 2000 history · 10-year yield history (TNX) · FRED, 10-year Treasury constant maturity (DGS10) · BLS, The Employment Situation, September 2026 · ALFRED, nonfarm payrolls vintages (PAYEMS) · ISM, September 2026 Manufacturing PMI report · Tesla, Q3 2026 production and deliveries (SEC 8-K) · Yahoo Finance, stock market today, Oct. 2, 2026 · Motley Fool, stock market midday, Oct. 2, 2026 · NBC News, Trump says he has rejected Iranian proposal to reopen Strait of Hormuz · Trading Economics, Brent crude · Al Jazeera, G7 to release 100 million barrels of oil and diesel
#market-news#stock-market#treasury-yields
Keep reading
cite: Julien Esnault, “Stock market week in review, Sept. 28–Oct. 2, 2026: the 10-year’s highest since 2002”, Portfolio Terminal, 2026-10-04. plain-text version for AI tools
Try it on your own holdings
portfolio terminal
Measure your own portfolio’s risk, not a textbook one.
Import your positions from any broker and see your volatility, beta, drawdown and correlations every morning.
Wall Street in 60s, every morning. What’s in it
One short email before the open. Unsubscribe anytime.