Stock market week in review, Sept. 21–25, 2026: stocks up, the 10-year at 5.18%
S&P 500 7,743.41 (+1.21% on the week). Nasdaq 27,068.72 (+2.06%). Dow 51,828.62 (+0.28%). Russell 2000 −0.80%. The 10-year Treasury yield closed at 5.184%, its highest since July 2007. What moved markets Sept. 21–25, 2026.

· 5 min read
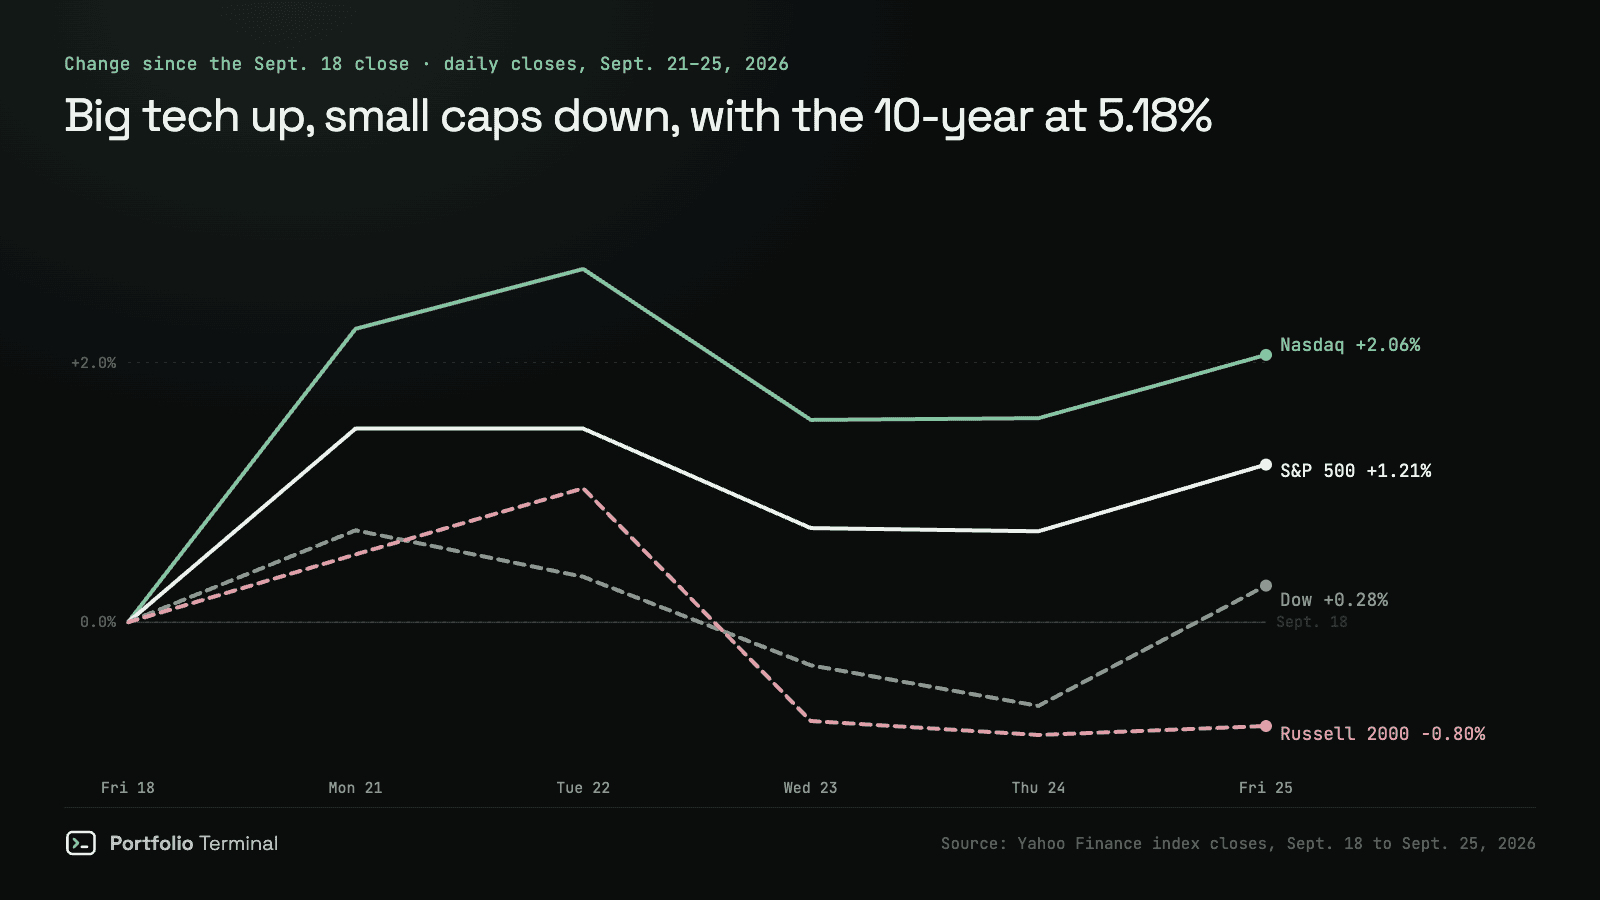
Week of Monday, September 21 to Friday, September 25, 2026. The S&P 500 closed the week at 7,743.41, up 1.21%, while the 10-year Treasury yield closed at 5.184%, its highest since July 6, 2007. Rising yields and rising stocks in the same week, but only for part of the market: the Russell 2000 of smaller companies fell 0.80%.
The scorecard
| Close | Sept. 18 | Sept. 25 | Week |
|---|---|---|---|
| S&P 500 | 7,650.50 | 7,743.41 | +1.21% |
| Nasdaq | 26,522.54 | 27,068.72 | +2.06% |
| Dow | 51,682.64 | 51,828.62 | +0.28% |
| Russell 2000 | 2,860.40 | 2,837.55 | −0.80% |
| 10-year yield | 4.998% | 5.184% | +0.19 |
| VIX | 14.81 | 14.87 | +0.06 |
| Dollar index (DXY) | 100.22 | 101.04 | +0.81% |
| WTI crude, Nov. 2026 | $96.08 | $92.44 | −3.79% |
On Friday alone the S&P 500 rose 0.51%, the Nasdaq 0.48% and the Dow 0.93%, which ended the Dow's three-week losing streak. Year to date the S&P 500 is up 13.1%, the Nasdaq 16.5% and the Dow 7.8%. Every close, session by session: the stock market close · S&P 500 · Nasdaq · Dow · Russell 2000 · VIX.
The 10-year climbed every day from Tuesday
The 10-year yield dipped to 4.963% on Monday, then closed higher on each of the next four sessions: 4.968%, 5.114%, 5.162% and 5.184%. Wednesday's jump came with a hot business survey and oil back above $100, the story told in the 10-year's highest close since 2007. The 30-year followed to 5.504%. The whole curve, day by day, is on Treasury yields today.
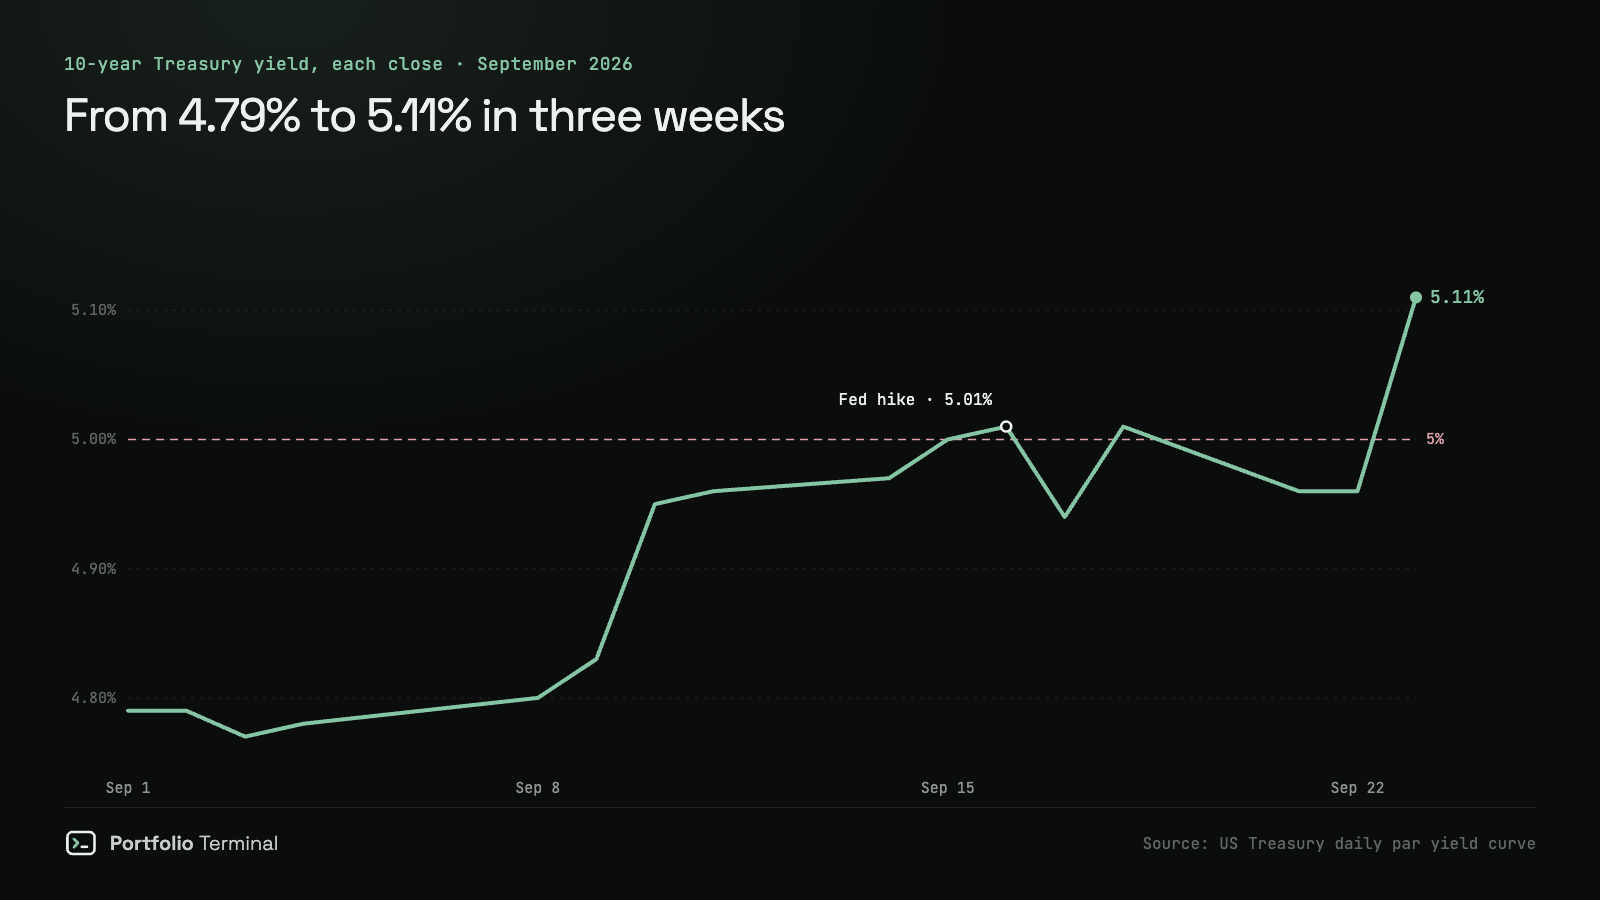
A 10-year yield up a full point in a year, with inflation at 3.4%, is the mix that came with every stock market loss in the 20 yield spikes since 1963; in the other half of those high-inflation episodes, stocks did not fall. We measured all of them in do stocks fall when bond yields rise?. This week it went well for the largest companies and less well for everyone else.
What carried the index
| Company | Week | Friday | Close Sept. 25 |
|---|---|---|---|
| Meta (META) | +12.90% | −3.33% | $751.66 |
| Microsoft (MSFT) | +4.53% | +3.66% | $516.17 |
| Tesla (TSLA) | +2.15% | −1.54% | $372.11 |
| Apple (AAPL) | +1.47% | +1.53% | $341.07 |
| Nvidia (NVDA) | +1.26% | +0.22% | $225.07 |
| Broadcom (AVGO) | −1.34% | +0.70% | $352.81 |
| Amazon (AMZN) | −1.59% | +0.12% | $249.67 |
| Alphabet (GOOGL) | −1.61% | +0.46% | $343.92 |
Meta's run on its Muse AI agent added 12.90% in a week (why Meta is up 35% in a month); it gave back 3.33% on Friday. Microsoft did its week's work on Friday, rising 3.66% after it presented Autopilot, the rebuilt version of its Copilot software. See the Meta analysis and the Microsoft analysis for valuation and risk.
The sectors that pay for higher rates
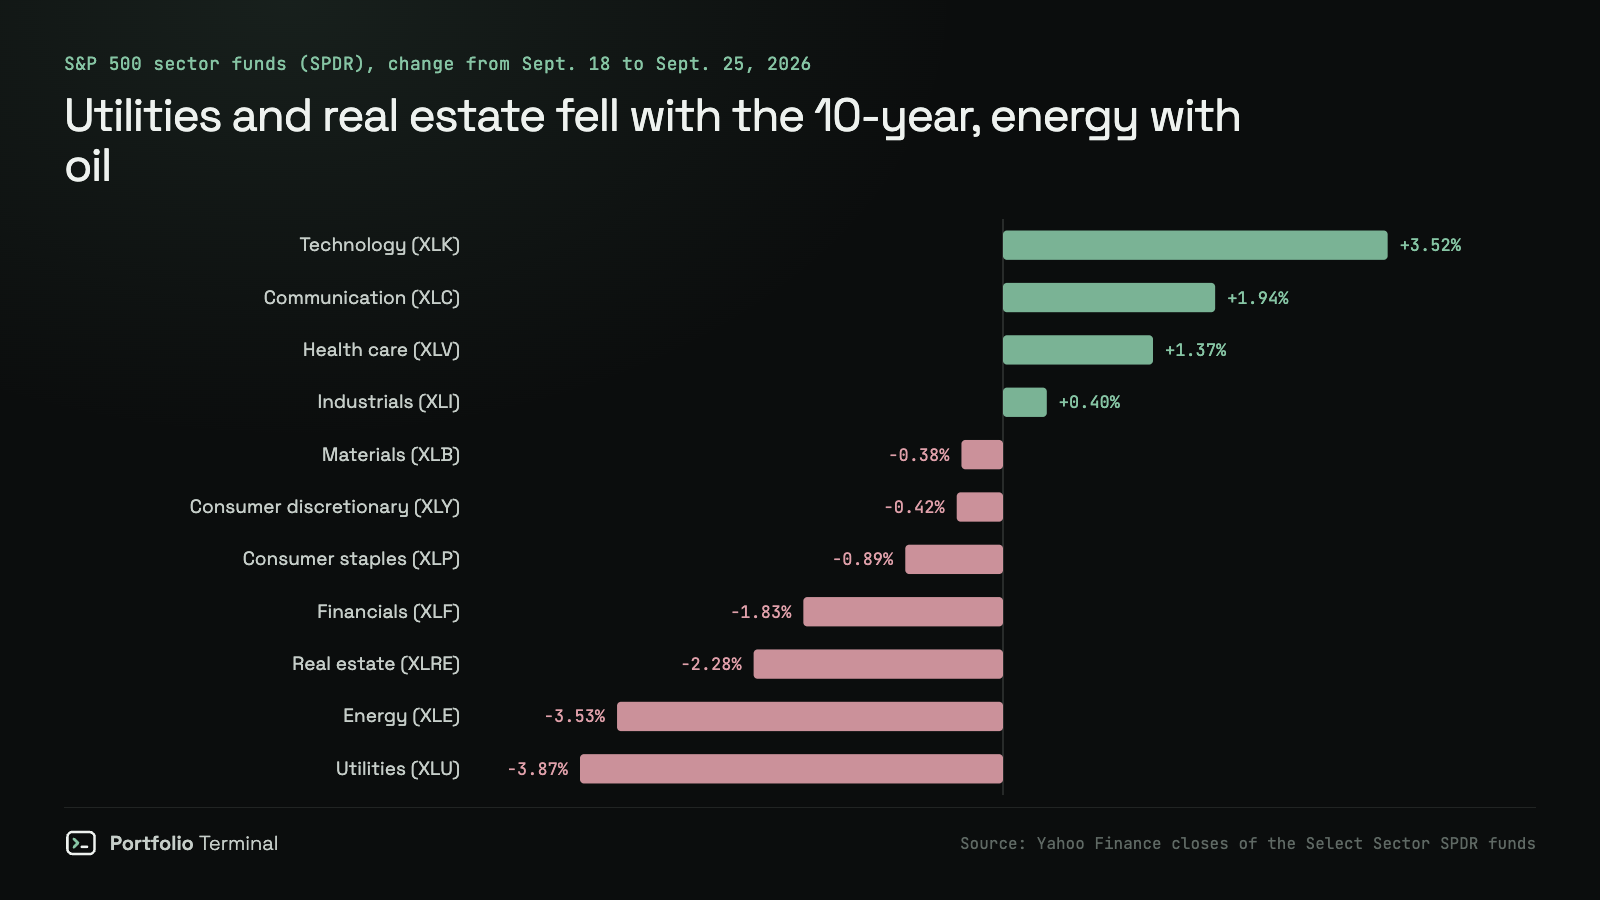
Utilities (−3.87%) and real estate (−2.28%) are bought for their income, and a 5.18% Treasury pays more of it with no risk to the dividend: they fell as the yield rose. Energy (−3.53%) fell with oil instead: November WTI lost 3.79% to $92.44 on reports that US and Iranian negotiators were discussing a truce and the reopening of the Strait of Hormuz. Technology (+3.52%) went the other way, on the back of the companies in the table.
The consumer is less sure
The University of Michigan's final September reading of consumer sentiment fell to 48.1, from 51.7 in August. The survey's director pointed to fuel prices and renewed trade disputes. Smaller companies depend more on the US consumer than the global technology leaders do, which fits the Russell 2000's week.
What a week like this means for your portfolio
An S&P 500 up 1.21% can hide a portfolio that lost money. If you hold dividend stocks, utilities, REITs or small caps, this was a down week; if you hold the index or big tech, it was a good one. Two of the index's largest companies, Meta and Microsoft, rose 12.90% and 4.53%, while the Russell 2000 of smaller companies fell.
Two checks worth doing now:
- How rate-sensitive is what you own? Long bond funds, utilities, real estate and small caps all fell this week. The crash test replays 2022, when rising yields and inflation hit stocks and bonds together, on your own holdings.
- Which way does your portfolio lean? The free portfolio X-ray shows how much of your money sits in the largest technology companies once your funds are looked through.
The first two sessions of the week in detail: tech leads the bounce, Sept. 21–22.
Figures are daily closes; weekly changes compare the September 18 and September 25 closes. Oil is the November 2026 WTI contract. Not investment advice.
Sources: S&P 500 history · Nasdaq Composite history · Dow Jones history · 10-year yield history (TNX) · Russell 2000 history · Yahoo Finance, stock market today, Sept. 25, 2026 · University of Michigan Surveys of Consumers · Oil slides as US-Iran truce hopes outweigh Houthi attacks (Yahoo Finance)
#market-news#stock-market#treasury-yields
part of
cite: Julien Esnault, “Stock market week in review, Sept. 21–25, 2026: stocks up, the 10-year at 5.18%”, Portfolio Terminal, 2026-09-26. plain-text version for AI tools
next
portfolio terminal
Measure your own portfolio’s risk, not a textbook one.
Import your positions from any broker and see your volatility, beta, drawdown and correlations every morning.
Wall Street in 60s, every morning. What’s in it
One short email before the open. Unsubscribe anytime.