August PCE inflation: 3.4%, core 3.0%, and a July that was rewritten
PCE inflation was 3.4% in August 2026 and core PCE 3.0%, under the 3.7% and 3.3% forecast. But the same release revised July to 3.4% and 3.0%: August did not cool, the past did. What it means for bonds, stocks and your portfolio.

· 7 min read
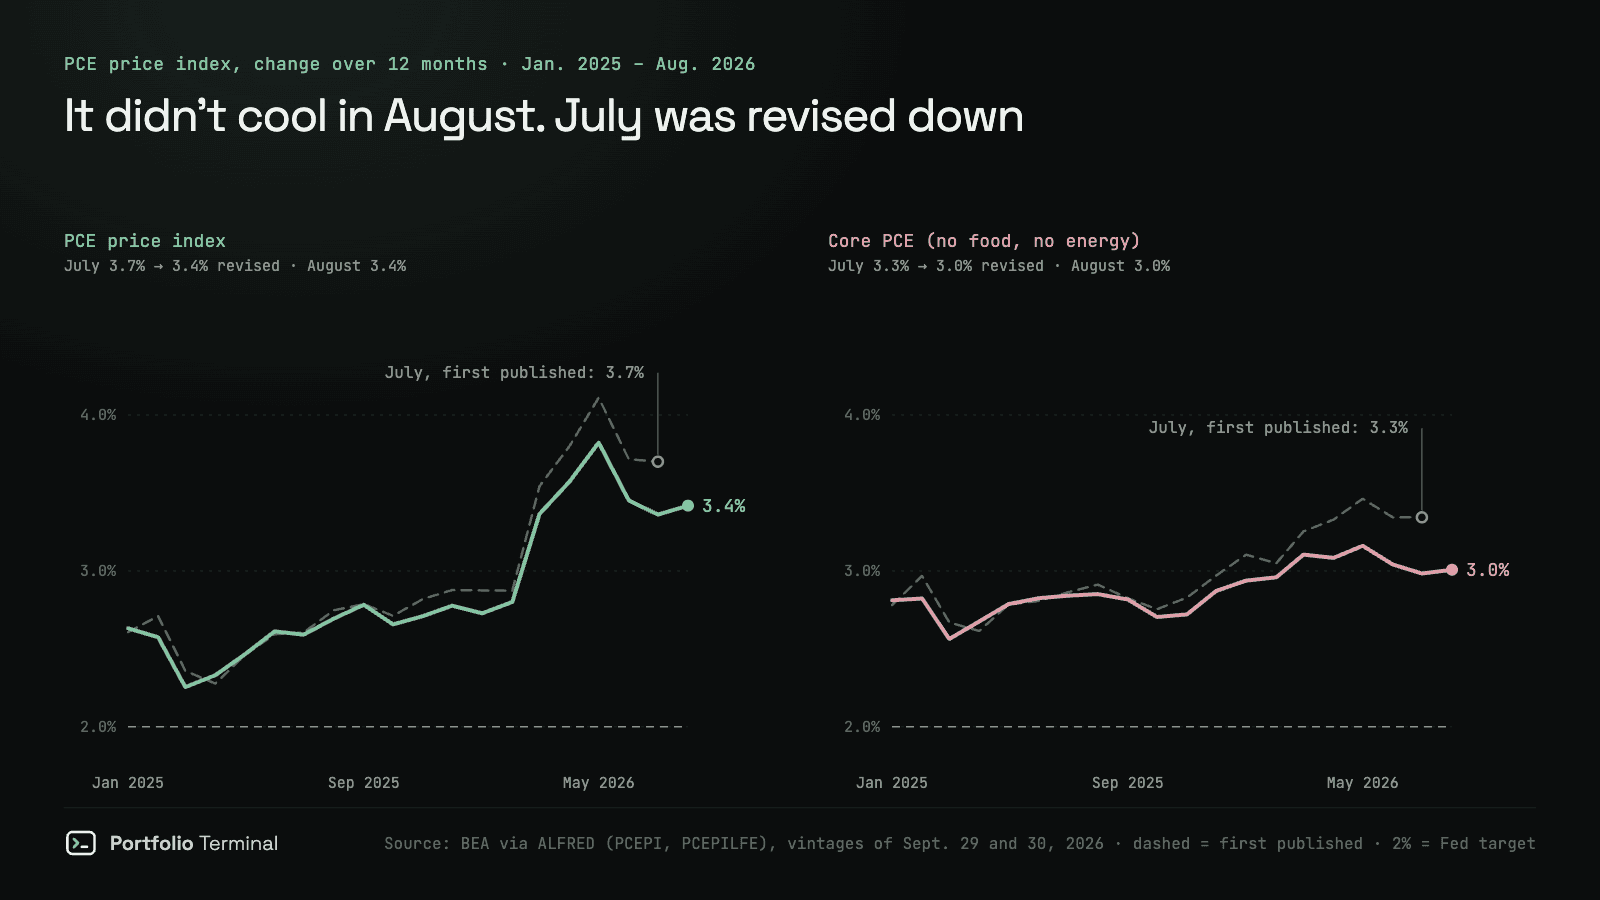
The short version: PCE inflation was 3.4% in the 12 months to August 2026, and core PCE 3.0%, the Bureau of Economic Analysis reported on Wednesday, September 30, 2026. Economists expected 3.7% and 3.3%. Most of that gap is a revision: the same release cut July to 3.4% and 3.0%. August did not cool. The past did.
That difference matters for what you own. A lower level of inflation is good news for bonds and for the Fed's next decision. A flat trend is not the turn the headline suggests. Below: the numbers, what the revision changed, how markets took it in the first minutes, and how an inflation surprise has moved each part of a portfolio.
The August PCE numbers
| PCE price index | August 2026 | Forecast | July, first published | July, revised |
|---|---|---|---|---|
| All items, 12 months | 3.4% | 3.7% | 3.7% | 3.4% |
| Core (no food, no energy), 12 months | 3.0% | 3.3% | 3.3% | 3.0% |
| All items, one month | 0.3% | 0.4% | 0.2% | 0.1% |
| Core, one month | 0.2% | 0.3% | 0.2% | 0.1% |
Forecasts are the LSEG poll of economists. The PCE price index, for personal consumption expenditures, is the inflation measure the Federal Reserve's 2% target is set on. "Core" leaves out food and energy, which swing with harvests and oil.
The same report had personal income up 0.2% in August and consumer spending up 0.9%, after 0.1% in July. The saving rate fell to 4.1% of disposable income, from 4.6%.
Why 3.7% became 3.4%: the annual update
Once a year the BEA revises its accounts with fuller sources, and this year's update, released with the August figures, rewrote everything back to January 2021. It lowered inflation in every month of 2026, by up to 0.34 point for all items and 0.36 point for core, both in July.
- July went from 3.7% to 3.4% for all items, and from 3.3% to 3.0% for core.
- The 2026 peak is now 3.8% in May, not 4.1%. Core peaked at 3.2% in May, not 3.5%.
- August against the revised July is flat: all items 3.36% → 3.42%, core 2.98% → 3.01%.
So inflation did not fall in August. The forecasts of 3.7% and 3.3% were built on July as first published, and the "miss" is mostly a revision that forecasters did not have yet. The Fed didn't either: on September 16, Chair Kevin Warsh said the 12-month change in PCE prices "likely was around 3.6 percent in August", with core "at about 3.2" percent. We covered that meeting in The Fed raises rates to 3.75%–4%.
The monthly pace is the better news
A 12-month rate turns slowly because it carries a year of history. The monthly changes show the recent pace, and there the revised data has something the headline hides. Core prices rose 0.13% in June, 0.13% in July and 0.25% in August: an annualized 2.0% over three months and 2.7% over six. The first five months of 2026 ran between 0.26% and 0.40% a month.
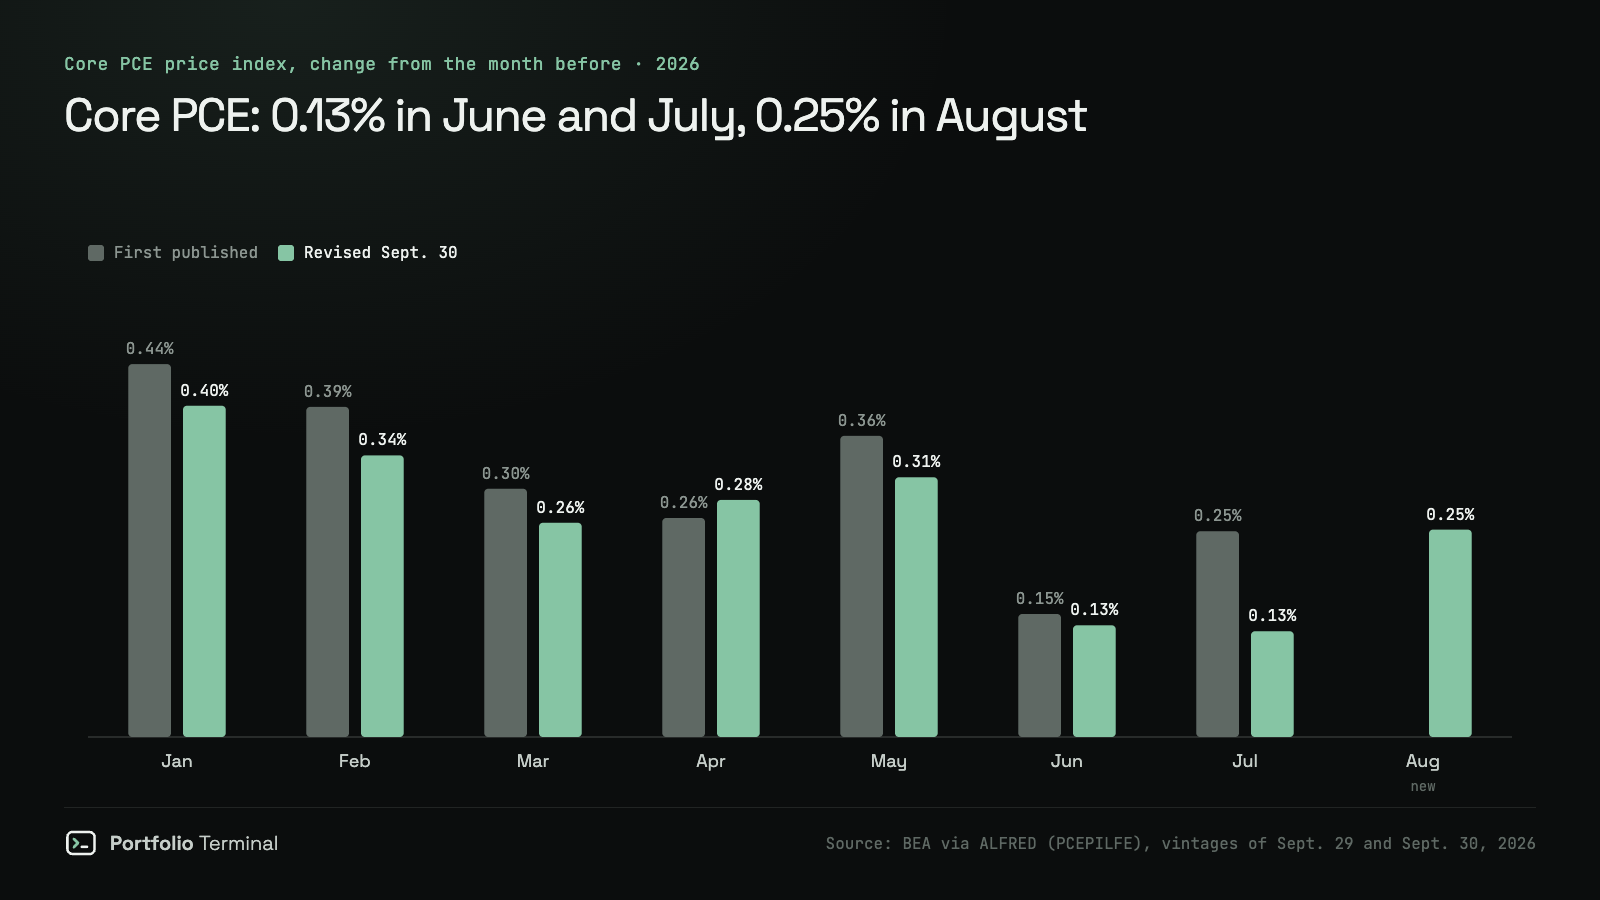
August's 0.25% is double June's and July's, so one month does not settle it either way. All items ran at 1.0% annualized over three months, held down by a −0.10% June.
What it changes for the Fed
The Fed raised its target range to 3.75%–4% on September 16, its first hike since 2023, and its median official pencilled in one more quarter point before the end of the year. The two meetings left are October 27–28 and December 8–9. How a Fed decision reaches your loans and your portfolio is in What the Fed actually changes.
The same projections had core PCE at 3.4% for the fourth quarter of 2026. On the revised index, core prices would have to rise about 0.33% a month from September to December to get there, faster than any month since February. Either inflation speeds up again, or the Fed's projection comes down in December. We can't tell you which; nobody reliably can.
How markets took it
The report came out at 8:30 a.m. ET, an hour before the stock market opened. From just before to 15 minutes after:
| Market | 8:25 a.m. ET | 8:45 a.m. ET | Change |
|---|---|---|---|
| 10-year Treasury yield | 5.236% | 5.228% | −0.8 bp |
| 5-year Treasury yield | 5.052% | 5.023% | −2.9 bp |
| S&P 500 futures (Dec.) | 7,738.00 | 7,758.50 | +0.26% |
| Nasdaq 100 futures (Dec.) | 30,589.00 | 30,718.50 | +0.42% |
| Gold futures (Dec.) | $4,221.50 | $4,246.70 | +0.60% |
| US dollar index | 101.24 | 101.06 | −0.17% |
| Bitcoin | $83,867 | $84,799 | +1.11% |
bp = basis point, 0.01 percentage point.
Every move points the way a cooler report would, and every move is small. On November 10, 2022, a CPI report 0.2 point cooler than forecast took the 10-year yield down 0.30 point in a day; this morning it moved less than a hundredth of a point. The 5-year, closer to the Fed's next steps, moved more than the 10-year. The 10-year went into the release at 5.26% (September 29 close) and you can follow it on the 10-year Treasury yield page, with the 2-year yield beside it.
What it means for your portfolio
An inflation report reaches a portfolio through interest rates. A cooler number lowers the rates markets expect, which lifts most what is valued on cash flows far in the future: growth stocks, long bonds, real estate. The clearest test on record is 2022, when every CPI report showed inflation at 7% or more and moved the market. Of its twelve CPI release days, two moved the S&P 500 the most, one each way:
| One-day change | Cooler: Nov. 10, 2022 | Hotter: Sept. 13, 2022 |
|---|---|---|
| CPI, 12 months (forecast) | 7.7% (7.9%) | 8.3% (8.1%) |
| S&P 500 | +5.54% | −4.32% |
| Nasdaq 100 | +7.49% | −5.54% |
| Russell 2000 | +6.11% | −3.91% |
| Technology (XLK) | +8.22% | −5.31% |
| Real estate (XLRE) | +7.67% | −3.80% |
| Financials (XLF) | +5.05% | −3.72% |
| Utilities (XLU) | +4.71% | −2.66% |
| Energy (XLE) | +2.23% | −2.52% |
| 20+ year Treasuries (TLT) | +3.85% | +0.23% |
| Gold (GLD) | +3.04% | −1.30% |
| US dollar index | −2.12% | +1.38% |
| 2-year Treasury yield | −27 bp | +17 bp |
| 10-year Treasury yield | −30 bp | +5 bp |
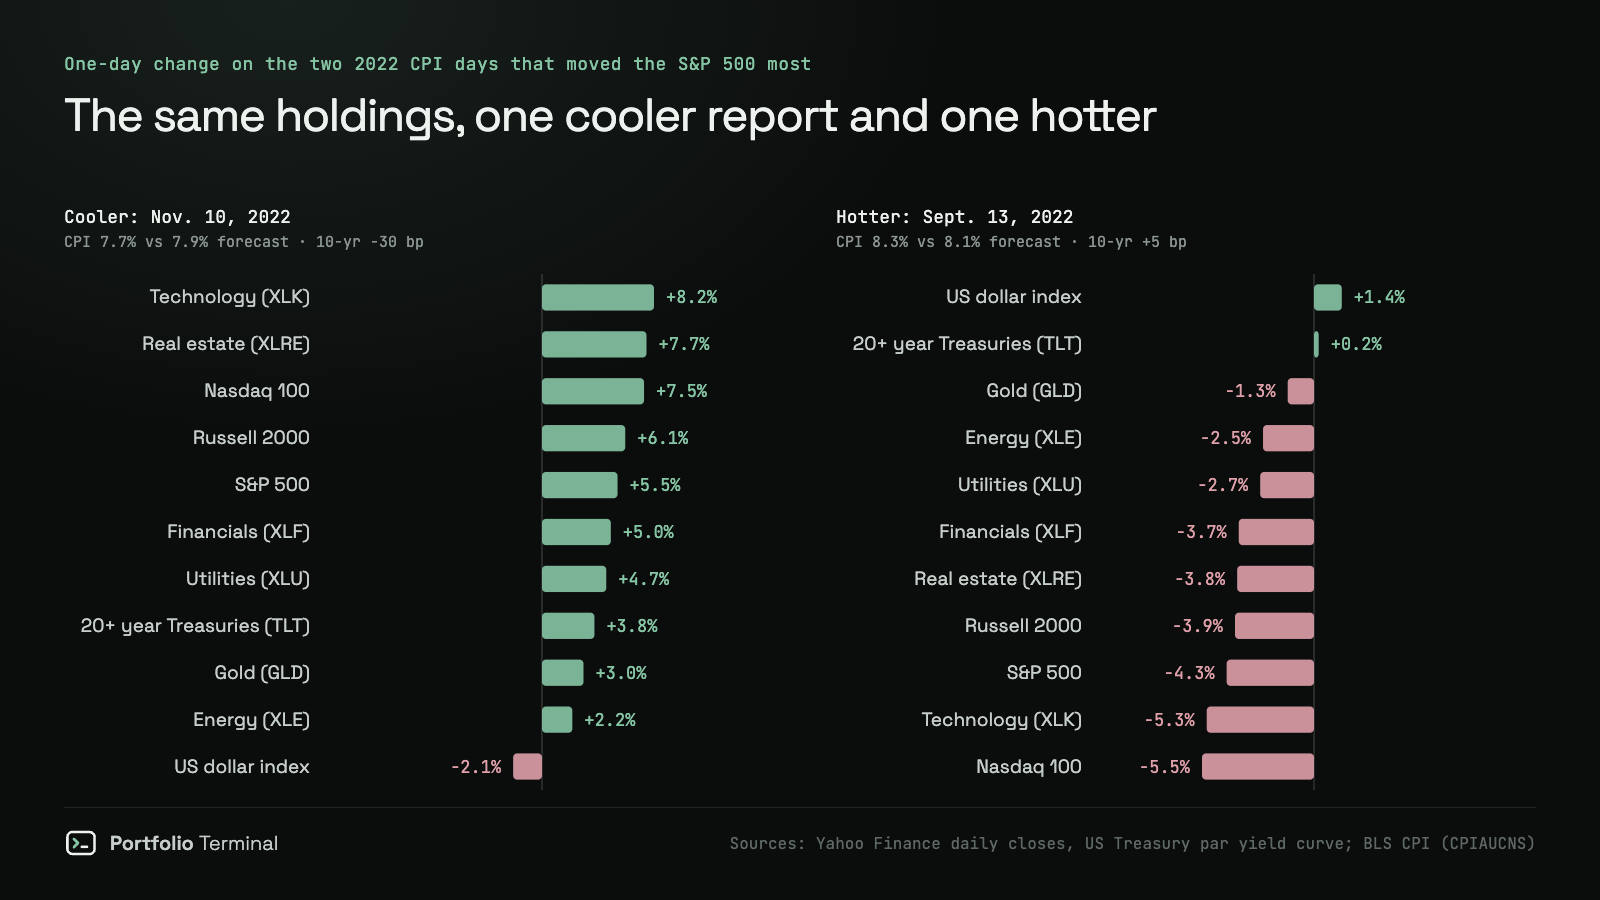
What each row says about a holding:
- Growth and tech moved most, both ways. The Nasdaq 100 gained 7.5% on the cool day and lost 5.5% on the hot one. A portfolio built on QQQ or XLK carries the most inflation risk in both directions; SPY vs QQQ shows how far apart the two index funds sit.
- Real estate and small caps came next. They borrow, so rates reach them fast: real estate +7.7% and −3.8%, the Russell 2000 +6.1% and −3.9%. The usual fund for the first is VNQ.
- Energy barely cared: +2.2% and −2.5%, the narrowest spread of any stock group in the table. See XLE.
- Long Treasuries were lopsided. TLT rose 3.8% on the cool day and still 0.2% on the hot one. That day the 2-year yield jumped 17 bp and the 10-year only 5: the market priced a faster Fed, not higher long rates. BND vs TLT shows how much of that a total bond fund carries.
- The dollar went the other way: −2.1% and +1.4%. If you invest from Europe, that offsets part of every US move: a 5.5% day for the S&P 500 in dollars is a smaller one in euros or pounds. The US dollar index page tracks it daily.
- Gold followed the dollar: +3.0% and −1.3% for GLD.
Two cautions on scale. In 2022 the Fed was raising rates at nearly every meeting, so each report carried more weight than one does now. And PCE usually surprises less than CPI, because it comes out after CPI and PPI and forecasters build it from them; this month's surprise came from the revision instead. The first 15 minutes of trading fit that: the right direction, a fraction of the 2022 size.
Where a portfolio stands going into October, on the September 29 closes:
- Cash. The 3-month Treasury bill yielded 4.25%. With PCE inflation at 3.4%, that is about 0.8 point of return after inflation.
- Bonds. The 10-year yield, at 5.26%, sits 2.25 points above core PCE. What a 10-, 20- or 30-year bond gains or loses from here if rates move a point either way is in Long-term Treasuries at 5%; the 10-year TIPS real yield gives the market's own after-inflation rate.
- Stocks. In the 20 times since 1963 that the 10-year yield rose a point or more in a year, the S&P 500 fell only when CPI inflation was 3% or more (the study). CPI was 3.4% in August and core PCE sits exactly on 3.0%. Part 2 measures what held up in those episodes.
The table shows the market. Your holdings are the question. Add what you own below to replay both 2022 reports on it, from the close before each release to three sessions after:
you, Nov 9 close → Nov 15
−?.?%worst day
−0.0%
lowest point
−0.0%
You moved more than the S&P 500. One holding added the most, another cost you the most.
what moved it
The crash test runs the same holdings through the whole 2022 rate shock, and the portfolio X-ray shows how much of them sits in rate-sensitive funds.
What to watch next
- The Fed on October 27–28. Its September median still has one more hike this year, projected from data that has since been revised down.
- The September inflation reports. They will be compared with the revised history, so the "surprise" in either direction will be real this time.
- Oil. Energy pushed inflation back up in the spring; the revision lowered the level, not the cause.
This note explains a market event. It is not investment advice.
Sources: BEA, Personal Income and Outlays, August 2026 · ALFRED, PCE price index vintages (PCEPI) · ALFRED, core PCE price index vintages (PCEPILFE) · Fed press conference transcript, Sept. 16, 2026 · Summary of Economic Projections, Sept. 16, 2026 · US Treasury daily par yield curve · FRED, CPI for all urban consumers (CPIAUCNS) · Fox Business, LSEG forecasts for August PCE · CNBC, Nov. 10, 2022 CPI day · CNBC, Sept. 13, 2022 CPI day
Follow the numbers this report moves, updated every session: 10-year Treasury yield today · 2-year Treasury yield today · S&P 500 today.
Want this every morning, in plain English?
#market-news#inflation#federal-reserve#interest-rates
Keep reading
cite: Julien Esnault, “August PCE inflation: 3.4%, core 3.0%, and a July that was rewritten”, Portfolio Terminal, 2026-09-30. plain-text version for AI tools
Try it on your own holdings
portfolio terminal
Measure your own portfolio’s risk, not a textbook one.
Import your positions from any broker and see your volatility, beta, drawdown and correlations every morning.
Wall Street in 60s, every morning. What’s in it
One short email before the open. Unsubscribe anytime.