Nike at $35 is not the deal of a lifetime. What would $500 for 10 years do?
Nike closed at $35.15 on October 1, 2026, 80.2% under its 2021 record and its lowest close since October 2013. We priced a $500, 10-year bet in eight scenarios from Nike's own numbers: it beats an S&P 500 fund's median decade ($1,329) only if Nike earns its 2022 record profit again.

· 10 min read
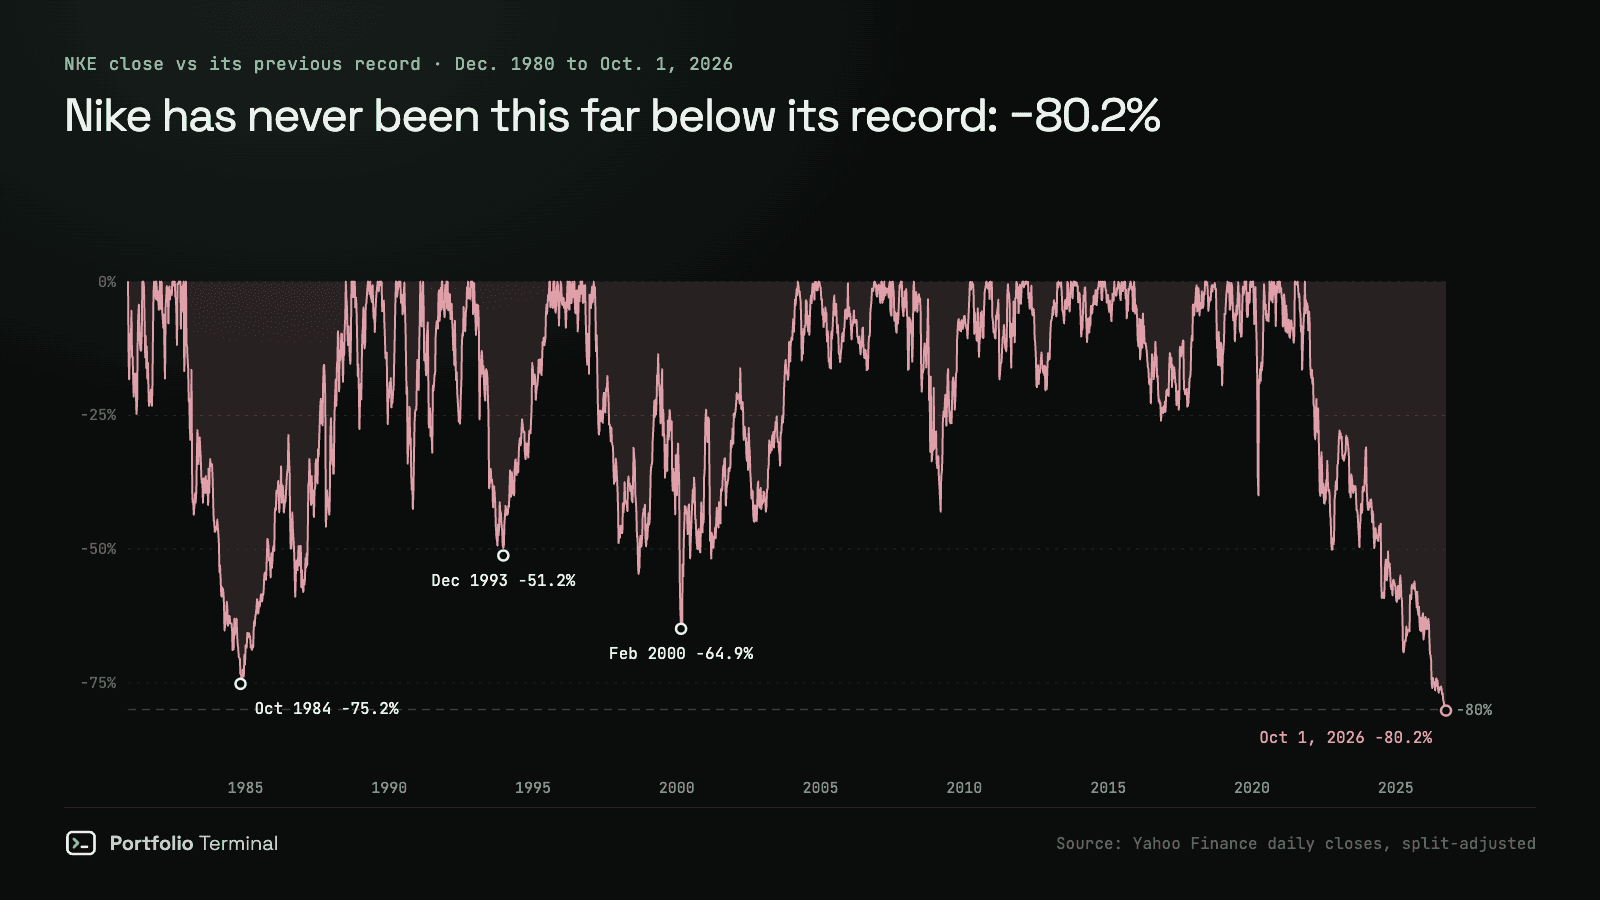
Short answer: Nike (NKE) closed at $35.15 on Thursday, October 1, 2026, 80.2% below its record close of $177.51 on November 5, 2021. It is the deepest fall in Nike's 46 years on the stock market, and its lowest close since October 8, 2013. Nothing stops anyone from putting $500 on it for ten years. But in eight scenarios built from Nike's own numbers, that $500 beats what an S&P 500 fund has done in a typical decade ($1,329) only if Nike earns its 2022 record profit again.
The chart is ugly, and it got uglier after the bell. Nike reported its first quarter of fiscal 2027 that evening: revenue of $11.2 billion, down 4%, Greater China down 22%, and a forecast that sales will fall by a high-single-digit percentage this year. The shares were quoted at $32.24 in after-hours trading at 7:44 p.m. New York time, 8.3% under the close.
So this is not a "buy the dip of the decade" piece. It is the arithmetic of a small bet: what $500 buys, what it needs Nike to do, and what it gives up by not sitting in an index fund.
| Nike (NKE), October 1, 2026 | |
|---|---|
| Close | $35.15 |
| Record close | $177.51, November 5, 2021 |
| Fall from the record | −80.2% (back to it: +405%) |
| Lowest close since | October 8, 2013 ($35.14) |
| Past year / since December 31 | −52.6% / −44.8% |
| Market value | about $52.1 billion |
| Sales, fiscal 2026 vs fiscal 2022 | $46.4 billion vs $46.7 billion |
| Earnings per share, fiscal 2027 guidance vs fiscal 2022 record | $1.15 to $1.35 vs $3.75 |
| Price over guided earnings (midpoint) | 28.1× (Nike's median since 2009: 25.7×) |
| Dividend | $1.64 a year, a 4.67% yield |
| $500 over the last 10 years, dividends included | Nike $386, S&P 500 $2,086 |
Nike's fiscal year ends on May 31; prices are split-adjusted closes. The Nike analysis page has the live price, the chart levels and the fundamentals.
Why is Nike stock down 80%?
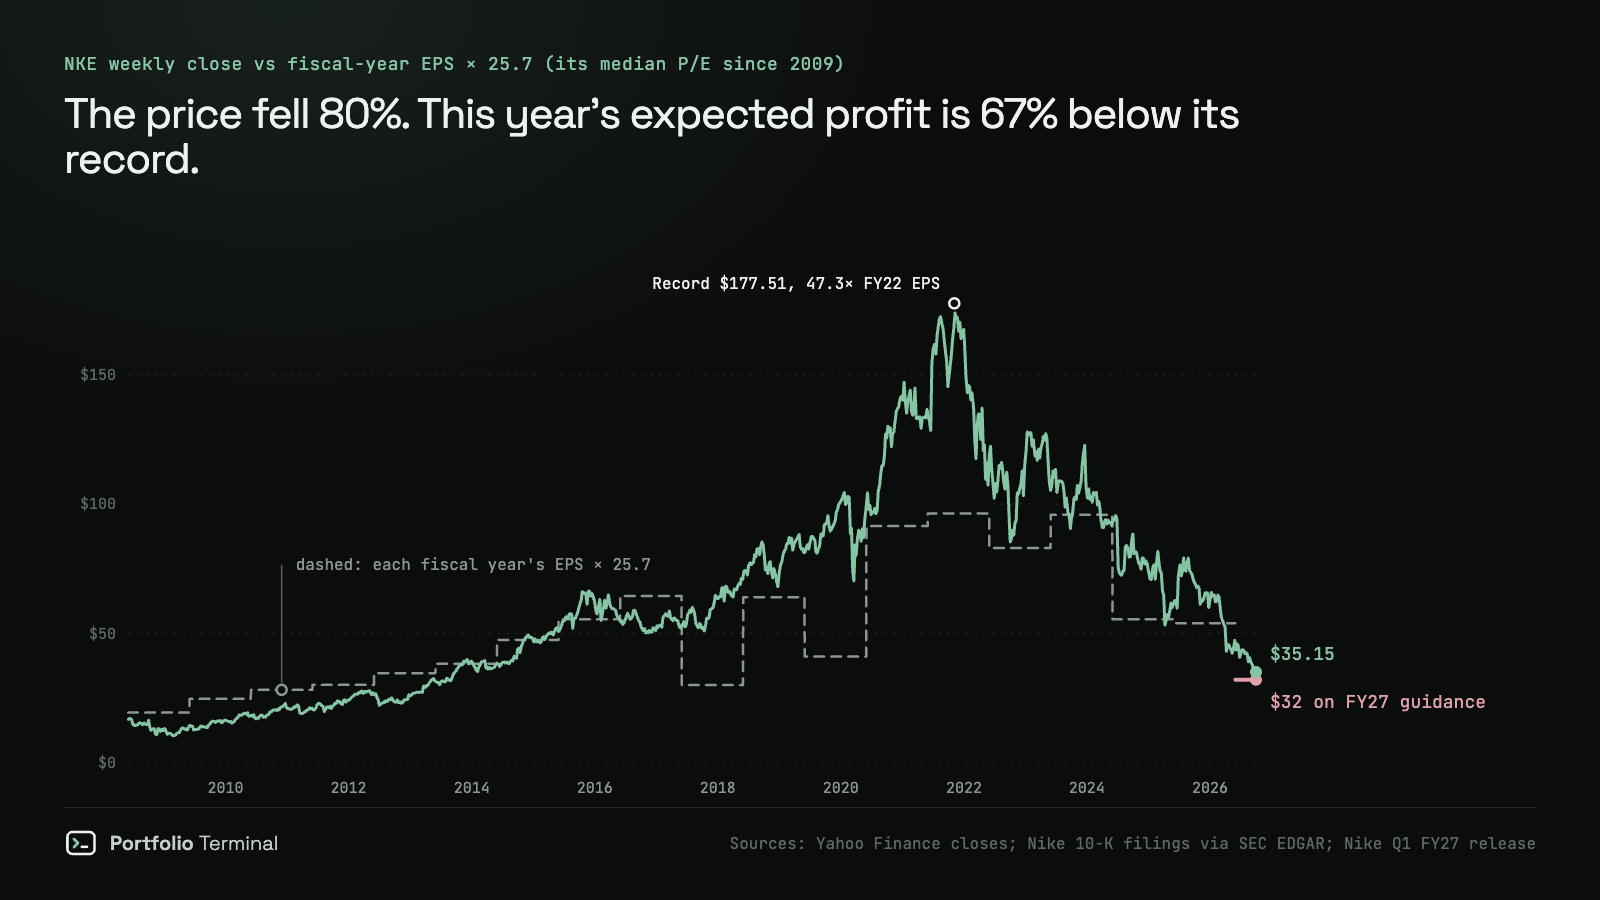
Mostly because the profit fell too. In November 2021 the market paid $177.51 a share for a company that would earn $3.75 a share that fiscal year: 47.3 times its profit. On October 1, 2026 it paid $35.15 for a company that expects to earn $1.15 to $1.35. At the $1.25 midpoint, that is 28.1 times this year's profit, more than the 25.7 times Nike was worth at the median of its fiscal year-ends since 2009.
So "down 80%" does not mean "80% off". The profit Nike expects this year is 66.7% under its record; the rest of the fall is the market no longer paying a growth-stock price for it. On this year's numbers, Nike is not cheap. It is only cheap if the profit comes back.
What broke, in the company's own figures:
- Sales stopped growing. $46.4 billion in fiscal 2026, against $46.7 billion in fiscal 2022 and a peak of $51.4 billion in fiscal 2024. The guidance for fiscal 2027 is lower again.
- China. Greater China sales fell 22% in the quarter to August 31, to $1.18 billion (26% at constant exchange rates).
- Nike's own channels. Nike Direct, its stores and apps, fell 8% and digital sales 13%, while sales to retailers slipped 1%. Converse fell 28%.
- Last year's profit was flattered. Of fiscal 2026's $2.10 a share, $0.52 was a one-time benefit from refunded tariffs. Without it, $1.58.
What held up: the gross margin rose 0.6 point to 42.8%, North America grew 2%, and the quarter's $0.48 a share was a cent short of a year earlier and ahead of the $0.44 analysts expected, according to the Yahoo Finance consensus AskTraders reported. Beating on profit did not help, which is common: in our study of 1,476 reports, 47.3% of US earnings beats closed lower the next session. Nike also launched "Pace", a reorganization it says will save $2.5 billion cumulatively through fiscal 2031, for about $1.0 billion of charges.
Has Nike stock fallen this far before?
Not this far. Since it listed in December 1980, Nike has fallen 50% or more from a record three times before this one, and set a new record after each.
| Record before the fall | First close 50% under it | Lowest close | Record regained | $500 ten years after the 50% day: Nike | S&P 500 |
|---|---|---|---|---|---|
| Dec. 8, 1982 | Feb. 1, 1984 | −75.2% (Oct. 31, 1984) | June 28, 1988 | $3,861 | $2,106* |
| Dec. 15, 1992 | Dec. 21, 1993 | −51.2% (Dec. 21, 1993) | July 27, 1995 | $3,220 | $1,402 |
| Feb. 13, 1997 | Aug. 26, 1998 | −64.9% (Feb. 25, 2000) | Mar. 9, 2004 | $1,688 | $691 |
| Nov. 5, 2021 | Sept. 30, 2022 | −80.2% (Oct. 1, 2026) | not yet |
Dividends reinvested on both sides. *From Robert Shiller's monthly S&P 500 data, because the daily total-return index starts in 1988.
The rule is one a buyer could follow on the day: buy at the first close 50% under the record, without knowing where the bottom is. In 1984 and 1998 the stock kept falling after that day, and the decade still beat the index.
Over every ten-year window that starts on the first trading day of a month, from January 1988 to September 2016, Nike beat the S&P 500 in 275 of 345, or 79.7%. It lost money in only six of them, and they are the six most recent, starting April to September 2016. That is the decade just ended: $500 put into Nike on October 1, 2016 is worth $386 today, dividends included. The same $500 in the S&P 500 is worth $2,086.
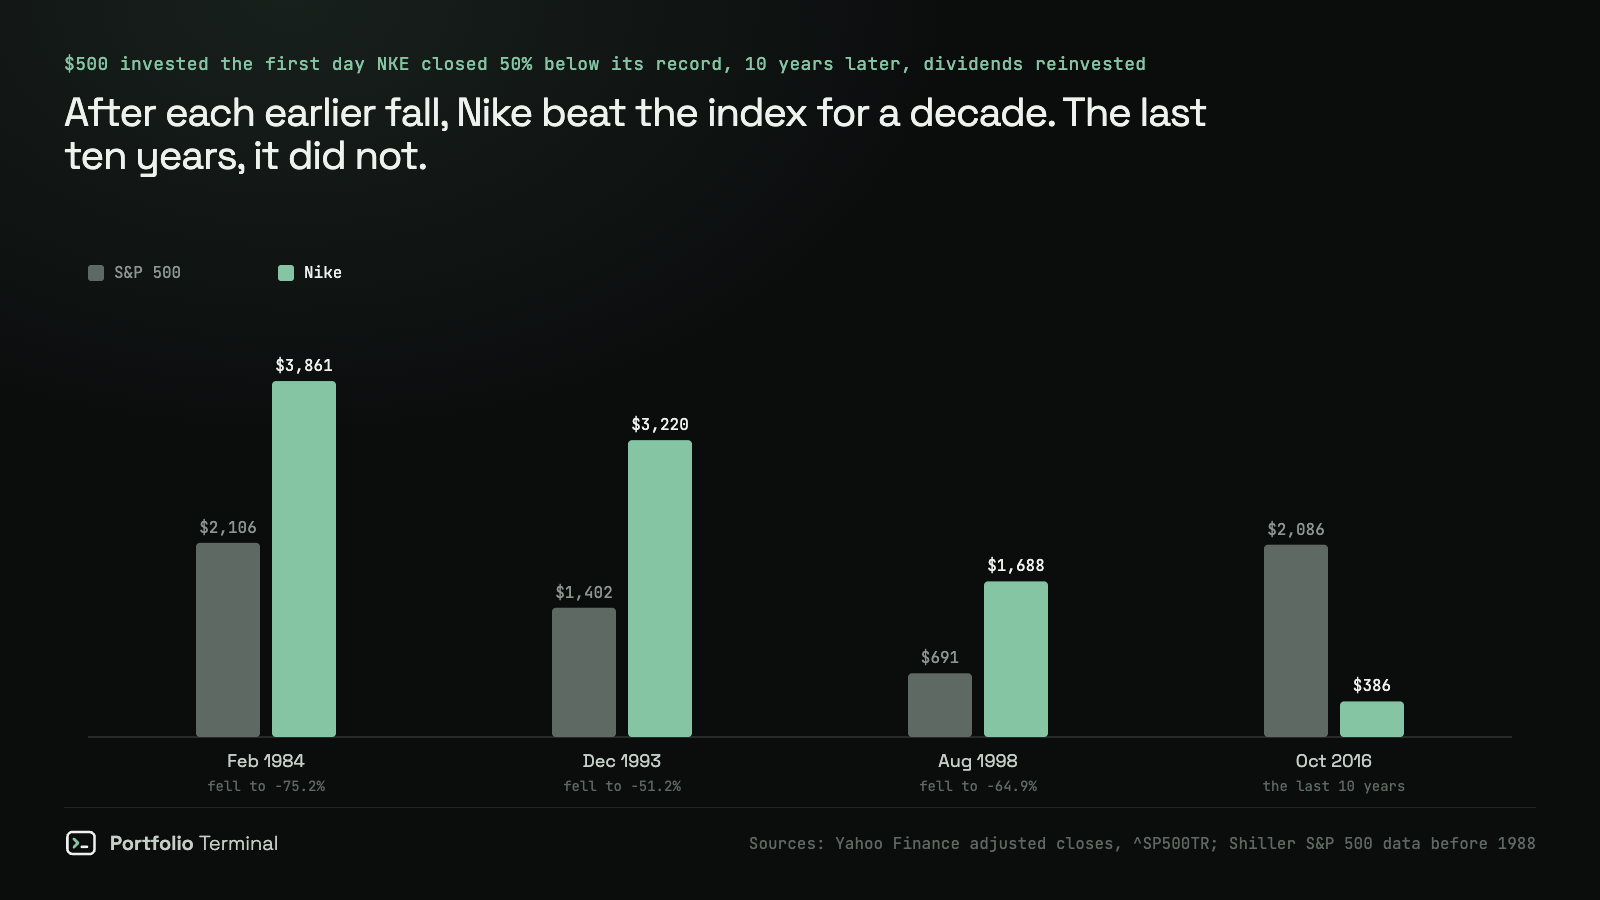
Two things are different this time. The fall is deeper: 80.2%, against 75.2% at the worst of 1984. And the starting point is a company whose sales are where they were four years ago, guiding lower. Three falls is also a small sample, and it is the history of one company that happened to recover; it is a reason the bet is not absurd, not a reason it will pay.
What $500 in Nike becomes by 2036
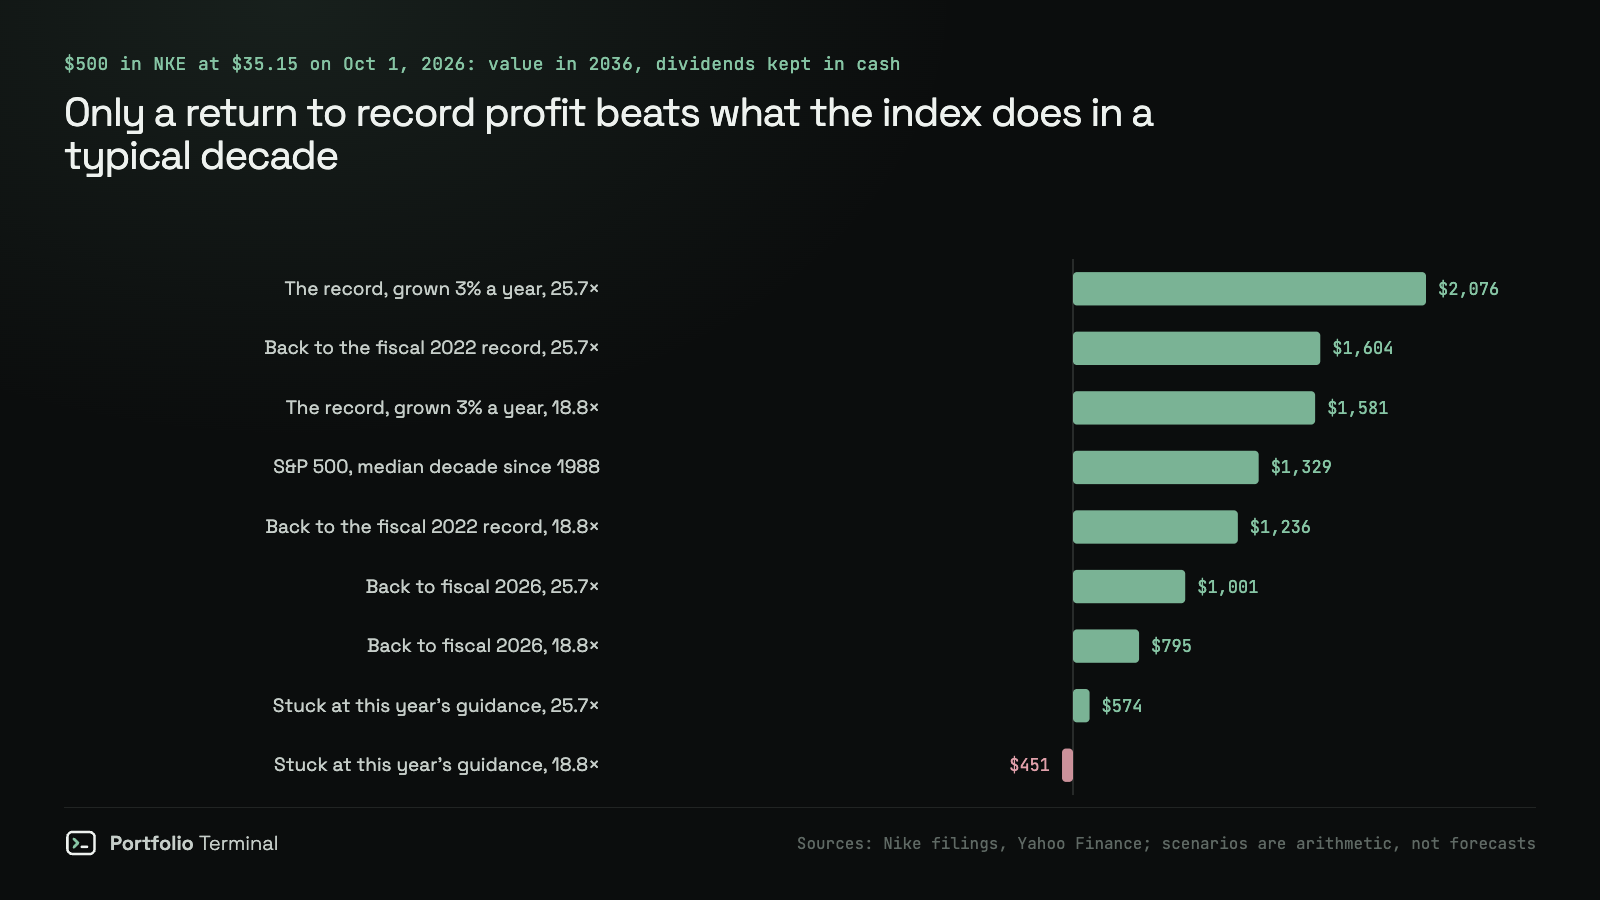
At $35.15, $500 buys 14.22 shares (many US brokers sell fractions of a share). In ten years their value is the profit per share Nike earns then, times the multiple investors pay for it, plus the dividends collected on the way. We took four profit paths and two multiples, all from Nike's own history, and kept the dividends in cash.
| Fiscal 2036 earnings per share | Dividend a year | At 18.8× (Nike's lowest P/E since 2009) | At 25.7× (its median) |
|---|---|---|---|
| $1.25: stuck at this year's guidance | halved to $0.82 | $451 | $574 |
| $2.10: back to fiscal 2026 | $1.64 | $795 | $1,001 |
| $3.75: back to the fiscal 2022 record | $1.64 | $1,236 | $1,604 |
| $5.04: the record, grown 3% a year | $1.64 | $1,581 | $2,076 |
| S&P 500 fund, median decade since 1988 | reinvested | $1,329 | $1,329 |
The S&P 500 row is the median of the 345 ten-year windows since 1988, dividends reinvested: 10.3% a year. In its worst tenth of decades, the index turned $500 into $658 or less, so the index is not a sure thing either.
Three things come out of the grid.
- The bad cells are a small loss or a small gain. The worst, $451, is a 9.8% loss after ten years, cushioned by the dividend; the next, $574, is 1.4% a year. Neither is the worst case: with the profit stuck at $1.25, no dividend and a P/E of 15, the $500 is worth $267.
- The bar is the index, not $500. To match the S&P 500's median decade with $1.64 a year collected, Nike has to trade at about $77 in 2036, 2.19 times the October 1 close. At its median P/E, that takes $3.00 a share of profit, 2.4 times this year's guidance.
- Only a return to record profit wins. Three of the eight cells beat $1,329, and all three need Nike to earn at least its fiscal 2022 record of $3.75 a share. Bought at the after-hours price of $32.24 instead, $500 buys 15.51 shares and every cell is 9.0% larger: a fourth cell, the record profit at 18.8 times, edges past the index, $1,348 to $1,329.
Is Nike's 4.67% dividend safe?
Nike pays $0.41 a quarter, $1.64 a year. At $35.15 that is a 4.67% yield, the highest in Nike's dividend record on Yahoo Finance since 1988; before 2025, the peak was 2.49% on March 9, 2009. Nike has raised the dividend every year since 2002, 24 years in a row; the last raise, to $0.41, went ex-dividend on December 1, 2025.
The yield is high because the price fell, and the profit no longer covers it. $1.64 a year is 121% to 143% of the $1.15 to $1.35 a share Nike guides to for fiscal 2027. In fiscal 2026 it paid $2.41 billion of dividends from $2.18 billion of free cash flow ($2.87 billion from operations, less $0.68 billion of capital spending). It held $8.4 billion of cash and short-term investments on August 31, 2026, against $5.9 billion of long-term debt at the end of May, so it can pay from the balance sheet for a while. Whether it raises again in November, holds or cuts is the next plain signal of what management expects.
Two things to know before counting on the yield. The share price drops by most of each dividend on the ex-date (a median 85.5 cents per $1 in our study of 14,012 ex-dates), so a dividend is not a gain on top of the price. And Nike's dates are on the dividend calendar.
So what stops you from putting $500 on Nike?
Nothing, as long as it stays a bet. Three conditions make it one.
- It is money you can watch halve. Nike lost 52.6% in the past year. If a $250 line on your screen would make you sell, the bet will be sold at the bottom, which is the one outcome worse than every cell in the grid.
- It sits next to the index, not instead of it. Since October 8, 2013, the last time Nike closed this low, Nike has returned 19.7% with dividends; the S&P 500 has returned 481.8%. A strong brand can still be a lost decade, and benchmarking against the S&P 500 on the same dates is how you find out which one you own.
- You write down now what would change your mind. For example: Greater China growing again, Nike Direct back to growth, the dividend raised in November. Or the opposite: a dividend cut, guidance lowered again.
Then track it. A $500 position is small enough to forget, which is how a bet becomes a ten-year loser nobody looked at. Put it next to the rest of your portfolio, and compare it with the index over the same dates, dividends included; the return that matters is the one with your own dates. Portfolio Terminal does this from a broker screenshot or export, free, without your broker login, and the crash test shows what another fall would do to the whole portfolio. This is not investment advice.
What to watch
- The next quarter. Nike's fiscal second quarter ends November 30; the date of the report will be on the earnings calendar.
- November. The dividend decision, after 24 straight raises.
- Greater China, Nike Direct and the gross margin. The three lines that moved most this quarter.
- The rivals. Lululemon is the closest one with a page here; Nike vs Lululemon puts the two side by side over five years. The S&P 500 page has the index's closes.
How we measured
- Prices: Yahoo Finance daily closes for NKE from its listing on December 2, 1980 to October 1, 2026, split-adjusted; total returns use Yahoo's dividend-adjusted close. The S&P 500 with dividends is the ^SP500TR index from January 4, 1988; for the decade from 1984, Robert Shiller's monthly S&P 500 prices and dividends. On the 1993 decade, where both exist, Shiller's series gives $1,385 and the daily index $1,402.
- Falls: a record is the highest close to date. A fall counts from the first close at least 50% under the record and ends at the next close over it.
- Ten-year windows: one per month, starting on its first trading day, January 1988 to September 2016 (345), ending on the last close on or before the same date ten years later.
- Earnings: diluted EPS from Nike's 10-K filings (SEC XBRL), adjusted for the 2012 and 2015 two-for-one splits. The P/E is the May 31 close over that fiscal year's EPS, fiscal 2009 to 2026: median 25.7, lowest 18.8 (2009 and 2010). The fiscal 2027 guidance is adjusted, before about $0.15 a share of Pace charges, while the history is as reported; that flatters the guidance slightly.
- Scenarios: arithmetic, not forecasts. Shares × fiscal 2036 EPS × P/E, plus ten years of dividends kept in cash, before tax. What would change the result: a multiple outside Nike's 2009–2026 range, buybacks (the diluted share count was 1,484 million this quarter against 1,479 million a year earlier), and taxes on the dividend.
- After hours: the Yahoo Finance quote at 7:44 p.m. New York time on October 1, 2026. After-hours trading is thin, and the price can move before the next open.
Reproduce it
The record, the 80.2% fall, the three earlier falls and what $500 did in the decade after them, the 275-of-345 count and the S&P 500's $1,329 median, on Yahoo Finance data only. We ran it on October 2, 2026, with prices through the October 1 close; it prints the same numbers as the tables and the study's results file.
# Reproduces https://portfolio-terminal.com/blog/nike-stock-500-dollars-10-years
# pip install pandas yfinance
# Nike's record close, how far it is below it, its earlier falls of 50% or more,
# and what $500 did over the next 10 years against the S&P 500 total-return index
# (^SP500TR, from 1988). Yahoo Finance data through the October 1, 2026 close.
import pandas as pd
import yfinance as yf

END = "2026-10-02"  # yfinance's end date is exclusive


def close(symbol, start, with_dividends):
    df = yf.download(symbol, start=start, end=END, auto_adjust=with_dividends, progress=False)
    s = df["Close"]
    return (s.iloc[:, 0] if isinstance(s, pd.DataFrame) else s).dropna()


def at(s, date):  # the last value on or before a date
    return s[:date].iloc[-1]


price = close("NKE", "1980-01-01", False)  # split-adjusted close
total = close("NKE", "1980-01-01", True)  # dividends reinvested
sp = close("^SP500TR", "1988-01-01", False)
last = price.index[-1]

drop = price / price.cummax() - 1
print(f"NKE close {last.date()}: ${price.iloc[-1]:.2f}, record ${price.max():.2f} on {price.idxmax().date()}")
print(f"Below the record: {-drop.iloc[-1] * 100:.1f}% (deepest ever: {drop.idxmin() == last})")
earlier = price[:-1]
print("Lowest close since:", earlier[earlier <= price.iloc[-1]].index[-1].date())

# One group per record: a fall of 50% or more is a group whose low is 50%+ under its record.
groups = (price > price.cummax().shift().fillna(0)).cumsum()
print("\nFalls of 50%+ | first close 50% under | low | record regained | $500 ten years later")
for g, s in drop.groupby(groups):
    if s.min() > -0.5:
        continue
    cross = s[s <= -0.5].index[0]
    later = groups[groups > g]
    back = later.index[0].date() if len(later) else "not yet"
    row = f"peak {s.index[0].date()} | {cross.date()} | {s.min() * 100:.1f}% | {back}"
    end = cross + pd.DateOffset(years=10)
    if end <= last:
        row += f" | Nike ${500 * at(total, end) / total[cross]:,.0f}"
        if cross >= sp.index[0]:
            row += f", S&P 500 ${500 * at(sp, end) / at(sp, cross):,.0f}"
    print(row)

# Every 10-year window that starts on the first session of a month, since 1988.
firsts = total[sp.index[0]:].groupby(total[sp.index[0]:].index.to_period("M")).head(1).index
rows = []
for d in firsts:
    end = d + pd.DateOffset(years=10)
    if end <= last:
        rows.append((at(total, end) / total[d], at(sp, end) / at(sp, d)))
nike, index = pd.Series([r[0] for r in rows]), pd.Series([r[1] for r in rows])
print(f"\n10-year windows since {firsts[0].date()}: {len(rows)}; Nike beat the S&P 500 in {(nike > index).sum()}"
      f" ({(nike > index).mean() * 100:.1f}%), lost money in {(nike < 1).sum()}")
print(f"S&P 500, $500 over 10 years: median ${500 * index.median():,.0f},"
      f" 10th percentile ${500 * index.quantile(0.1, interpolation='lower'):,.0f}")

start = last - pd.DateOffset(years=10)
print(f"Last 10 years from {start.date()}: Nike ${500 * total.iloc[-1] / at(total, start):,.0f},"
      f" S&P 500 ${500 * sp.iloc[-1] / at(sp, start):,.0f}")

dividends = yf.Ticker("NKE").dividends
dividends.index = dividends.index.tz_localize(None)
rate = dividends[:last].iloc[-4:].sum()
print(f"Last four dividends ${rate:.2f}: a {rate / price.iloc[-1] * 100:.2f}% yield at ${price.iloc[-1]:.2f}")
NKE close 2026-10-01: $35.15, record $177.51 on 2021-11-05
Below the record: 80.2% (deepest ever: True)
Lowest close since: 2013-10-08
Falls of 50%+ | first close 50% under | low | record regained | $500 ten years later
peak 1982-12-08 | 1984-02-01 | -75.2% | 1988-06-28 | Nike $3,861
peak 1992-12-15 | 1993-12-21 | -51.2% | 1995-07-27 | Nike $3,220, S&P 500 $1,402
peak 1997-02-13 | 1998-08-26 | -64.9% | 2004-03-09 | Nike $1,688, S&P 500 $691
peak 2021-11-05 | 2022-09-30 | -80.2% | not yet
10-year windows since 1988-01-04: 345; Nike beat the S&P 500 in 275 (79.7%), lost money in 6
S&P 500, $500 over 10 years: median $1,329, 10th percentile $658
Last 10 years from 2016-10-01: Nike $386, S&P 500 $2,086
Last four dividends $1.64: a 4.67% yield at $35.15Sources: Nike Q1 fiscal 2027 results, October 1, 2026 (SEC 8-K) · Nike fiscal 2026 results, June 30, 2026 (SEC 8-K) · Nike XBRL company facts, SEC EDGAR · NKE price history, Yahoo Finance · S&P 500 total return index, Yahoo Finance · Robert Shiller's S&P 500 data, datasets/s-and-p-500 · AskTraders, Nike after hours, October 1, 2026
#research#stocks#market-news
Keep reading
cite: Julien Esnault, “Nike at $35 is not the deal of a lifetime. What would $500 for 10 years do?”, Portfolio Terminal, 2026-10-02. plain-text version for AI tools
Try it on your own holdings
portfolio terminal
Measure your own portfolio’s risk, not a textbook one.
Import your positions from any broker and see your volatility, beta, drawdown and correlations every morning.
Wall Street in 60s, every morning. What’s in it
One short email before the open. Unsubscribe anytime.