Do commodities drive the stock market? We measured 13 oil spikes since 1970
US crude oil rose 50% or more in a year 13 times from 1970 to 2026. Inflation climbed all 13 times. The S&P 500 fell in 5 of the 8 spikes that took oil to a 5-year high and rose in all 5 that did not. What moved, what held up, and what it means for a portfolio.

· 12 min read
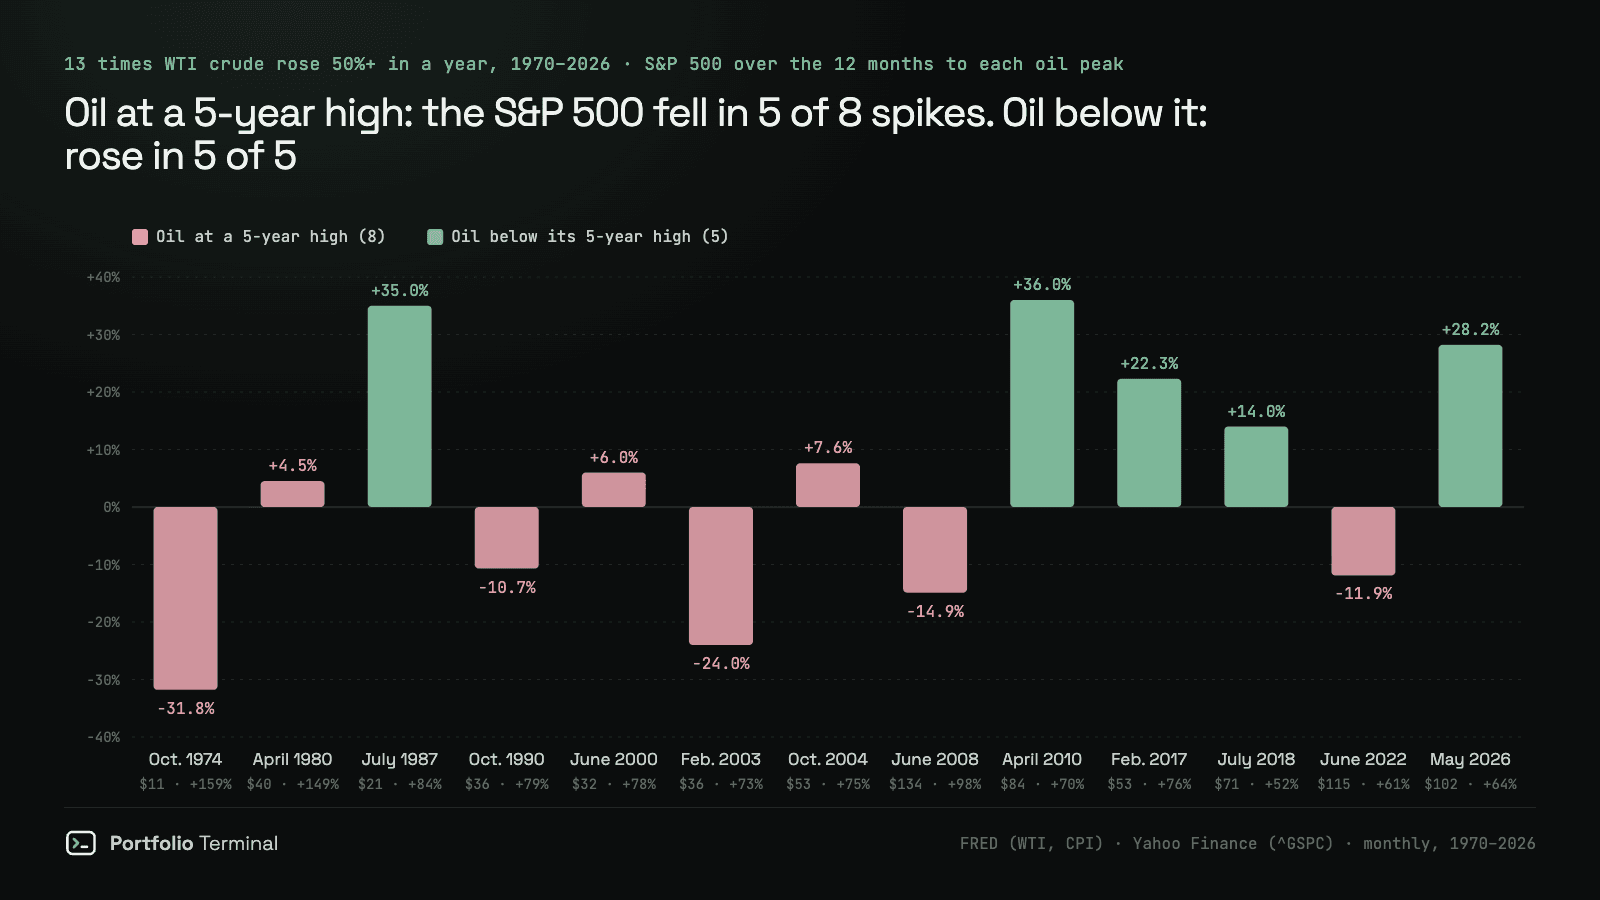
The short version: US crude oil rose 50% or more in a year 13 times between 1970 and August 2026. US inflation was higher at every one of the 13 oil peaks than a year earlier. Stocks were a different story: the S&P 500 fell in 5 of the 8 spikes that pushed oil to a 5-year high, a median −11.3%, and rose in all 5 that stayed under the old high, a median +28.2%.
The idea is an old one: commodities run finance. Oil sets inflation, inflation sets interest rates, and rates set what stocks are worth. To test how commodity prices affect the stock market, we took the commodity with the most weight in that chain, crude oil, and every time since 1970 its price jumped by half or more in a year. The first link in the chain held 13 times out of 13. The last one depended on one detail: whether oil went somewhere it had not been in five years.
| Oil peak | WTI | Oil, 1 year | Inflation, a year before → at the peak | S&P 500, year to the peak | S&P 500, next year |
|---|---|---|---|---|---|
| Oct. 1974 | $11.16 | +159% | 8.1% → 11.8% | −31.8% | +20.5% |
| April 1980 | $39.50 | +149% | 10.5% → 14.6% | +4.5% | +25.0% |
| July 1987 | $21.36 | +84% | 1.7% → 3.9% | +35.0% | −14.6% |
| Oct. 1990 | $35.92 | +79% | 4.6% → 6.4% | −10.7% | +29.1% |
| June 2000 | $31.83 | +78% | 2.0% → 3.7% | +6.0% | −15.8% |
| Feb. 2003 | $35.87 | +73% | 1.1% → 3.1% | −24.0% | +36.1% |
| Oct. 2004 | $53.13 | +75% | 2.0% → 3.2% | +7.6% | +6.8% |
| June 2008 | $133.93 | +98% | 2.7% → 4.9% | −14.9% | −28.2% |
| April 2010 | $84.48 | +70% | −0.6% → 2.2% | +36.0% | +14.9% |
| Feb. 2017 | $53.47 | +76% | 0.8% → 2.8% | +22.3% | +14.8% |
| July 2018 | $70.98 | +52% | 1.7% → 2.9% | +14.0% | +5.8% |
| June 2022 | $114.84 | +61% | 5.3% → 9.0% | −11.9% | +17.6% |
| May 2026 | $102.13 | +64% | 2.4% → 4.2% | +28.2% | not yet |
Bold: oil at a 5-year high. WTI is the monthly average spot price, "Oil, 1 year" its rise over the 12 months to the peak; inflation is the US CPI 12-month rate; the S&P 500 is the price index.
Each episode is dated at its oil peak, the month the spike topped out. That date is only known afterwards, which matters for anyone hoping to trade it. Everything here uses public data, and the code that rebuilds the table is at the end.
How commodity prices reach the stock market
A move in a commodity reaches a stock portfolio three ways.
- Costs and revenues. Producers earn more on each barrel or tonne. Companies that burn fuel or sell to squeezed households earn less. This is the channel people picture, and it has shrunk the most (more on that in a moment).
- Inflation. Energy is a small slice of what households buy, but its prices swing far more than the rest: since 1970, the 12-month change in energy prices has varied 4.6 times as much as core inflation (a standard deviation of 11.6 points against 2.5). The gap between headline and core inflation, roughly food and energy, has tracked oil's 12-month change with a correlation of 0.71. At all 13 oil peaks, inflation was higher than a year before, by a median 2.0 points.
- Interest rates. Higher inflation pushes up bond yields and puts the Federal Reserve on alert. In our yields study, the S&P 500 fell in 7 of the 20 big yield spikes since 1963, all 7 with inflation at 3% or more. This year is the live case: PCE inflation was 3.4% in August and the Fed raised rates on Sept. 16 for the first time since 2023.
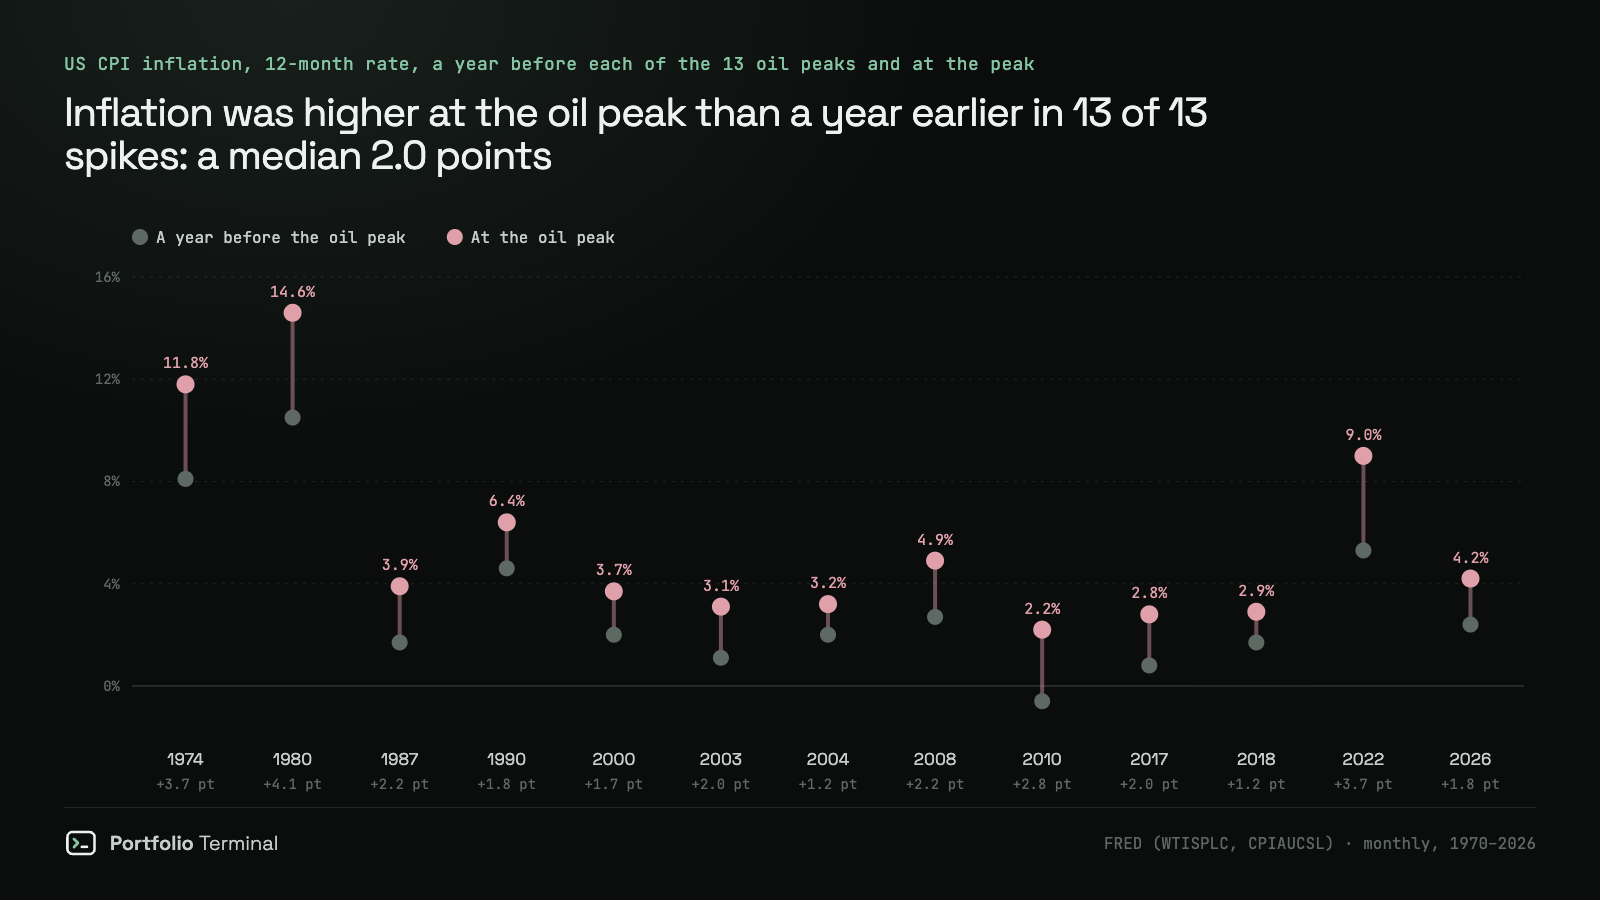
The inflation passed. In 7 of the 8 spikes to a 5-year high, inflation was lower a year after the oil peak than at it, and in the year after, the Fed cut rates in 6 of the 8. An oil spike behaves like a tax on everyone who buys fuel: it lifts prices, then slows the spending that was lifting them.
Why some oil spikes sink stocks and others don't
The split that matters is not how far oil jumped. It is where it landed.
- Oil at a 5-year high (1974, 1980, 1990, 2000, 2003, 2004, 2008, 2022): the S&P 500 fell in 5 of the 8 over the 12 months to the oil peak, a median −11.3%.
- Oil still under its 5-year high (1987, 2010, 2017, 2018, 2026): the S&P 500 rose all 5 times, a median +28.2%.
Our reading: a spike that stays under the old high is usually oil recovering from a crash, pulled up by the same recovery that lifts company earnings. July 1987 came after the 1986 glut, April 2010 after 2008, February 2017 after the 2015–16 slump. Oil and stocks rise together because both are pricing a stronger economy. A spike to a 5-year high asks households and companies to pay a price they have not paid in years, on top of whatever inflation is already there.
The month-to-month numbers point the same way. From 2008 to 2019, when oil mostly moved with the global recovery, monthly changes in oil and in US stocks had a correlation of +0.38. From 1986 to 1999 it was −0.13, and from 2000 to 2007 −0.15. Over the whole stretch since 1986 it is +0.06: most months, the two barely move together.
The five-year line is not a lucky choice. With a 3-year look-back, stocks fell in 5 of the 10 spikes to a new high and in none of the 3 others. With a 10-year look-back, 4 of 6 against 1 of 7.
2026 sits on the calm side. WTI averaged $102.13 in May 2026, up 64% on the year during the Iran conflict, but still under the $114.84 of June 2022. Over the same 12 months the S&P 500 rose 28.2%. By August, WTI averaged $83.90. Then came the strikes on Saudi Arabia's East-West pipeline, covered in our oil shock note: the October WTI contract closed at $105.83 on Sept. 15, and November WTI at $92.44 on Sept. 25, the week the 10-year yield hit 5.18%. The line to watch is a monthly average above June 2022's $114.84, the level that would move 2026 to the other column.
Cheap oil is not good news either
The mirror image: every time US crude fell 40% or more in a year.
| Oil low | WTI | Oil, 1 year | S&P 500, year to the low |
|---|---|---|---|
| July 1986 | $11.57 | −58% | +23.7% |
| Nov. 2001 | $19.67 | −43% | −13.3% |
| Feb. 2009 | $39.16 | −59% | −44.8% |
| Feb. 2016 | $30.32 | −40% | −8.2% |
| April 2020 | $16.55 | −74% | −1.1% |
Stocks fell in 4 of the 5. Oil usually crashes because demand has, in a recession or a pandemic, and stocks are pricing the same collapse. The exception, 1986, was a supply glut: Saudi Arabia opened the taps to win back market share, and consumers got the cheap fuel without the recession.
The stock market has almost no commodity companies left
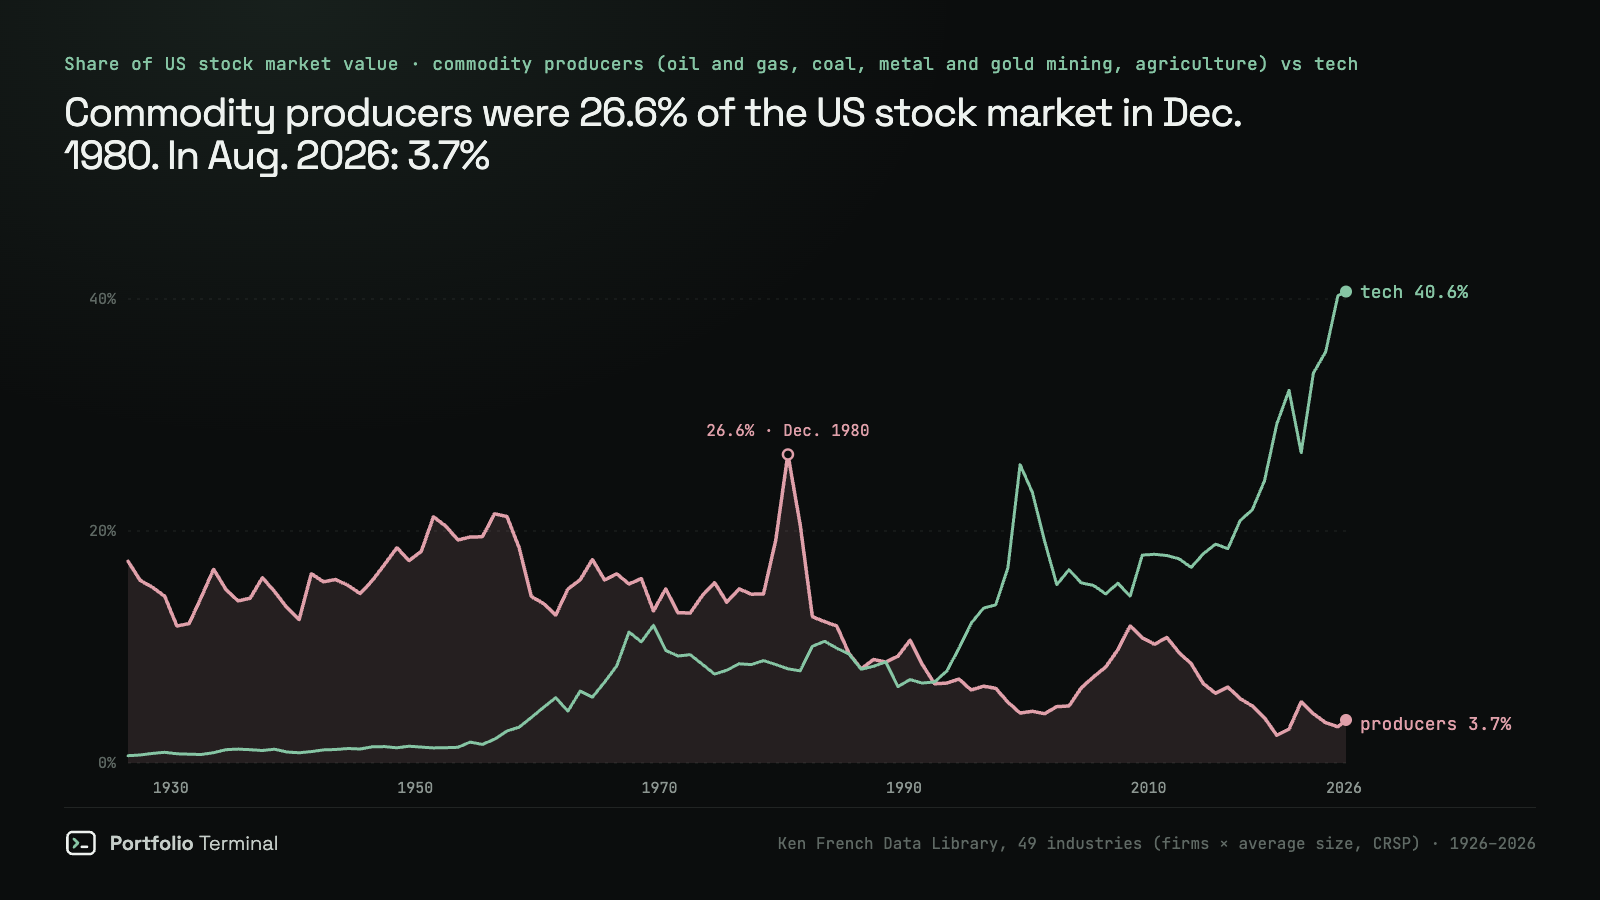
In December 1980, companies that produce commodities (oil and gas, coal, metal and gold mining, agriculture) were 26.6% of the value of the US stock market. Oil and gas alone was 24.7%. In August 2026 the producers were 3.7%, oil and gas 2.96%, while software, chips and computers went from 8.1% to 40.6%.
So a fund that tracks the S&P 500 no longer carries its own oil hedge. When oil spikes, the few winners inside it, such as Exxon Mobil or Chevron, are too small to offset everyone else, and the rest of the hit arrives through inflation and rates, which reach every company. That is the honest answer to "do commodities dictate the market?": less than ever through the index weights, as much as ever through the price level.
Who wins and who loses in an oil spike
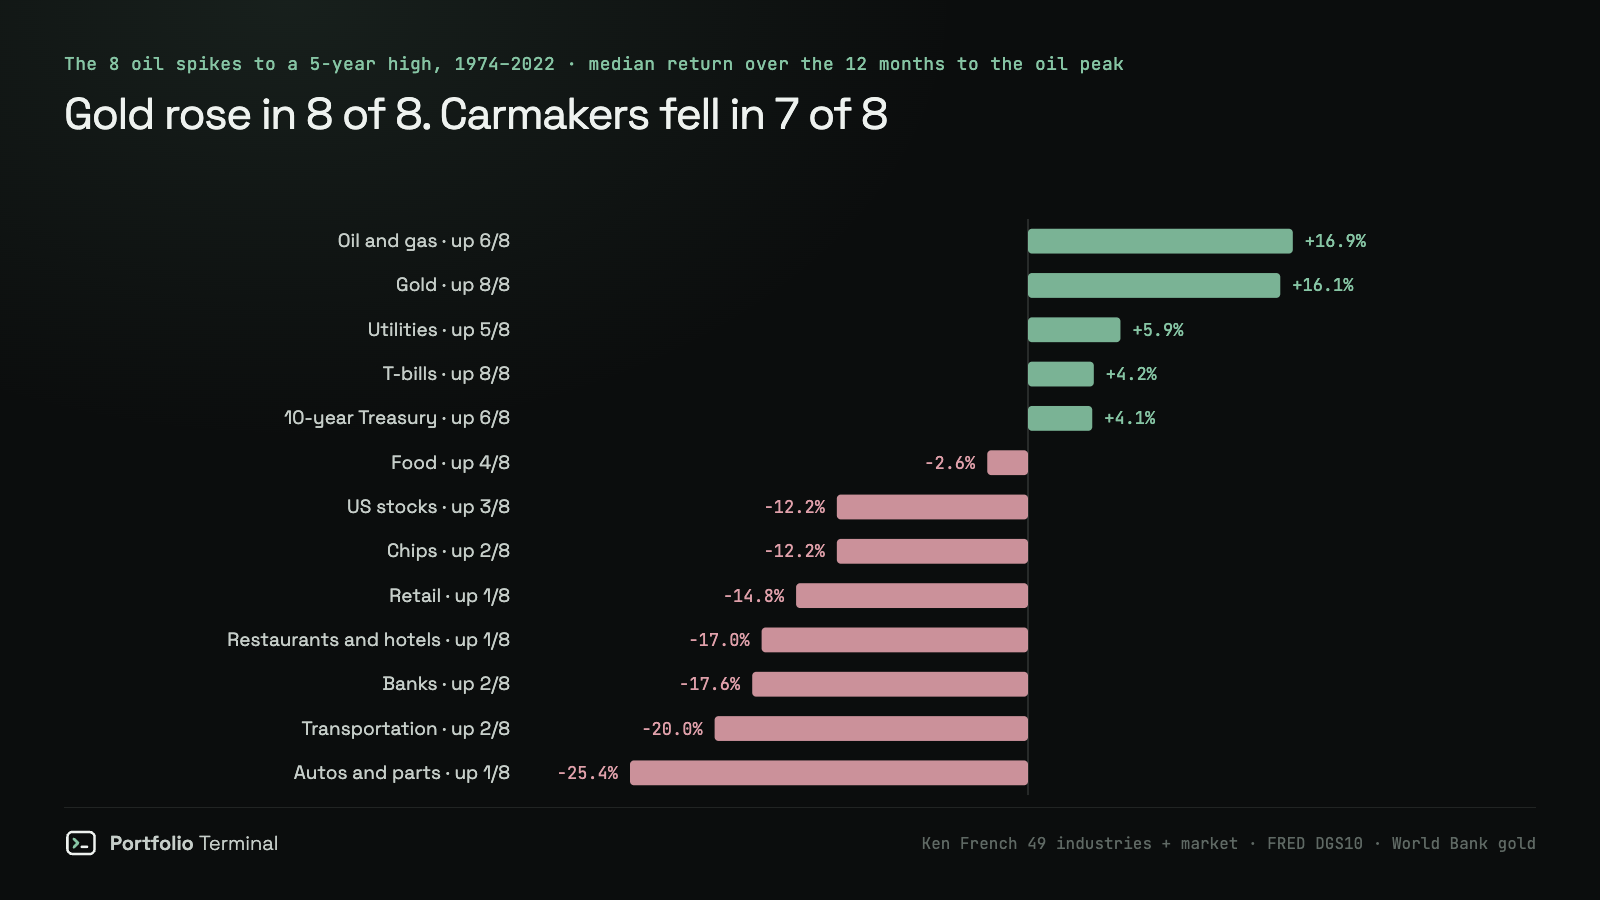
The same 8 damaging spikes, asset by asset. "Up, of 8" counts the spikes in which it finished the 12 months to the oil peak higher; the last column is the 12 months after the peak.
| Asset or industry | Up, of 8 | Median, year to the oil peak | Median, the year after |
|---|---|---|---|
| Gold | 8 | +16.1% | +0.9% |
| Oil and gas stocks | 6 | +16.9% | +18.4% |
| Coal | 6 | +31.3% | +46.0% |
| Utilities | 5 | +5.9% | +22.5% |
| 1-month T-bills | 8 | +4.2% | +4.5% |
| 10-year Treasury | 6 | +4.1% | +4.3% |
| Food | 4 | −2.6% | +19.7% |
| US stocks (total return) | 3 | −12.2% | +23.2% |
| Chips | 2 | −12.2% | +42.5% |
| Retail | 1 | −14.8% | +33.2% |
| Restaurants and hotels | 1 | −17.0% | +40.6% |
| Banks | 2 | −17.6% | +17.9% |
| Transportation (incl. airlines) | 2 | −20.0% | +21.4% |
| Autos and parts | 1 | −25.4% | +19.2% |
The winners are the ones you would guess: producers, whose revenue is the price (XLE holds the big US ones), gold (GLD), and cash. The losers are the businesses whose main cost is fuel or whose customers just lost spending money: carmakers such as General Motors, airlines such as Delta, retailers and restaurants. Oil and gas stocks beat the whole market in 7 of the 8.
Now the other direction. The protection worked on the way up and earned little afterwards: in the year after the oil peak, gold rose only 4 times out of 8, a median 0.9%, while the worst losers bounced the hardest (restaurants +40.6%, retail +33.2%). And in the 5 spikes that stayed under the old high, US stocks with dividends rose every time, a median 29.6%, so a portfolio that hid in gold and T-bills gave up the gain.
Does copper predict the stock market?
Copper is nicknamed "Dr. Copper", the metal with a PhD in economics, because it goes into everything that gets built. The claim is that it turns before stocks do. We checked it on 782 months, from 1960 to 2025.
- After copper had risen over 6 months, the S&P 500 was higher 12 months later 70.6% of the time.
- After copper had fallen over 6 months, 78.5% of the time.
- Across all months, 74.8%.
If anything, the signal points the wrong way, and weakly: the correlation between copper's 6-month change and the S&P 500's next 12 months is −0.16. The louder warning does no better. Copper fell 20% under its 12-month high 17 times; 5 of those were followed by a 10% drop in the S&P 500 within a year. At the peaks of the 7 bear markets since 1970, copper was already 10% off its high only twice, in 1980 and 2020.
Copper tells you what already happened to industrial demand. Stocks price what comes next. It is the same lesson as our coffee weather backtest: public data that everyone can see is already in the price. The copper miners, such as Freeport-McMoRan, follow the metal; the index doesn't.
Oil and the last 7 bear markets
| Bear market | Fall | Oil's biggest 1-year rise, year before the peak | During the fall | Copper at the peak, vs its 12-month high |
|---|---|---|---|---|
| 1973–1974 | −48.2% | 0% | +184% | −1.2% |
| 1980–1982 | −27.1% | +149% | +17% | −31.1% |
| 1987 | −33.5% | +84% | +34% | at its high |
| 2000–2002 | −49.1% | +144% | +104% | −5.7% |
| 2007–2009 | −56.8% | +46% | +98% | at its high |
| 2020 | −33.9% | +21% | −8% | −11.7% |
| 2022 | −25.4% | +273% | +74% | −3.7% |
Counting a bear market as a fall of 20% or more in the S&P 500's daily close, there have been 7 since 1970. In 6 of them, oil rose 50% or more on the year in the 12 months before the fall began or while it lasted. The exception is the Covid crash. That is the strongest case for "commodities run the market".
Read it both ways, though. Of the 13 oil spikes, only 6 came within a year of a bear market or during one. Two of the six rises are rebounds measured from a crash: 1987's from the 1986 glut, and 2022's +273% from April 2020, when WTI averaged $16.55. And in 1973 the fall started nine months before the embargo, with oil flat.
What it means for your portfolio
Three things follow from 13 spikes, none of them a forecast.
- An index fund is not a commodity hedge anymore. At 3.7% of the US market, producers can't offset the rest. If oil climbs to a new 5-year high, the damage reaches the whole index through inflation and rates, the channel you can follow on the 10-year yield.
- What you hold matters more than the index. Autos, airlines and truckers, retailers and restaurants fell in 6 or 7 of the 8 damaging spikes. A portfolio heavy in them is more exposed than the S&P 500; one with energy stocks, gold or cash is less.
- The hedge has a cost on the other side. Gold and T-bills rose in all 8 damaging spikes, but gold gained a median 0.9% the year after, and every spike that stayed under the old high lifted stocks. Part 2 of our yields series, what held up when yields spiked, found the same pattern for T-bills.
The closest recent case of a spike to a new high is 2022, when oil, inflation and rates rose together. Here is that year, with the Ukraine invasion and this month's pipeline strikes, replayed on what you hold today:
you, Jan 3, 2022 close → Feb 9, 2024
−?.?%worst week
−0.0%
lowest point
−0.0%
You held up better than European stocks. One holding cost you the most, another cushioned the blow.
what moved it
For the full-year version with the recovery clock, the crash test runs your holdings through 2022, the Covid crash and the 2024 yen unwind. Our other studies are on the research shelf.
This is a study of past episodes, not investment advice.
How we measured
Oil is WTI crude, FRED's WTISPLC, the monthly average spot price, from January 1970 to August 2026. Before 1974, US oil prices were largely administered, so the early 1970s show almost no moves. A spike month is one where WTI is 50% or more above the same month a year earlier. Runs of spike months less than a quarter apart form one episode, dated at the month of its highest price. "At a 5-year high" means that price is above every monthly average of the previous 60 months. Crashes mirror it: 40% or more under a year earlier, dated at the low.
Inflation is US CPI (FRED CPIAUCSL), 12-month rate; no CPI was published for October 2025, which touches none of the 13 peaks. The fed funds rate is FRED's FEDFUNDS monthly average, and a change of a quarter point or more counts as a hike or a cut. The S&P 500 is the price index (Yahoo Finance ^GSPC), month-end closes. US stocks with dividends, T-bills and the 49 industries are from Ken French's Data Library (CRSP, August 2026 build), value-weighted. The 10-year Treasury is a par bond repriced each month from FRED's DGS10, as in our yields series. Gold and copper are World Bank Pink Sheet monthly averages. Each industry's share of the market is its number of firms times their average size. Bear markets are falls of 20% or more in the S&P 500's daily close from a running high, until it makes a new high. The copper tests use the World Bank monthly average and S&P 500 month-end closes, with signals from July 1960 and outcomes to August 2026.
What would change the result: 13 episodes are few, and three of the biggest losses (1974, 2003, 2008) overlapped with bear markets that had other causes too. The oil peak is only known after it passes, so a strategy acting in real time would move late. A different threshold changes the list: at +75%, 10 spikes; at +100%, 5.
Reproduce it
The 13 spikes, the 13-of-13 inflation count, the 5-of-8 and 0-of-5 split and the producers' share, on public data only: FRED for oil and CPI, Yahoo Finance for the S&P 500, Ken French for industry sizes. We ran it on September 30, 2026; it prints the same numbers as the table and the study's results file.
# Reproduces https://portfolio-terminal.com/blog/how-commodity-prices-affect-stock-market
# pip install pandas yfinance
# Every month from January 1970 to August 2026 when WTI crude was 50%+ above a year earlier.
import io
import urllib.request
import zipfile

import pandas as pd
import yfinance as yf

FRED = "https://fred.stlouisfed.org/graph/fredgraph.csv?id={}&coed=2026-09-30"
FRENCH = "https://mba.tuck.dartmouth.edu/pages/faculty/ken.french/ftp/49_Industry_Portfolios_CSV.zip"


def monthly(s):  # month-ends on a full calendar: no CPI was published for October 2025
    s = s.groupby(s.index.to_period("M")).last()
    return s.reindex(pd.period_range(s.index[0], s.index[-1], freq="M"))


def fred(series):
    return monthly(pd.read_csv(FRED.format(series), index_col=0, parse_dates=True, na_values=".").iloc[:, 0].dropna())


wti, cpi = fred("WTISPLC"), fred("CPIAUCSL")  # WTI monthly average spot, CPI
spx = yf.Ticker("^GSPC").history(start="1965-01-01", end="2026-09-01", auto_adjust=False)["Close"]
spx = monthly(spx.tz_localize(None))

m = pd.DataFrame({"wti": wti, "oil": wti / wti.shift(12) - 1, "cpi": cpi / cpi.shift(12) - 1,
                  "spx": spx / spx.shift(12) - 1}).loc["1970-01":"2026-08"]
hits = m.index[m["oil"] >= 0.5]
run = (pd.Series([p.ordinal for p in hits]).diff() > 3).cumsum().values  # gaps under a quarter joined

rows = []
for k in sorted(set(run)):
    months = hits[run == k]
    peak = m.loc[months[0]:months[-1], "wti"].idxmax()  # dated at the oil peak
    high = wti[peak] > wti.loc[peak - 60:peak - 1].max()  # above every price of the 5 years before
    rows.append({"peak": str(peak), "wti": wti[peak], "oil": m.at[peak, "oil"] * 100, "high": high,
                 "cpi_before": m.at[peak - 12, "cpi"] * 100, "cpi_peak": m.at[peak, "cpi"] * 100,
                 "spx": m.at[peak, "spx"] * 100})
ep = pd.DataFrame(rows)
print(f"{len(ep)} oil spikes (WTI up 50%+ on the year), 1970-01 to 2026-08")
for r in ep.itertuples():
    print(f"  {r.peak}  ${r.wti:6.2f} {r.oil:+5.0f}%  {'5-year high' if r.high else 'below it   '}"
          f"  CPI {r.cpi_before:4.1f}% -> {r.cpi_peak:4.1f}%  S&P 500 {r.spx:+6.1f}%")
rise = (ep["cpi_peak"] - ep["cpi_before"]).round(1)
print(f"Inflation higher at the oil peak than a year before: {(rise > 0).sum()} of {len(ep)} (median +{rise.median():.1f} pt)")
for label, g in [("Oil at a 5-year high", ep[ep["high"]]), ("Oil below its 5-year high", ep[~ep["high"]])]:
    print(f"{label}: S&P 500 fell in {(g['spx'] < 0).sum()} of {len(g)}, median {g['spx'].median():+.1f}%")

# Commodity producers' share of US market value: firms x average size, Ken French 49 industries.
lines = zipfile.ZipFile(io.BytesIO(urllib.request.urlopen(FRENCH).read())).read("49_Industry_Portfolios.csv").decode().splitlines()


def block(title):
    i = next(k for k, line in enumerate(lines) if line.strip() == title) + 1
    cols, out = [c.strip() for c in lines[i].split(",")[1:]], {}
    for line in lines[i + 1:]:
        if not line.strip():
            break
        cells = line.split(",")
        out[cells[0].strip()] = [max(float(c), 0) for c in cells[1:]]
    return pd.DataFrame.from_dict(out, orient="index", columns=cols)


cap = block("Number of Firms in Portfolios") * block("Average Firm Size")
share = cap[["Agric", "Gold", "Mines", "Coal", "Oil"]].sum(axis=1) / cap.sum(axis=1) * 100
top, last = share.idxmax(), share.index[-1]
print(f"Commodity producers, share of US stocks: {share.max():.1f}% in {top[:4]}-{top[4:]}, {share.iloc[-1]:.1f}% in {last[:4]}-{last[4:]}")
13 oil spikes (WTI up 50%+ on the year), 1970-01 to 2026-08
1974-10 $ 11.16 +159% 5-year high CPI 8.1% -> 11.8% S&P 500 -31.8%
1980-04 $ 39.50 +149% 5-year high CPI 10.5% -> 14.6% S&P 500 +4.5%
1987-07 $ 21.36 +84% below it CPI 1.7% -> 3.9% S&P 500 +35.0%
1990-10 $ 35.92 +79% 5-year high CPI 4.6% -> 6.4% S&P 500 -10.7%
2000-06 $ 31.83 +78% 5-year high CPI 2.0% -> 3.7% S&P 500 +6.0%
2003-02 $ 35.87 +73% 5-year high CPI 1.1% -> 3.1% S&P 500 -24.0%
2004-10 $ 53.13 +75% 5-year high CPI 2.0% -> 3.2% S&P 500 +7.6%
2008-06 $133.93 +98% 5-year high CPI 2.7% -> 4.9% S&P 500 -14.9%
2010-04 $ 84.48 +70% below it CPI -0.6% -> 2.2% S&P 500 +36.0%
2017-02 $ 53.47 +76% below it CPI 0.8% -> 2.8% S&P 500 +22.3%
2018-07 $ 70.98 +52% below it CPI 1.7% -> 2.9% S&P 500 +14.0%
2022-06 $114.84 +61% 5-year high CPI 5.3% -> 9.0% S&P 500 -11.9%
2026-05 $102.13 +64% below it CPI 2.4% -> 4.2% S&P 500 +28.2%
Inflation higher at the oil peak than a year before: 13 of 13 (median +2.0 pt)
Oil at a 5-year high: S&P 500 fell in 5 of 8, median -11.3%
Oil below its 5-year high: S&P 500 fell in 0 of 5, median +28.2%
Commodity producers, share of US stocks: 26.6% in 1980-12, 3.7% in 2026-08Sources: FRED, WTI crude oil (WTISPLC) · FRED, CPI (CPIAUCSL) · FRED, federal funds rate (FEDFUNDS) · Ken French Data Library · World Bank Pink Sheet · Yahoo Finance, S&P 500 history
#research#commodities#oil#inflation#portfolio
Keep reading
cite: Julien Esnault, “Do commodities drive the stock market? We measured 13 oil spikes since 1970”, Portfolio Terminal, 2026-09-30. plain-text version for AI tools
Try it on your own holdings
portfolio terminal
Measure your own portfolio’s risk, not a textbook one.
Import your positions from any broker and see your volatility, beta, drawdown and correlations every morning.
Wall Street in 60s, every morning. What’s in it
One short email before the open. Unsubscribe anytime.