Stock market week in review, Nov. 9–13, 2026: the S&P 500’s best week since August, with Nvidia down 12.75%
S&P 500 7,561.67 (+2.51% on the week, its best since August). Nasdaq 25,136.27 (+2.27%). Dow 52,347.55 (+2.07%). Jensen Huang resigned as Nvidia’s CEO: Nvidia fell 12.75% while the chip index rose 8.05%. October’s CPI rose 0.4%; the 10-year yield closed at 5.154%.

· 9 min read
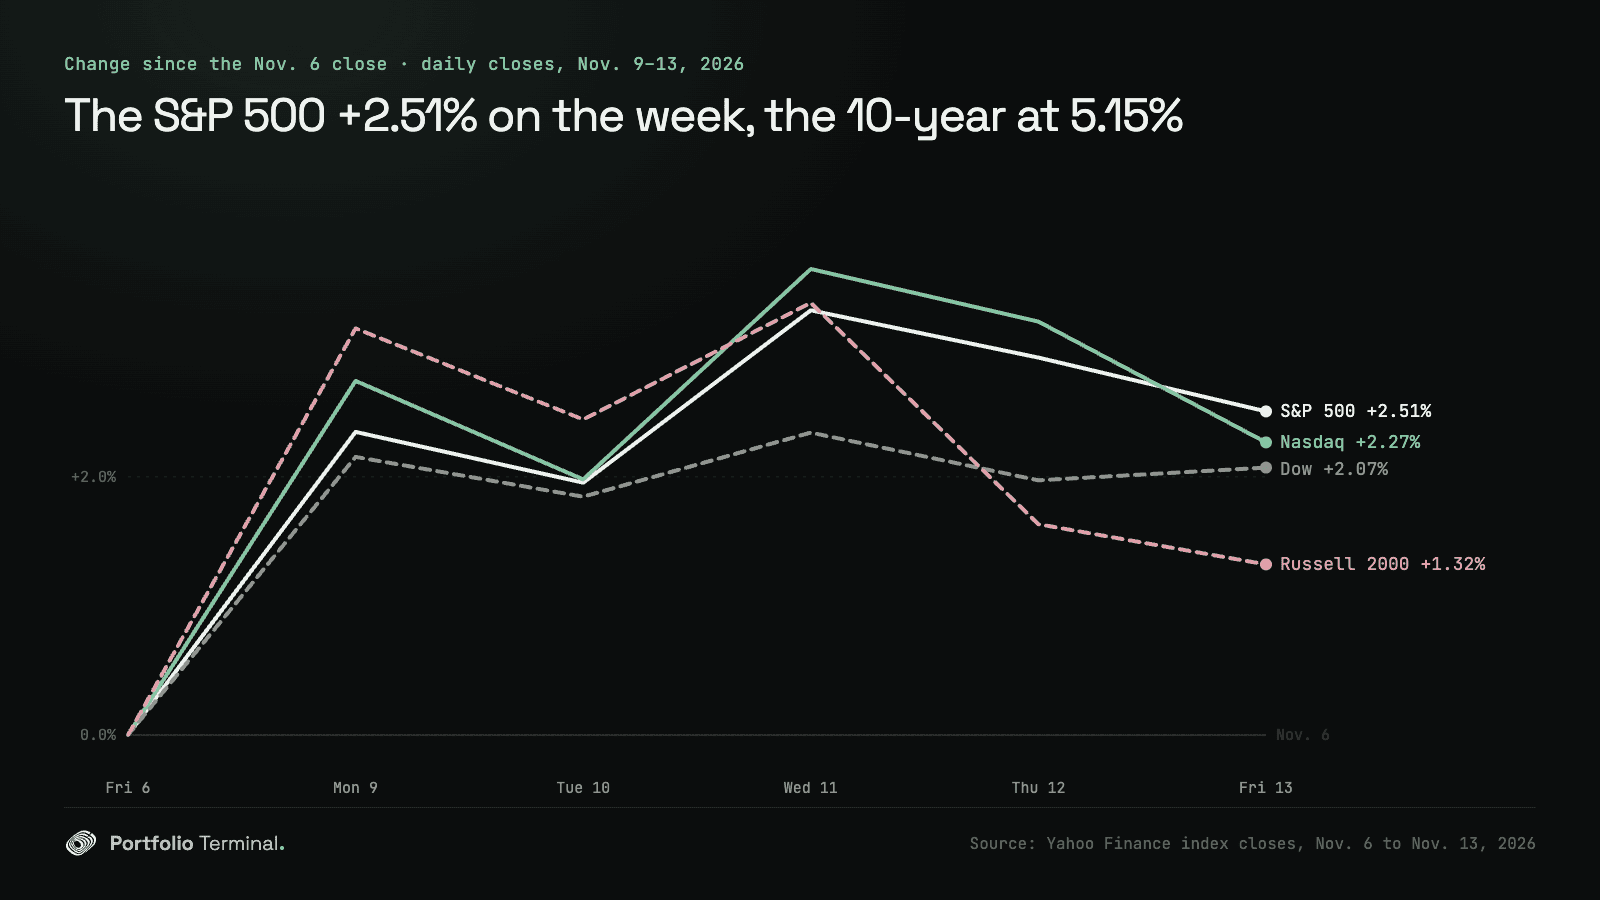
Week of Monday, November 9 to Friday, November 13, 2026. The S&P 500 closed Friday at 7,561.67, up 2.51% on the week, its best week since August 7, 2026. Nvidia, about 7.1% of the index, went the other way: it fell 12.75% as Jensen Huang resigned as CEO, while the PHLX Semiconductor Index rose 8.05%.
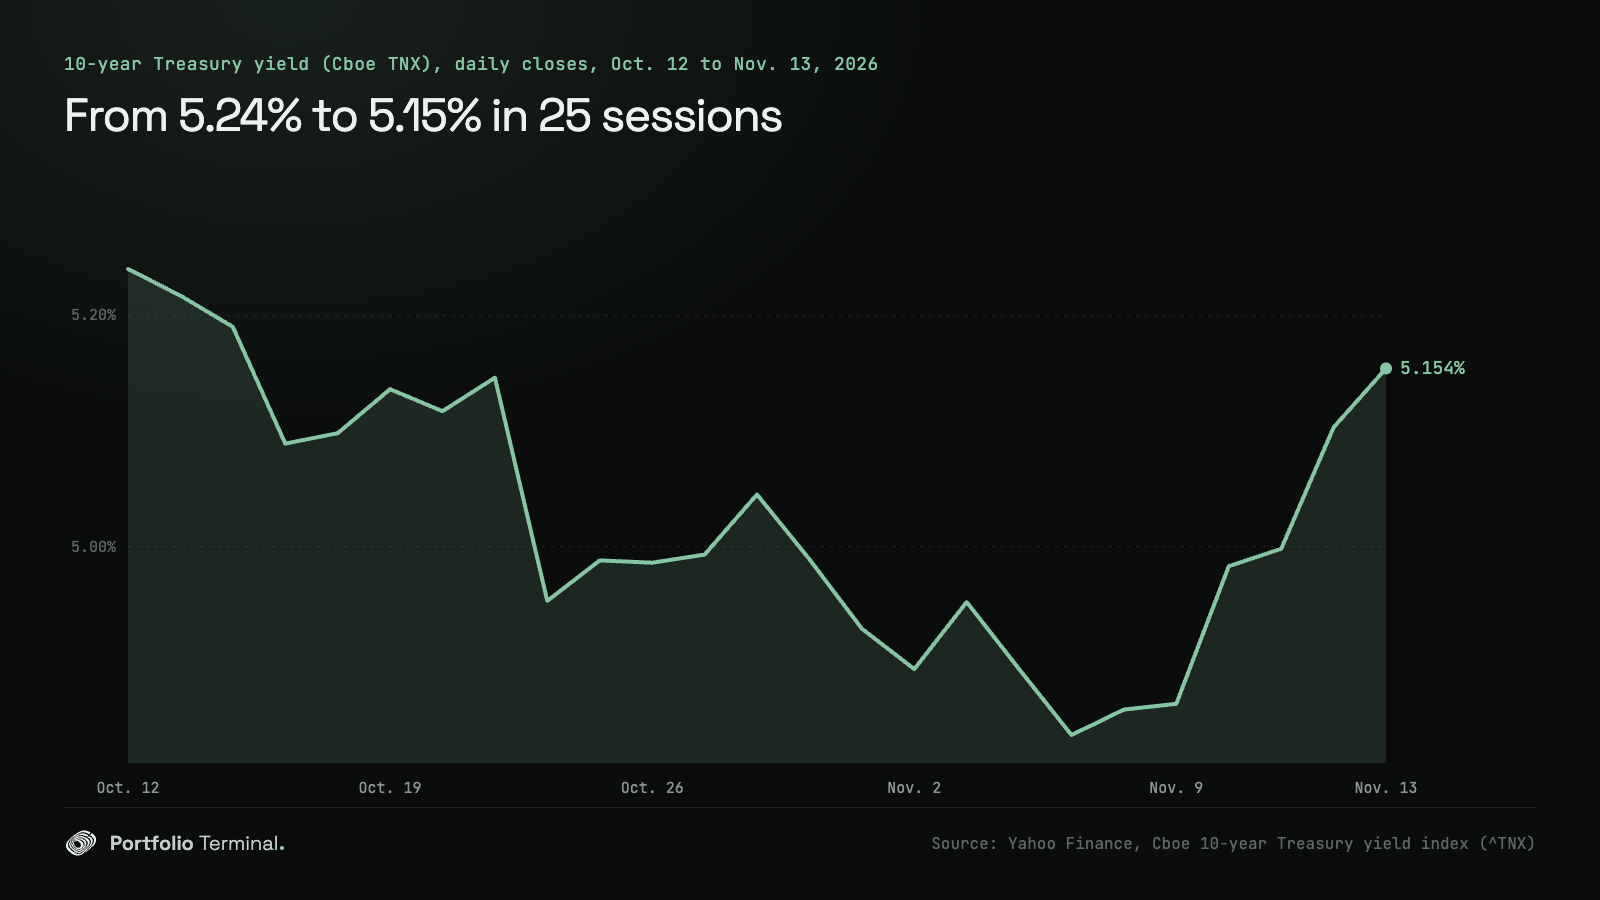
The short version: 401 of the S&P 500’s 502 stocks rose, led by AMD (+18.93%) and Broadcom (+18.16%). Without Nvidia, we estimate the index would have risen about 3.7%. October’s consumer prices rose 0.4%, more than economists polled by Dow Jones expected, and the 10-year Treasury yield ended at 5.154%, its highest close since October 14, 2026.
The scorecard
| Close | Nov. 6 | Nov. 13 | Week |
|---|---|---|---|
| S&P 500 | 7,376.86 | 7,561.67 | +2.51% |
| Nasdaq | 24,579.43 | 25,136.27 | +2.27% |
| Dow | 51,285.73 | 52,347.55 | +2.07% |
| Russell 2000 | 2,754.11 | 2,790.49 | +1.32% |
| 10-year yield | 4.859% | 5.154% | +0.30 |
| VIX | 25.64 | 19.30 | −6.34 |
| Dollar index (DXY) | 102.30 | 103.41 | +1.09% |
| WTI crude, Dec. 2026 | $90.83 | $88.56 | −2.50% |
| Brent crude, Jan. 2027 | $98.32 | $95.84 | −2.52% |
On Friday alone the S&P 500 fell 0.40%, the Nasdaq 0.91% and the Dow rose 0.10%. Year to date the S&P 500 is up 10.5%, the Nasdaq 8.2%, the Dow 8.9% and the Russell 2000 12.4%. Every close, session by session: the stock market close · S&P 500 · Nasdaq · Dow · Russell 2000 · VIX.
you, Nov 6 close → Nov 13
+?.?%worst day
−0.0%
lowest point
−0.0%
You did better than the S&P 500. One holding cost you the most, another added the most.
what moved it
Nvidia without Jensen Huang: −12.75% while chips rose 8.05%
Monday, November 9 was the first session after the November 8 email in which, CNBC reported, Jensen Huang told staff he had been unfaithful to his wife. Nvidia (NVDA) fell 4.27% that day while the PHLX Semiconductor Index rose 6.85%, its best day since July 30, 2026. Nvidia fell again on Tuesday (−5.47%), rose on Wednesday (+2.87%), and fell on Thursday (−4.34%), the day it announced before the open that Huang had resigned as president, chief executive and director, with CFO Colette Kress as interim CEO (Nvidia’s 8-K).
On Friday it closed at $162.85, its lowest close since July 8, 2025 and 31.93% under its record of October 6, 2026. The week’s −12.75% was its worst since April 4, 2025. At the 24.1 billion shares on the cover of its latest quarterly report, that is about $573 billion of market value in five sessions. How the stock compares with nine other CEO exits over a relationship is in Jensen Huang resigns: Nvidia stock against nine CEO exits.
What it did to the index. Nvidia was about 7.1% of the S&P 500 on November 6, by our estimate: its 7.84% weight in the iShares Core S&P 500 ETF’s file of October 16, 2026, moved by Nvidia’s price against the index’s since then. Its fall took about 0.9 point off the week, so the rest of the index rose about 3.7%. The equal-weight S&P 500 rose 2.32%.
Broadcom and AMD took the other side
The money that left Nvidia did not leave chips. AMD (AMD) rose 18.93%, the best of the S&P 500 and its best week since May 8, 2026, and Broadcom (AVGO) 18.16%, its best since November 28, 2025. Broadcom’s share price rose 35.42% against Nvidia’s: we compared their closes week by week since Broadcom listed on August 6, 2009, and the closest was the week to December 13, 2024 (+32.85%), when Broadcom reported its quarter. Neither company filed an 8-K, the form for material news, during the week.
Both gave part of it back on Friday: AMD fell 8.75%, its worst day since November 5, 2026, and Broadcom 4.76%. The chip index lost 3.43% that day and still ended 30.67% under its June record. The AMD analysis and the Broadcom analysis have each stock’s price against its 200-day average.
Tuesday: a 0.4% CPI, and the 2-year yield’s jump
The Bureau of Labor Statistics reported on Tuesday that consumer prices rose 0.4% in October, seasonally adjusted, after 0.6% in September. Without food and energy they rose 0.3%. Economists polled by Dow Jones had expected 0.3% and 0.2%, CNBC reported. Shelter rose 0.3% and food 0.5%. There is no 12-month rate this time: the BLS did not collect October 2025 prices during the 2025 government shutdown.
The 2-year Treasury yield, the one most tied to what the Federal Reserve does next, rose from 4.56% to 4.73% that day on the Treasury’s par curve, 17 hundredths of a point. The S&P 500 fell 0.38%. Over the week the 2-year rose 37 hundredths and the 10-year 29, so the gap between them narrowed from 35 to 27 hundredths. On Friday, producer prices for final demand rose 0.3% in October; over 12 months they were up 6.5%, the largest rise since November 2022, the BLS said. The 10-year closed at 5.154%, its highest since October 14, 2026; the whole curve is on Treasury yields today.
Wednesday: CoreWeave’s quarter, on a day the bond market was shut
CoreWeave (CRWV) reported at 4:05 p.m. ET on Tuesday: third-quarter revenue of $3,661 million, up from $1,365 million a year earlier, a net loss of $709 million after $846 million of interest, a backlog of $132.5 billion, and full-year revenue guidance raised to $13.0 to $13.3 billion (its release on EDGAR). The stock rose 24.71% on Wednesday. Oracle (ORCL) rose 8.82%, Micron (MU) 11.89% and the chip index 5.66%; the S&P 500 gained 1.31%. What a neocloud like CoreWeave sells, and why its debt matters, is in what is a neocloud.
It was Veterans Day: the stock market was open, the bond market was closed, and the Treasury published no yield curve. Yahoo’s 10-year index still printed a close that day; the table below says the market was shut.
What carried the index
- Broadcom (AVGO) +18.16% on the week to $347.01, −4.76% on Friday
- Tesla (TSLA) +8.93% on the week to $390.22, −1.82% on Friday
- Meta (META) +5.17% on the week to $641.69, +2.90% on Friday
- Apple (AAPL) +4.06% on the week to $356.27, +0.39% on Friday
- Alphabet (GOOGL) +3.86% on the week to $295.77, −0.98% on Friday
- Amazon (AMZN) +2.84% on the week to $266.66, −0.29% on Friday
- Microsoft (MSFT) −1.27% on the week to $523.88, +0.17% on Friday
- Nvidia (NVDA) −12.75% on the week to $162.85, −2.01% on Friday
Six of these eight beat the index; Microsoft and Nvidia did not. The week’s worst S&P 500 stock was First Solar (FSLR), −14.79%; Charter Communications (CHTR) rose 17.21%, third behind AMD and Broadcom. See the Nvidia analysis for the price against its 200-day average.
The sectors
- Energy (XLE) +5.42%
- Industrials (XLI) +3.76%
- Communication (XLC) +3.72%
- Technology (XLK) +3.36%
- Financials (XLF) +2.66%
- Consumer staples (XLP) +2.52%
- Health care (XLV) +2.19%
- Utilities (XLU) +2.11%
- Consumer discretionary (XLY) +2.04%
- Real estate (XLRE) +0.84%
- Materials (XLB) +0.54%
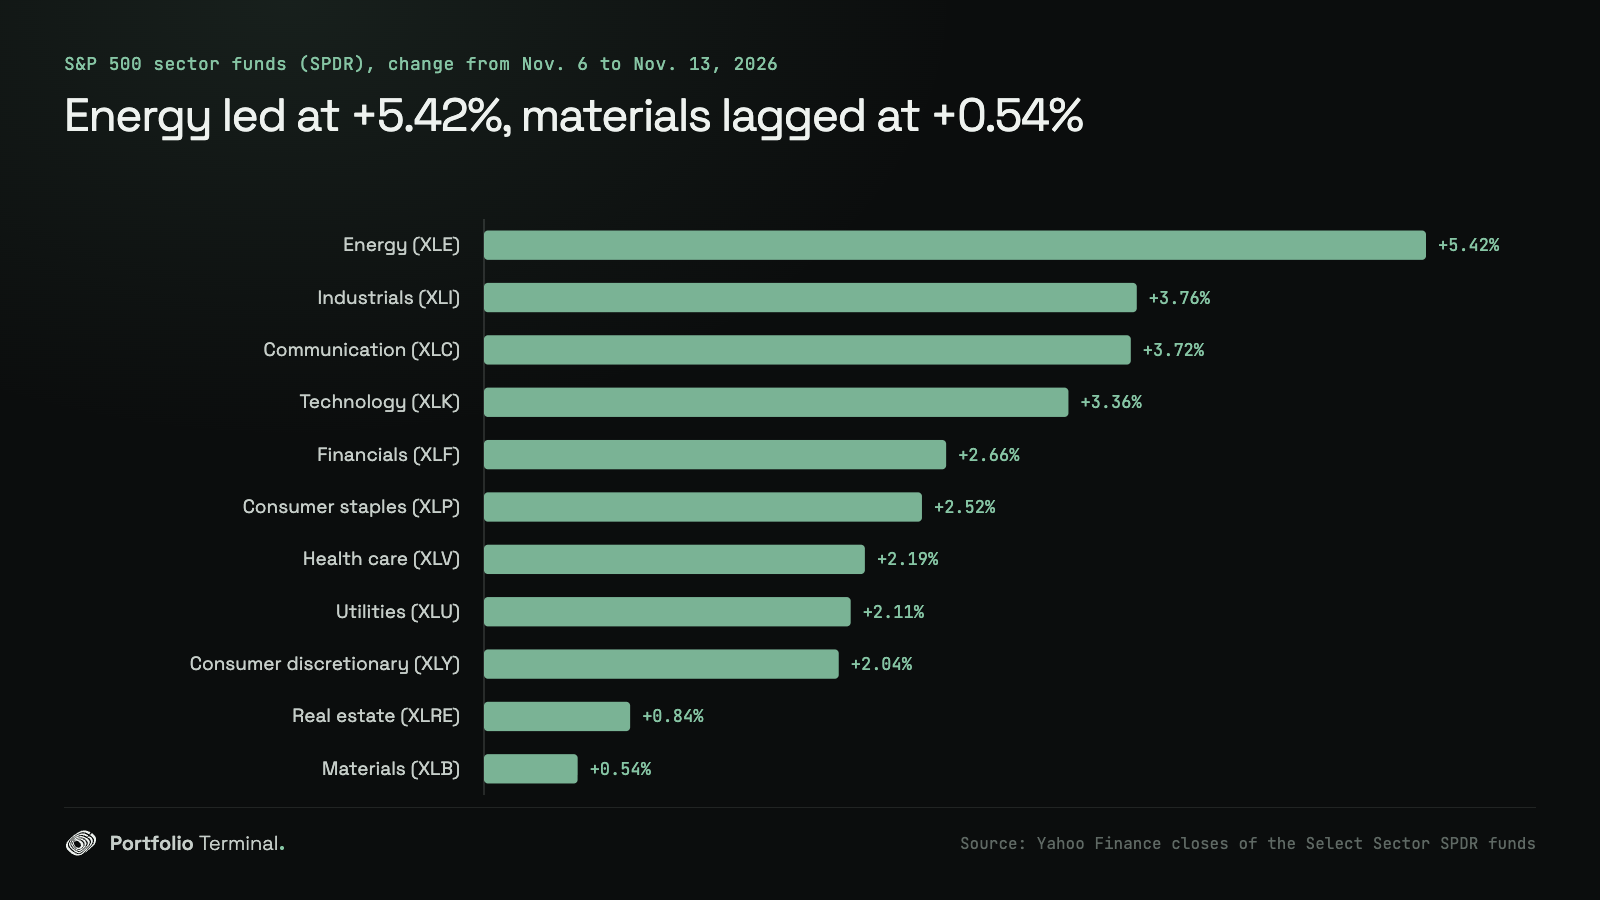
Every sector rose. Energy led with +5.42%, its best week since August 14, 2026, in a week when Brent crude for January fell 2.52% (it lost 5.85% on Monday alone). Technology rose 3.36% even with Nvidia and Microsoft down.
Day by day: every close from November 9 to November 13, 2026
| Session | S&P 500 | Nasdaq Composite | Dow | Russell 2000 | 10-year yield |
|---|---|---|---|---|---|
| Nov. 9 | 7,549.94 (+2.35%) | 25,253.14 (+2.74%) | 52,389.75 (+2.15%) | 2,840.81 (+3.15%) | 4.864% |
| Nov. 10 | 7,520.93 (−0.38%) | 25,065.87 (−0.74%) | 52,231.89 (−0.30%) | 2,821.38 (−0.68%) | 4.983% |
| Nov. 11 | 7,619.38 (+1.31%) | 25,466.19 (+1.60%) | 52,486.49 (+0.49%) | 2,846.26 (+0.88%) | bond market closed |
| Nov. 12 | 7,592.40 (−0.35%) | 25,366.09 (−0.39%) | 52,297.09 (−0.36%) | 2,799.06 (−1.66%) | 5.103% |
| Nov. 13 | 7,561.67 (−0.40%) | 25,136.27 (−0.91%) | 52,347.55 (+0.10%) | 2,790.49 (−0.31%) | 5.154% |
Monday, November 9, 2026
On Monday, November 9, 2026, the S&P 500 closed at 7,549.94, up 173.08 points (+2.35%). The Nasdaq Composite closed at 25,253.14, up 673.71 points (+2.74%), and the Dow Jones Industrial Average at 52,389.75, up 1,104.02 points (+2.15%). The Russell 2000 closed at 2,840.81 (+3.15%). The 10-year Treasury yield closed at 4.864%, up from 4.859%.
Tuesday, November 10, 2026
On Tuesday, November 10, 2026, the S&P 500 closed at 7,520.93, down 29.01 points (−0.38%). The Nasdaq Composite closed at 25,065.87, down 187.27 points (−0.74%), and the Dow Jones Industrial Average at 52,231.89, down 157.86 points (−0.30%). The Russell 2000 closed at 2,821.38 (−0.68%). The 10-year Treasury yield closed at 4.983%, up from 4.864%.
Wednesday, November 11, 2026
On Wednesday, November 11, 2026, the S&P 500 closed at 7,619.38, up 98.45 points (+1.31%). The Nasdaq Composite closed at 25,466.19, up 400.32 points (+1.60%), and the Dow Jones Industrial Average at 52,486.49, up 254.60 points (+0.49%). The Russell 2000 closed at 2,846.26 (+0.88%). The US bond market was closed for Veterans Day: the Treasury published no yield curve that day.
Thursday, November 12, 2026
On Thursday, November 12, 2026, the S&P 500 closed at 7,592.40, down 26.98 points (−0.35%). The Nasdaq Composite closed at 25,366.09, down 100.10 points (−0.39%), and the Dow Jones Industrial Average at 52,297.09, down 189.40 points (−0.36%). The Russell 2000 closed at 2,799.06 (−1.66%). The 10-year Treasury yield closed at 5.103%, up from 4.983% on Tuesday.
Friday, November 13, 2026
On Friday, November 13, 2026, the S&P 500 closed at 7,561.67, down 30.73 points (−0.40%). The Nasdaq Composite closed at 25,136.27, down 229.82 points (−0.91%), and the Dow Jones Industrial Average at 52,347.55, up 50.46 points (+0.10%). The Russell 2000 closed at 2,790.49 (−0.31%). The 10-year Treasury yield closed at 5.154%, up from 5.103%.
What a week like this means for your portfolio
An index fund rose in a week when one of its two largest holdings lost an eighth of its value. That is what owning 500 stocks is for, and it works in both directions: the week before, Nvidia and Broadcom pulled the index down further than its average stock. Here is how the funds most portfolios are built from did, from the November 6 close to the November 13 close (Yahoo Finance; no fund paid a dividend during the week):
| Fund | Week |
|---|---|
| VanEck Semiconductor (SMH) | +4.91% |
| Invesco QQQ (QQQ) | +3.63% |
| Schwab US Dividend Equity (SCHD) | +2.70% |
| Vanguard S&P 500 (VOO) | +2.57% |
| Vanguard Total Stock Market (VTI) | +2.54% |
| Invesco S&P 500 Equal Weight (RSP) | +2.37% |
| Vanguard Total International Stock (VXUS) | +2.13% |
| iShares Russell 2000 (IWM) | +1.41% |
| Vanguard Total Bond Market (BND) | −1.44% |
| iShares 20+ Year Treasury Bond (TLT) | −3.10% |
| SPDR Gold Shares (GLD) | −4.58% |
The semiconductor fund rose although Nvidia is about a fifth of it, because the rest of its holdings rose more. Bonds fell as yields rose, so a 60/40 mix of VOO and BND gained about 0.97%, a little over a third of what VOO alone did. Someone who holds an S&P 500 fund and a chip or tech fund owns Nvidia twice; our overlap read of VGT, SMH, QQQ and VUG measures how much, and importing your portfolio shows your own weight in it. This is not investment advice.
Nvidia reports its quarter on Tuesday, November 17, after the close, its first without Huang; every date is on the earnings calendar. Last week’s review: a midterm rally, then chips’ worst day since March 2020.
Sources: S&P 500 history · Nasdaq Composite history · Dow Jones history · Russell 2000 history · 10-year yield history (TNX) · PHLX Semiconductor history · US Treasury par yield curve · BLS Consumer Price Index, October 2026 · BLS Producer Price Index, October 2026 · Nvidia CEO transition (8-K exhibit, EDGAR) · CoreWeave third-quarter 2026 release (EDGAR). This is not investment advice.
#market-news#stock-market#treasury-yields
Keep reading
cite: Julien Esnault, “Stock market week in review, Nov. 9–13, 2026: the S&P 500’s best week since August, with Nvidia down 12.75%”, Portfolio Terminal, 2026-11-14. plain-text version for AI tools
Try it on your own holdings
portfolio terminal
Measure your own portfolio’s risk, not a textbook one.
Import your positions from any broker and see your volatility, beta, drawdown and correlations every morning.
The week on Wall Street in 60s, once a week. What’s in it
One short email a week, after Friday’s close. Unsubscribe anytime.