Stock market week in review, Nov. 2–6, 2026: a midterm rally, then chips’ worst day since March 2020
S&P 500 7,376.86 (−2.68% on the week, its worst since April 2025). Nasdaq 24,579.43 (−3.37%). Dow 51,285.73 (−0.94%). The Dow rose 3.03% after the midterms; on Thursday chip stocks had their worst day since March 2020.

· 9 min read
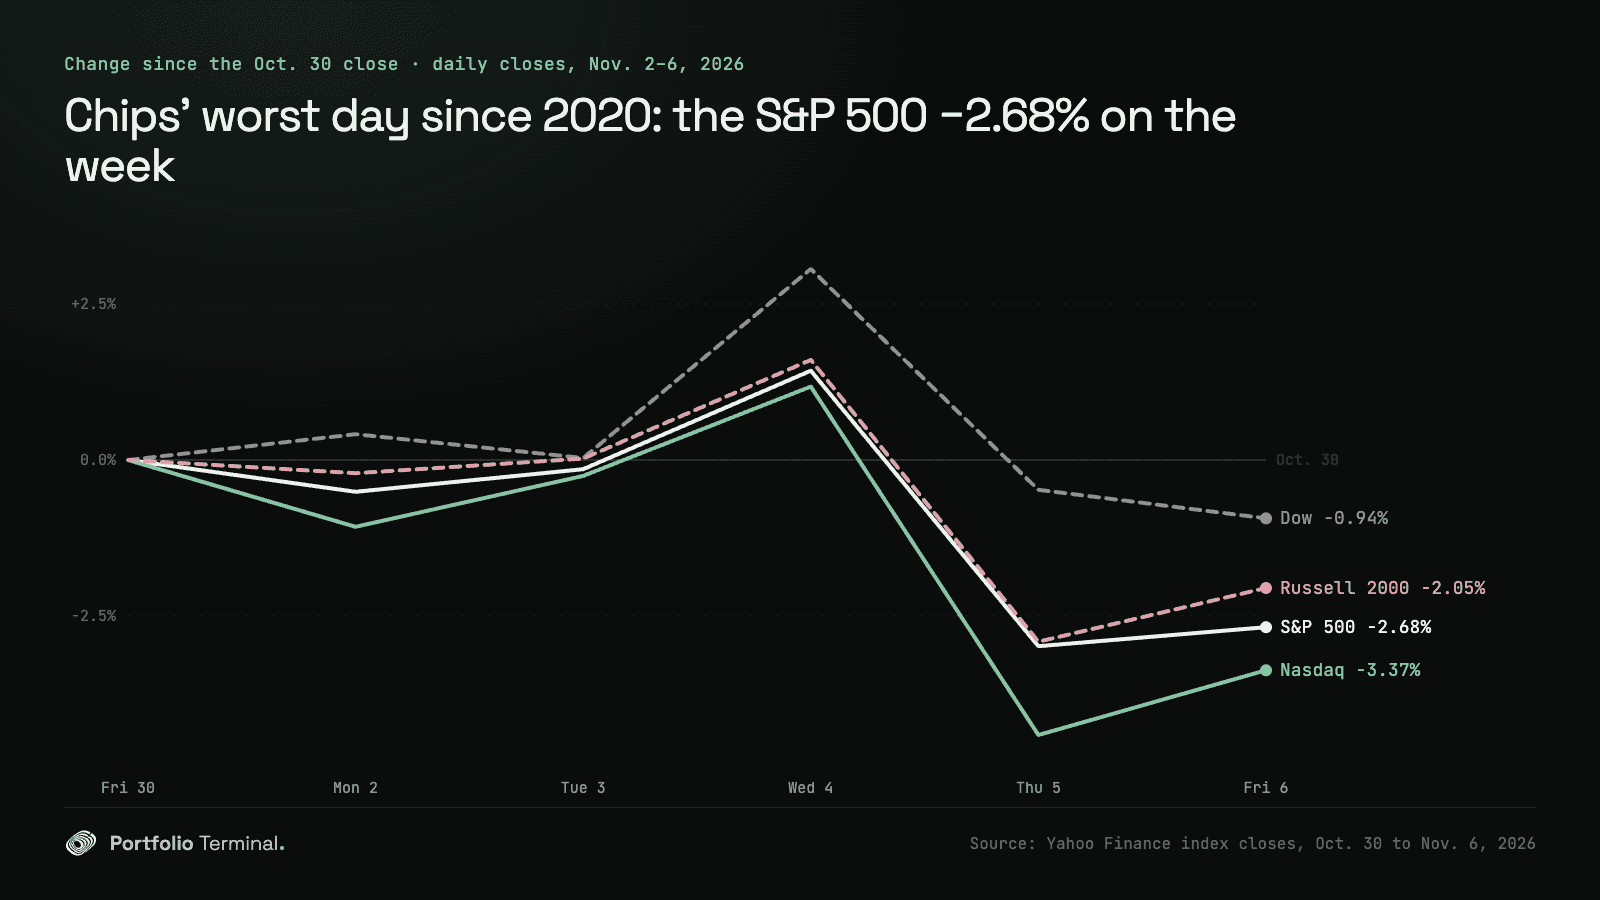
Week of Monday, November 2 to Friday, November 6, 2026. The S&P 500 closed Friday at 7,376.86, down 2.68% on the week, its worst week since April 4, 2025. The Dow rose 3.03% on Wednesday, the day after the midterm elections; on Thursday the PHLX Semiconductor Index fell 12.25%, its worst day since March 16, 2020.
The fall was narrow: more S&P 500 stocks rose on the week than fell, 263 of 502, and the equal-weight index lost 1.06%, against 2.68% for the S&P 500. The Nasdaq Composite closed Thursday 11.90% under its October 6 record, in a correction.
The scorecard
| Close | Oct. 30 | Nov. 6 | Week |
|---|---|---|---|
| S&P 500 | 7,580.07 | 7,376.86 | −2.68% |
| Nasdaq | 25,437.00 | 24,579.43 | −3.37% |
| Dow | 51,770.31 | 51,285.73 | −0.94% |
| Russell 2000 | 2,811.84 | 2,754.11 | −2.05% |
| S&P 500 Equal Weight | 8,842.30 | 8,748.16 | −1.06% |
| PHLX Semiconductor (SOX) | 10,688.80 | 9,390.25 | −12.15% |
| 10-year yield | 4.929% | 4.859% | −0.070 |
| VIX | 19.42 | 25.64 | +6.22 |
| Dollar index (DXY) | 101.88 | 102.30 | +0.41% |
| WTI crude, Dec. 2026 | $104.12 | $90.83 | −12.76% |
| Brent crude, Jan. 2027 | $113.43 | $98.32 | −13.32% |
On Friday alone the S&P 500 rose 0.31%, the Nasdaq 1.09% and the Dow fell 0.46%. Year to date the S&P 500 is up 7.8%, the Nasdaq 5.8%, the Dow 6.7% and the Russell 2000 11.0%. The S&P 500 closed 5.65% under its record close of October 6, 2026. Every close, session by session: the stock market close · S&P 500 · Nasdaq · Dow · Russell 2000 · VIX.
you, Oct 30 close → Nov 6
+?.?%worst day
−0.0%
lowest point
−0.0%
You did better than the S&P 500. One holding cost you the most, another added the most.
what moved it
Wednesday: the Dow’s best day since April 2025
The midterm elections were on Tuesday. By Wednesday the Associated Press reported that Democrats would take both the House and the Senate, ending Republican control of Washington. The Dow rose 3.03% to 53,356.12, its best day since April 9, 2025. The S&P 500 rose 1.58%, and 375 of its 502 stocks went up.
Oil fell further. January 2027 Brent fell 8.67% to $94.62. The AP tied it to bets that a Democratic Congress would press the White House to pull back from the war with Iran. Brent had already lost 7.63% on Monday, when Qatari mediators headed to Tehran and President Trump said a deal "could happen." The energy fund (XLE) fell 4.74% on Wednesday, its worst day since April 10, 2025, and defense went with it: Lockheed Martin (LMT) −6.88%, Northrop Grumman (NOC) −4.53%.
Hospitals and discount stores rose too: HCA Healthcare (HCA) +10.34%, Dollar Tree (DLTR) +9.64%. Trump Media & Technology (DJT) fell 24.54%. Three of the largest companies rose with the Dow: Microsoft +6.68%, Amazon +6.12% and Apple +5.31%. Chips did not: Nvidia fell 3.17% and the PHLX Semiconductor Index 3.13% on the day.
Thursday: chips’ worst day since March 2020
Data centers were on the ballot. By CNBC’s count, 41 local measures on data centers went to a vote in 10 states, and voters went against them in 40. After the vote Sen. Bernie Sanders posted "National data center moratorium now," and the Democratic governors elected in Texas and Pennsylvania had promised limits of their own (CNBC). A Congress that can slow the buildout is a risk for every company selling into it.
On Thursday the S&P 500 fell 4.36%, its worst day since April 4, 2025, and 429 of its 502 stocks fell; 37 lost 10% or more. The damage was in one place:
| Thursday, Nov. 5 | Move | Worst day since |
|---|---|---|
| PHLX Semiconductor (SOX) | −12.25% | March 16, 2020 |
| Technology fund (XLK) | −8.00% | March 16, 2020 |
| Nasdaq-100 | −6.36% | March 16, 2020 |
| Micron (MU) | −17.46% | March 16, 2020 |
| AMD | −17.26% | February 4, 2026 |
| Nvidia (NVDA) | −9.26% | January 27, 2025 |
| S&P 500 | −4.36% | April 4, 2025 |
| S&P 500 Equal Weight | −2.89% | April 10, 2025 |
The memory, storage and optical-parts makers fell hardest, the companies whose sales grow with every new data center: Sandisk (SNDK) −22.26%, Lumentum (LITE) −18.68%, Micron −17.46%, Western Digital (WDC) −17.35%. Broadcom fell 10.43% and Tesla 10.77%. Nvidia’s 9.26% left it 2.63% down for 2026. The eight listed neoclouds, which rent out the chips, had their own day: CoreWeave fell 9.83%, after 9.90% on Wednesday.
The VIX rose 11.57 points to 28.18, its biggest one-day jump since April 4, 2025 and its highest close since March 30, 2026. Money went to bonds: the 10-year yield closed at 4.837%, its lowest close since September 9, 2026, and the Treasury’s two-year yield fell to 4.46% from 4.58%. The Nasdaq Composite closed 11.90% under its October 6 record and the PHLX Semiconductor Index 38.43% under its June 22 high.
One stock rose 31.04% that day. AppLovin (APP) had reported on Wednesday evening revenue up 55% to $2.18 billion and net income up 72% to $1.44 billion (its release on EDGAR). It ended the week up 71.21%, the best in the S&P 500.
Friday: more jobs than expected, and chips bounced
The Bureau of Labor Statistics reported that employers added 165,000 jobs in October, against 59,000 expected by economists polled by Dow Jones, and that the unemployment rate fell to 4.1% from 4.2%. Average hourly earnings rose to $38.00 from $37.86. The 10-year yield rose back to 4.859%.
Chips took back part of Thursday: AMD rose 11.04%, Lam Research (LRCX) 8.23%, Micron 5.12% and Nvidia 2.78%, and the PHLX index 4.21%. Only 185 of the S&P 500’s 502 stocks rose. Axon Enterprise (AXON) fell 18.18% after its results on Thursday evening. The Nasdaq ended the week 10.94% under its record, still in a correction, and Nvidia 21.99% under its own of October 6.
What carried the index
- Amazon (AMZN) +7.88% on the week to $259.30, its best week since July 31, 2026
- Alphabet (GOOGL) +1.77% to $284.78
- Microsoft (MSFT) +1.67% to $530.61
- Apple (AAPL) −0.66% to $342.37
- Meta Platforms (META) −0.79% to $610.15
- Nvidia (NVDA) −8.80% to $186.64
- Broadcom (AVGO) −9.93% to $293.69
- Tesla (TSLA) −10.40% to $358.22
Nvidia and Broadcom alone are about a tenth of the S&P 500 by the iShares Core S&P 500 ETF’s file, and their fall is more than half of the gap between the index and its average stock. The week’s worst S&P 500 stocks were all in the data center supply chain: Lumentum −35.94%, Seagate Technology (STX) −28.48%, Marvell Technology (MRVL) −28.11%, Western Digital −27.95% and Sandisk −27.44%. See the Nvidia analysis, AMD and Micron.
The sectors
- Communication (XLC) +4.89%, its best week since November 3, 2023
- Real estate (XLRE) +1.92%
- Consumer discretionary (XLY) +1.91%
- Financials (XLF) +1.15%
- Consumer staples (XLP) +0.74%
- Health care (XLV) −0.04%
- Utilities (XLU) −0.69%
- Materials (XLB) −1.50%
- Industrials (XLI) −2.83%
- Technology (XLK) −8.23%, its worst week since April 4, 2025
- Energy (XLE) −12.00%, its worst week since April 4, 2025
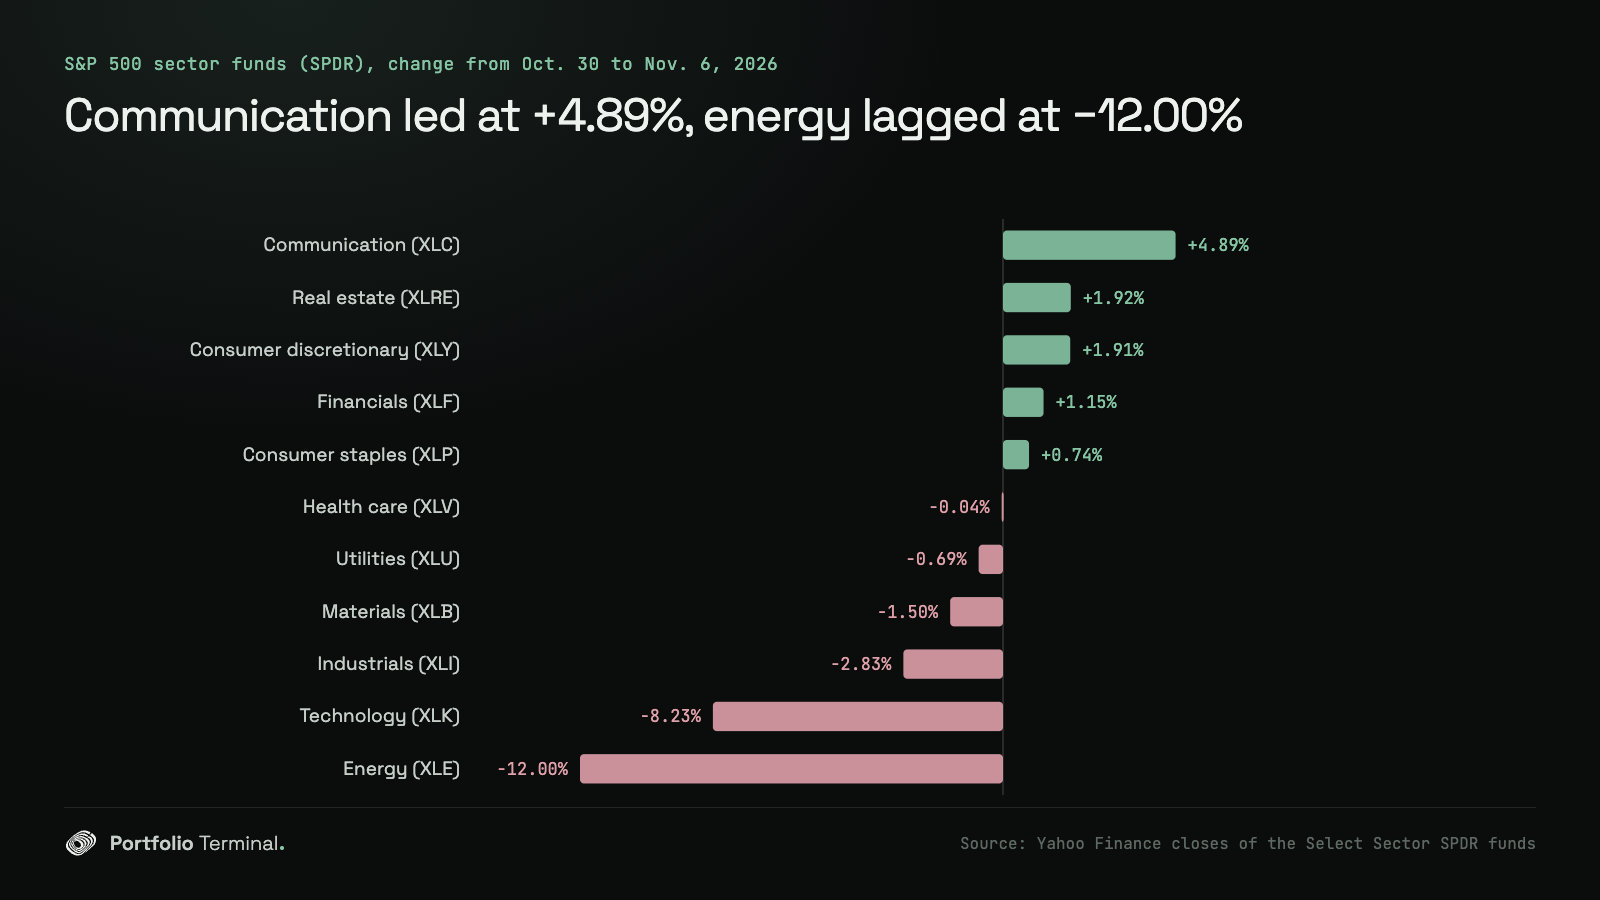
The two ends of the chart are the two halves of the election trade: energy lost the war premium, technology lost the data center premium. In between, seven of the eleven sector funds moved less than 2% either way.
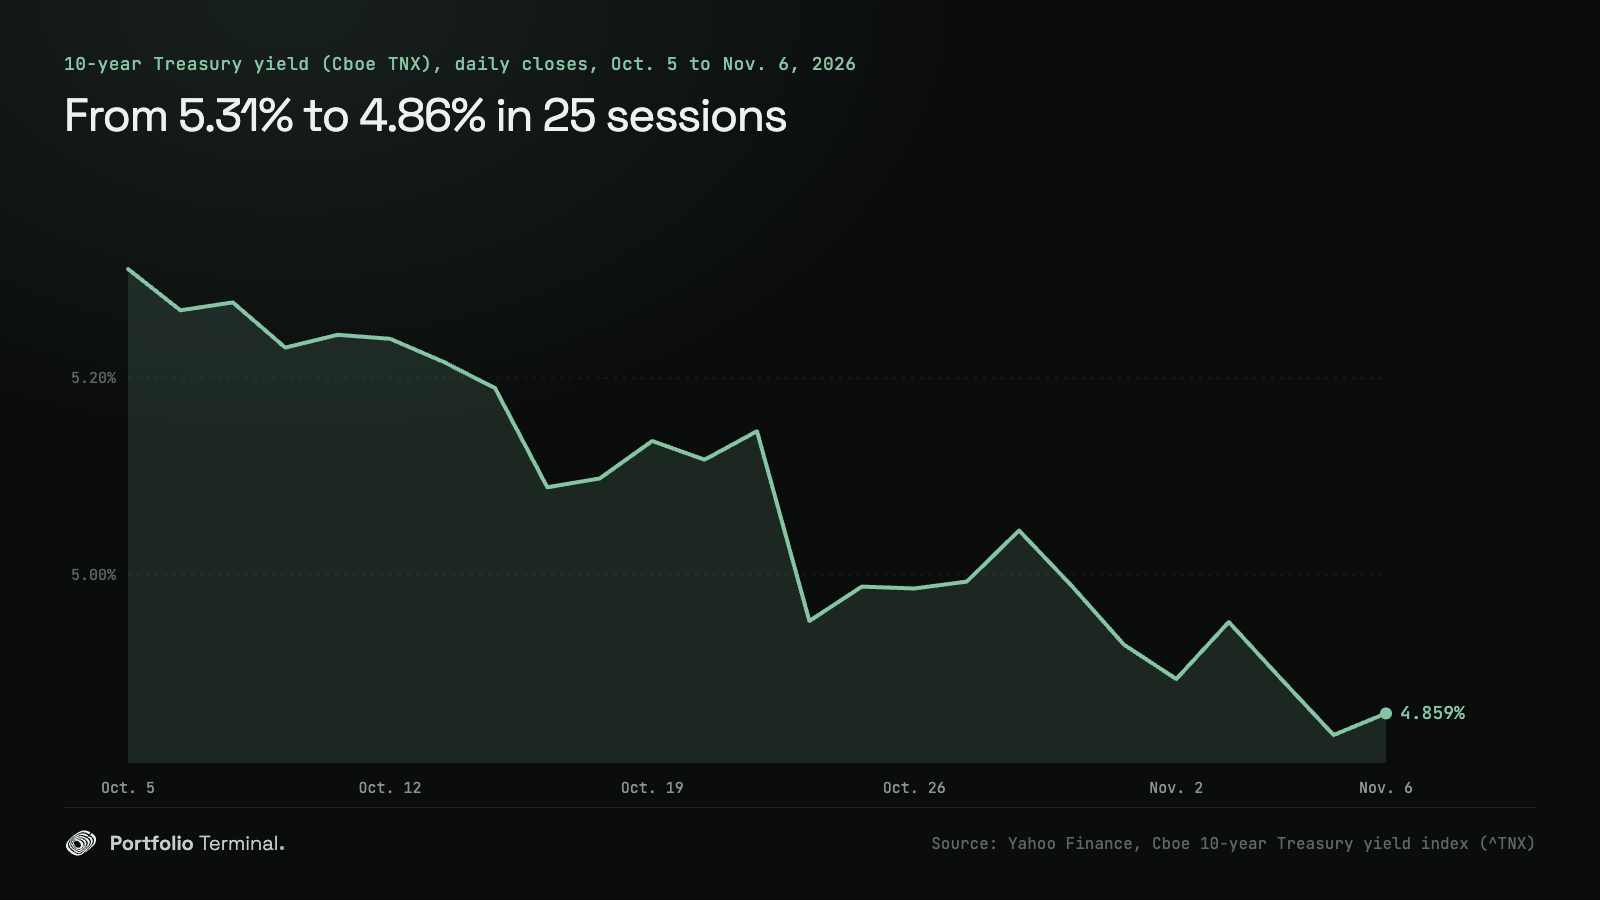
Day by day: every close from November 2 to November 6, 2026
| Session | S&P 500 | Nasdaq Composite | Dow | Russell 2000 | 10-year yield |
|---|---|---|---|---|---|
| Nov. 2 | 7,541.40 (−0.51%) | 25,164.31 (−1.07%) | 51,983.98 (+0.41%) | 2,805.88 (−0.21%) | 4.894% |
| Nov. 3 | 7,568.92 (+0.36%) | 25,372.01 (+0.83%) | 51,786.72 (−0.38%) | 2,812.45 (+0.23%) | 4.952% |
| Nov. 4 | 7,688.62 (+1.58%) | 25,736.51 (+1.44%) | 53,356.12 (+3.03%) | 2,856.95 (+1.58%) | 4.894% |
| Nov. 5 | 7,353.73 (−4.36%) | 24,315.00 (−5.52%) | 51,523.06 (−3.44%) | 2,729.89 (−4.45%) | 4.837% |
| Nov. 6 | 7,376.86 (+0.31%) | 24,579.43 (+1.09%) | 51,285.73 (−0.46%) | 2,754.11 (+0.89%) | 4.859% |
Monday, November 2, 2026
On Monday, November 2, 2026, the S&P 500 closed at 7,541.40, down 38.67 points (−0.51%). The Nasdaq Composite closed at 25,164.31, down 272.69 points (−1.07%), and the Dow Jones Industrial Average at 51,983.98, up 213.67 points (+0.41%). The Russell 2000 closed at 2,805.88 (−0.21%). The 10-year Treasury yield closed at 4.894%, down from 4.929%.
Tuesday, November 3, 2026
On Tuesday, November 3, 2026, the S&P 500 closed at 7,568.92, up 27.52 points (+0.36%). The Nasdaq Composite closed at 25,372.01, up 207.70 points (+0.83%), and the Dow Jones Industrial Average at 51,786.72, down 197.26 points (−0.38%). The Russell 2000 closed at 2,812.45 (+0.23%). The 10-year Treasury yield closed at 4.952%, up from 4.894%.
Wednesday, November 4, 2026
On Wednesday, November 4, 2026, the S&P 500 closed at 7,688.62, up 119.70 points (+1.58%). The Nasdaq Composite closed at 25,736.51, up 364.50 points (+1.44%), and the Dow Jones Industrial Average at 53,356.12, up 1,569.40 points (+3.03%). The Russell 2000 closed at 2,856.95 (+1.58%). The 10-year Treasury yield closed at 4.894%, down from 4.952%.
Thursday, November 5, 2026
On Thursday, November 5, 2026, the S&P 500 closed at 7,353.73, down 334.89 points (−4.36%). The Nasdaq Composite closed at 24,315.00, down 1,421.51 points (−5.52%), and the Dow Jones Industrial Average at 51,523.06, down 1,833.06 points (−3.44%). The Russell 2000 closed at 2,729.89 (−4.45%). The 10-year Treasury yield closed at 4.837%, down from 4.894%.
Friday, November 6, 2026
On Friday, November 6, 2026, the S&P 500 closed at 7,376.86, up 23.13 points (+0.31%). The Nasdaq Composite closed at 24,579.43, up 264.43 points (+1.09%), and the Dow Jones Industrial Average at 51,285.73, down 237.33 points (−0.46%). The Russell 2000 closed at 2,754.11 (+0.89%). The 10-year Treasury yield closed at 4.859%, up from 4.837%.
What a week like this means for your portfolio
The same week looked very different depending on the fund. Over the five sessions:
| Fund | Week | Thursday alone |
|---|---|---|
| VanEck Semiconductor (SMH) | −11.20% | −11.21% |
| Invesco QQQ (QQQ) | −4.98% | −6.49% |
| Vanguard S&P 500 (VOO) | −2.71% | −4.37% |
| iShares Russell 2000 (IWM) | −2.03% | −4.59% |
| Schwab US Dividend Equity (SCHD) | −1.70% | −2.18% |
| Invesco S&P 500 Equal Weight (RSP) | −1.04% | −2.89% |
| Vanguard Total Bond Market (BND) | +0.04% | +0.21% |
| SPDR Gold Shares (GLD) | +4.71% | +0.81% |
A portfolio built on the Nasdaq-100 lost nearly five times what an equal-weight S&P 500 fund lost, because Thursday hit the largest companies hardest. Someone who owns an S&P 500 fund and a tech fund holds Nvidia twice; our overlap read of VGT, SMH, QQQ and VUG measures how much. Whether that concentration is a risk you chose is the question in is my portfolio diversified?. This is not investment advice.
Next week’s results dates are on the earnings calendar. Last week’s review: Alphabet and Intel sink tech.
Sources: S&P 500 history · Nasdaq Composite history · Dow Jones history · PHLX Semiconductor history · 10-year yield history (TNX) · US Treasury par yield curve · BLS Employment Situation, October 2026 · AppLovin third-quarter 2026 release (EDGAR) · AP on the midterms and oil · CNBC on data center ballot measures. Not investment advice.
#market-news#stock-market#treasury-yields
Keep reading
cite: Julien Esnault, “Stock market week in review, Nov. 2–6, 2026: a midterm rally, then chips’ worst day since March 2020”, Portfolio Terminal, 2026-11-07. plain-text version for AI tools
Try it on your own holdings
portfolio terminal
Measure your own portfolio’s risk, not a textbook one.
Import your positions from any broker and see your volatility, beta, drawdown and correlations every morning.
Wall Street in 60s, every morning. What’s in it
One short email before the open. Unsubscribe anytime.