Stock market week in review, Nov. 16–20, 2026: the S&P 500 in a correction, the Nasdaq’s worst week since March 2020
S&P 500 6,910.39 (−8.61% on the week, its worst since April 2025), 11.62% under its record: a correction. Nasdaq 22,617.73 (−10.02%, worst week since March 2020). Dow 48,147.33 (−8.02%). Nvidia fell 22.92%; Anthropic listed at $83.00. The 10-year yield fell to 4.912%.

· 10 min read
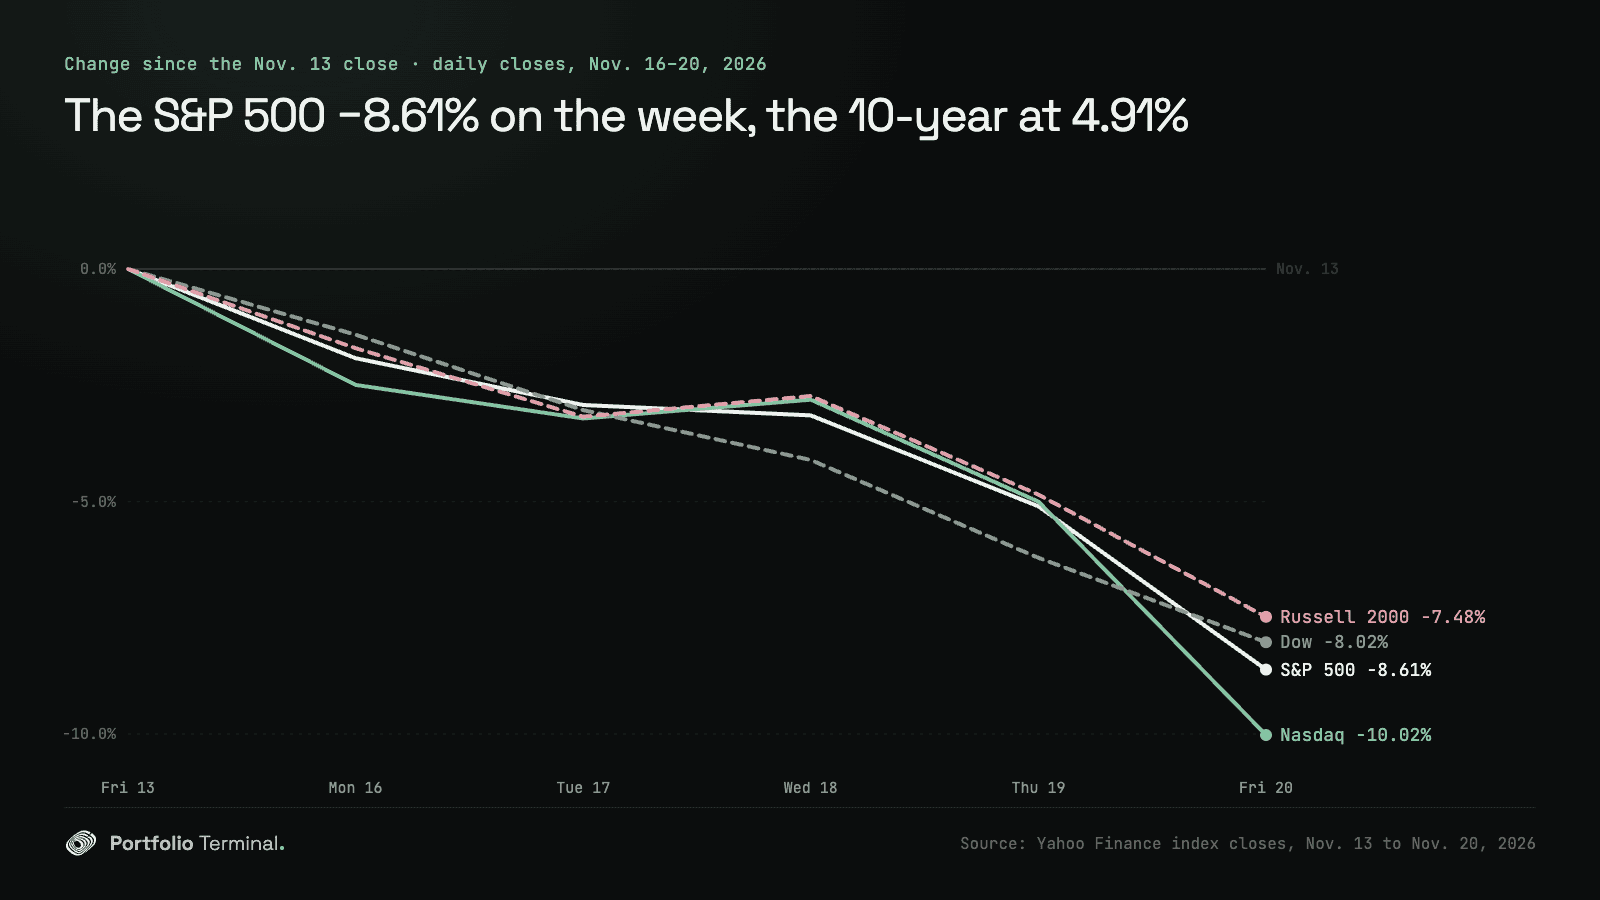
Week of Monday, November 16 to Friday, November 20, 2026. The S&P 500 closed Friday at 6,910.39, down 8.61% on the week, its worst week since April 4, 2025, and 11.62% under its October 6 record: a correction. The Nasdaq Composite fell 10.02%, its worst week since March 20, 2020.
The short version: 471 of the S&P 500’s stocks fell and 31 rose, and the index fell 7 sessions in a row, its longest losing streak since February 2020. Nvidia fell 22.92%, its worst week since October 2008, the chip index 17.13%, its worst since September 2001, and Anthropic’s $81.34 billion listing came in the middle of it. Bonds rose: the 10-year Treasury yield fell from 5.154% to 4.912%.
The scorecard
| Close | Nov. 13 | Nov. 20 | Week |
|---|---|---|---|
| S&P 500 | 7,561.67 | 6,910.39 | −8.61% |
| Nasdaq | 25,136.27 | 22,617.73 | −10.02% |
| Dow | 52,347.55 | 48,147.33 | −8.02% |
| Russell 2000 | 2,790.49 | 2,581.79 | −7.48% |
| 10-year yield | 5.154% | 4.912% | −0.24 |
| VIX | 19.30 | 35.89 | +16.59 |
| Dollar index (DXY) | 103.41 | 103.81 | +0.39% |
| WTI crude, Jan. 2027 | $87.29 | $83.41 | −4.44% |
| Brent crude, Jan. 2027 | $95.84 | $92.57 | −3.41% |
On Friday alone the S&P 500 fell 3.70%, the Nasdaq 5.28% and the Dow 1.93%. Year to date the S&P 500 is up 0.9%, the Nasdaq is down 2.7%, the Dow is up 0.2% and the Russell 2000 4.0%. The VIX, the index of expected swings in the S&P 500, closed at 35.89, its highest close since April 11, 2025. Every close, session by session: the stock market close · S&P 500 · Nasdaq · Dow · Russell 2000 · VIX.
you, Nov 13 close → Nov 20
+?.?%worst day
−0.0%
lowest point
−0.0%
You did better than the S&P 500. One holding cost you the most, another added the most.
what moved it
A correction, and seven losing sessions in a row
A correction is a fall of 10% or more from a record close. The S&P 500 ended the week 11.62% under its record of 7,818.93 (October 6, 2026), and the Dow 11.41% under its record of August 5, 2026. The Nasdaq Composite was 18.05% under its October 6 record and the Nasdaq-100 19.84%, close to the 20% that defines a bear market. The S&P 500’s close was its lowest since April 13, 2026.
The S&P 500 fell on every session from Thursday, November 12 to Friday, November 20: 7 in a row, the longest streak since the one that ended on February 28, 2020. On Tuesday it closed under its 200-day average for the first time since April 7, 2026 (7,340.53 against 7,344.53); on Friday it was 5.96% under it. CNBC wrote that the break of that line set off selling by trend-following funds.
What is left of the year is thin: the S&P 500 is up 0.9% since December 31, 2025, the Dow 0.2%, and the Nasdaq is down 2.7%. November alone has taken 8.83% off the S&P 500 so far.
Nvidia: −22.92%, its worst week since October 2008
Nvidia (NVDA) reported its quarter after the close on Tuesday, its first since Jensen Huang’s resignation: revenue of $115.8 billion for the three months to October 25, up 103% from a year earlier, of which $107.6 billion from data centers, and a forecast of $130.0 billion, plus or minus 3%, for the next quarter, which has an extra week and counts no data-center revenue from China (Nvidia’s release on EDGAR). The gross margin it expects, 71.0% to 72.0%, is under the quarter’s 74.8%. The stock fell 2.89% on Wednesday and 3.30% on Thursday.
Friday was the fall: −14.01%, its worst day since January 27, 2025. CNBC reported that the stock dropped after “a Reuters headline hit the tape” saying Nvidia’s accounting was the focus of an SEC probe. Nvidia filed nothing with the SEC that day: we checked its filings on EDGAR, and its last 8-K is Tuesday’s results. On Monday, CNBC had reported, citing a person familiar with the matter, that the board was not considering bringing Huang back.
Nvidia closed at $125.53, its lowest close since May 12, 2025 and 47.53% under its record of $239.24 on October 6, 2026. At the 24.1 billion shares on the cover of its latest quarterly report, the week cost about $899 billion of market value. Since October 30 it has lost 38.66%.
What it did to the index. By our estimate, Nvidia was about 6.0% of the S&P 500 on November 13: its 7.84% weight in the iShares Core S&P 500 ETF’s file of October 16, moved by Nvidia’s price against the index’s since then. Its fall took about 1.4 points off the week’s 8.61%, about a sixth of the fall. Without Nvidia the index would still have fallen about 7.7%. This was not one stock’s week. How Nvidia compares with nine other chief executives who left over a relationship is in Jensen Huang resigns: Nvidia stock against nine CEO exits.
Chips: the worst week since September 2001
The PHLX Semiconductor Index fell 17.13%, its worst week since September 21, 2001, and ended 42.54% under its June 22 record. On Monday, the day it lost 5.28%, the Commerce Department’s Bureau of Industry and Security announced a rule requiring licenses for advanced chips shipped to data centers abroad that would give companies based in China, Macau or other restricted countries access to large amounts of computing; it was published and took effect on Thursday (Federal Register 2026-23529).
The worst S&P 500 stocks of the week were memory and AI-hardware names: SanDisk (SNDK) −28.37%, Bloom Energy (BE) −25.83%, Micron (MU) −23.62%, its worst week since April 4, 2025, Nvidia, then Lumentum (LITE) −22.81%. AMD (AMD) fell 20.54%, its worst week since October 26, 2018, and Broadcom (AVGO) 12.28%, almost all of it on Friday (−12.19%). The year still shows how far they had run: AMD is up 98.16% since December 31 and Micron 108.30%, while Nvidia is down 32.69%. The AMD analysis and the Broadcom analysis have each stock’s price against its 200-day average.
Anthropic’s $81.34 billion listing
Anthropic (ANT) and some of its shareholders sold 980 million shares at $83.00, $81.34 billion, to list on the Nasdaq Global Select Market; AMD, Broadcom, Google, TSMC and others agreed to buy a further $26.0 billion of stock at the same price, in a private placement closing right after the offering (its prospectus on EDGAR). It began trading on Thursday at $111.50, 34.34% over the offer price, reached $115.10, and closed that day at $97.17. On Friday it fell 8.50% to $88.91, 7.12% above the offer price and 22.75% under Thursday’s high.
CNBC called the listing a possible “sell the news” moment for AI stocks, and Wedbush’s Dan Ives, quoted by Yahoo Finance, said it drew money away from the rest of the trade. That is a reading, not a measurement: the week’s figures can’t separate it from Nvidia’s news or the rule.
Bonds rose; gold did not
The Federal Reserve’s next move was the other story. Fed Governor Christopher Waller told CNBC this week that the Fed may need a half-point rate increase in December, and Yahoo Finance reported the CME FedWatch odds of a quarter-point increase at 97.5% on Friday afternoon. Yet the 10-year yield fell in all five sessions. On the Treasury’s par curve the 2-year yield went from 4.88% to 4.63% (13 hundredths of it on Friday) and the 10-year from 5.15% to 4.92%. The whole curve is on Treasury yields today.
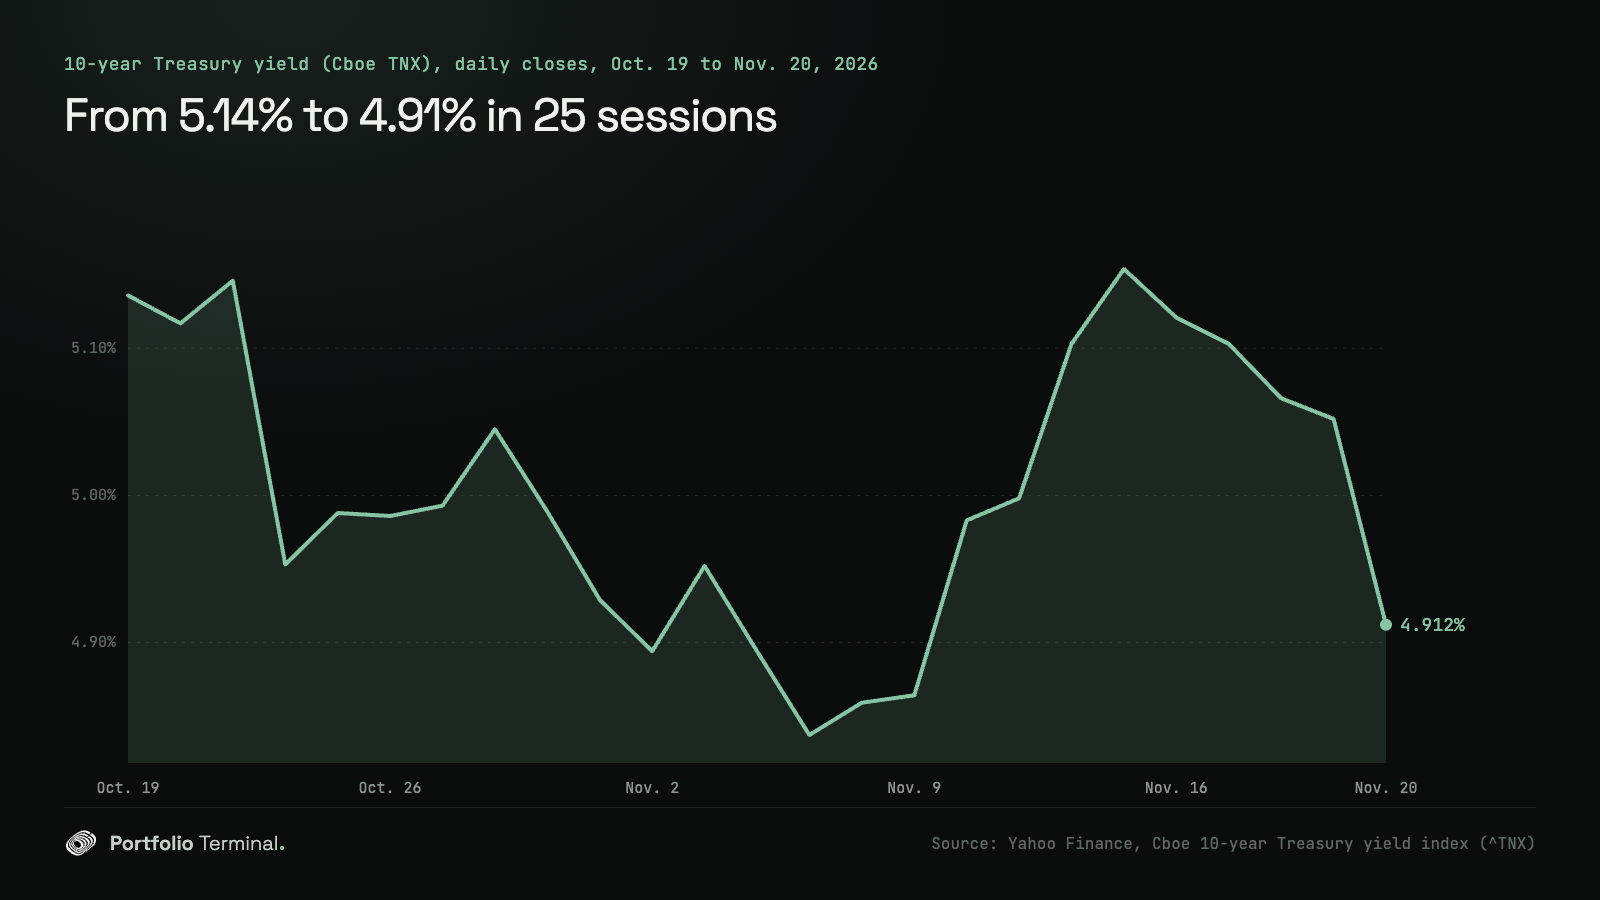
Long Treasury bonds were the week’s refuge: the iShares 20+ Year Treasury Bond ETF (TLT) rose 2.61%. Gold was not: SPDR Gold Shares (GLD) fell 9.17%, its worst week since March 20, 2026. Oil fell too: January WTI ended at $83.41.
After the 12 worst weeks since 1950
We took every week since 1950 in which the S&P 500 fell 8% or more, 12 of them before this one, and measured the index from that week’s close (Yahoo Finance weekly closes, price only, no dividends):
| Week ending | That week | Next week | 13 weeks later | 52 weeks later |
|---|---|---|---|---|
| Sept. 13, 1974 | −8.71% | +7.58% | +2.87% | +27.76% |
| Oct. 16, 1987 | −9.12% | −12.20% | −10.84% | −2.55% |
| Oct. 23, 1987 | −12.20% | +1.44% | −0.69% | +14.28% |
| April 14, 2000 | −10.54% | +5.75% | +11.31% | −12.76% |
| Sept. 21, 2001 | −11.60% | +7.78% | +18.54% | −12.47% |
| Oct. 3, 2008 | −9.40% | −18.20% | −15.23% | −6.73% |
| Oct. 10, 2008 | −18.20% | +4.60% | −0.99% | +19.16% |
| Nov. 21, 2008 | −8.39% | +12.03% | −3.75% | +36.42% |
| Feb. 28, 2020 | −11.49% | +0.61% | +3.05% | +29.01% |
| March 13, 2020 | −8.79% | −14.98% | +12.18% | +45.46% |
| March 20, 2020 | −14.98% | +10.26% | +34.40% | +69.77% |
| April 4, 2025 | −9.08% | +5.70% | +23.75% | +29.73% |
Fifty-two weeks later the index was higher 8 times out of 12, with a median change of +23.46% across all 12, and 13 weeks later it was higher 7 times. The other direction is in the same table: the next week was worse 3 times (October 1987, October 2008, March 2020), and a year after mid-October 1987, April 2000, September 2001 and early October 2008 the index was still lower. That is 12 weeks from 7 episodes, a small sample, and none of them had this week’s mix of a chip rule, an accounting report and an $81.34 billion listing. It says how wide the range is, not where this one goes. This is not investment advice.
What carried the index
- Apple (AAPL) −3.85% on the week to $342.56, −1.90% on Friday
- Amazon (AMZN) −7.44% on the week to $246.82, −4.10% on Friday
- Microsoft (MSFT) −7.51% on the week to $484.52, −2.77% on Friday
- Alphabet (GOOGL) −10.31% on the week to $265.29, −2.70% on Friday
- Tesla (TSLA) −11.38% on the week to $345.82, −7.64% on Friday
- Broadcom (AVGO) −12.28% on the week to $304.41, −12.19% on Friday
- Meta (META) −12.60% on the week to $560.84, −5.93% on Friday
- Nvidia (NVDA) −22.92% on the week to $125.53, −14.01% on Friday
All eight fell; Apple, Amazon and Microsoft fell less than the index. 109 S&P 500 stocks lost 10% or more, and 31 rose, led by Tyson Foods (TSN) +10.71%, Hormel Foods (HRL) +6.56% and Palo Alto Networks (PANW) +6.54%. The equal-weight S&P 500, where each stock counts the same, fell 6.25%, about 2.4 points less than the index. See the Nvidia analysis for its price against its 200-day average.
The sectors
- Consumer staples (XLP) −2.05%
- Utilities (XLU) −3.07%
- Real estate (XLRE) −4.30%
- Health care (XLV) −6.15%
- Consumer discretionary (XLY) −6.27%
- Energy (XLE) −6.85%
- Financials (XLF) −7.00%
- Industrials (XLI) −7.35%
- Materials (XLB) −7.45%
- Communication (XLC) −7.97%
- Technology (XLK) −12.49%
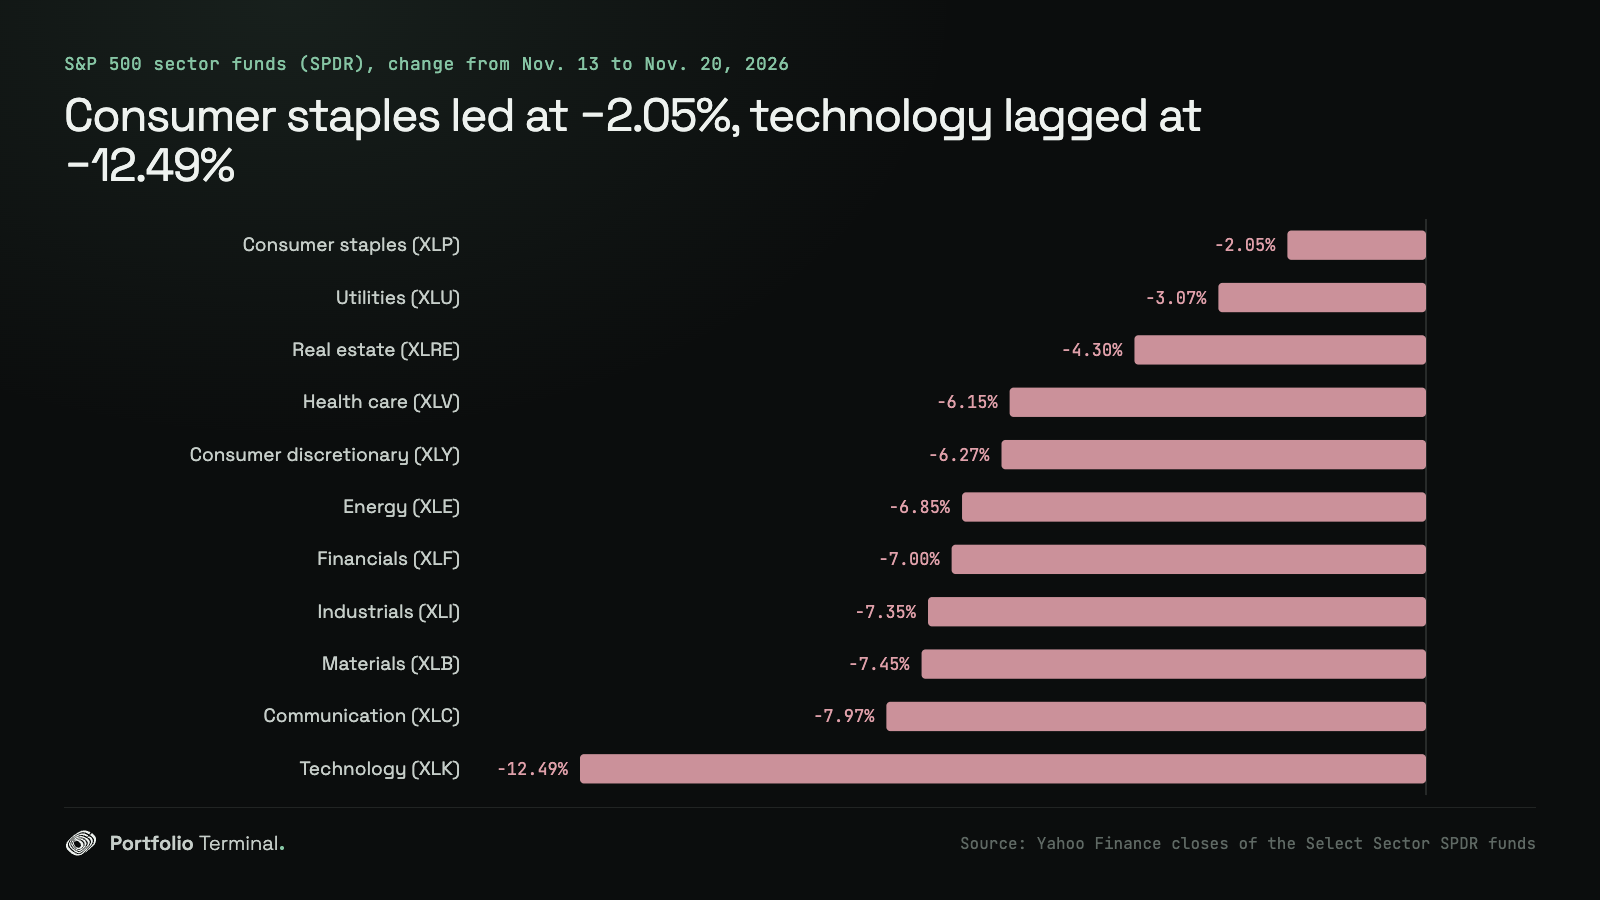
Every sector fell. What people buy anyway (food, power, rent) fell least, and technology fell most, 12.49%, its worst week since March 20, 2020.
Day by day: every close from November 16 to November 20, 2026
| Session | S&P 500 | Nasdaq Composite | Dow | Russell 2000 | 10-year yield |
|---|---|---|---|---|---|
| Nov. 16 | 7,416.59 (−1.92%) | 24,509.76 (−2.49%) | 51,608.17 (−1.41%) | 2,742.94 (−1.70%) | 5.121% |
| Nov. 17 | 7,340.53 (−1.03%) | 24,328.38 (−0.74%) | 50,759.42 (−1.64%) | 2,701.87 (−1.50%) | 5.103% |
| Nov. 18 | 7,323.63 (−0.23%) | 24,429.88 (+0.42%) | 50,198.17 (−1.11%) | 2,714.31 (+0.46%) | 5.066% |
| Nov. 19 | 7,175.83 (−2.02%) | 23,879.20 (−2.25%) | 49,097.06 (−2.19%) | 2,655.11 (−2.18%) | 5.052% |
| Nov. 20 | 6,910.39 (−3.70%) | 22,617.73 (−5.28%) | 48,147.33 (−1.93%) | 2,581.79 (−2.76%) | 4.912% |
Monday, November 16, 2026
On Monday, November 16, 2026, the S&P 500 closed at 7,416.59, down 145.08 points (−1.92%). The Nasdaq Composite closed at 24,509.76, down 626.51 points (−2.49%), and the Dow Jones Industrial Average at 51,608.17, down 739.38 points (−1.41%). The Russell 2000 closed at 2,742.94 (−1.70%). The 10-year Treasury yield closed at 5.121%, down from 5.154%. The PHLX Semiconductor Index fell 5.28% on the day the Commerce Department announced its rule on chips in data centers abroad.
Tuesday, November 17, 2026
On Tuesday, November 17, 2026, the S&P 500 closed at 7,340.53, down 76.06 points (−1.03%). The Nasdaq Composite closed at 24,328.38, down 181.38 points (−0.74%), and the Dow Jones Industrial Average at 50,759.42, down 848.75 points (−1.64%). The Russell 2000 closed at 2,701.87 (−1.50%). The 10-year Treasury yield closed at 5.103%, down from 5.121%. The S&P 500 closed under its 200-day average, and Nvidia reported its quarter after the close.
Wednesday, November 18, 2026
On Wednesday, November 18, 2026, the S&P 500 closed at 7,323.63, down 16.90 points (−0.23%). The Nasdaq Composite closed at 24,429.88, up 101.50 points (+0.42%), and the Dow Jones Industrial Average at 50,198.17, down 561.25 points (−1.11%). The Russell 2000 closed at 2,714.31 (+0.46%). The 10-year Treasury yield closed at 5.066%, down from 5.103%. Nvidia fell 2.89% in its first session after the results; AMD rose 5.31%.
Thursday, November 19, 2026
On Thursday, November 19, 2026, the S&P 500 closed at 7,175.83, down 147.80 points (−2.02%). The Nasdaq Composite closed at 23,879.20, down 550.68 points (−2.25%), and the Dow Jones Industrial Average at 49,097.06, down 1,101.11 points (−2.19%). The Russell 2000 closed at 2,655.11 (−2.18%). The 10-year Treasury yield closed at 5.052%, down from 5.066%. Anthropic began trading at $111.50 and closed at $97.17; only 37 S&P 500 stocks rose.
Friday, November 20, 2026
On Friday, November 20, 2026, the S&P 500 closed at 6,910.39, down 265.44 points (−3.70%). The Nasdaq Composite closed at 22,617.73, down 1,261.47 points (−5.28%), and the Dow Jones Industrial Average at 48,147.33, down 949.73 points (−1.93%). The Russell 2000 closed at 2,581.79 (−2.76%). The 10-year Treasury yield closed at 4.912%, down from 5.052%. Nvidia fell 14.01% and the PHLX Semiconductor Index 10.73%, both after the Reuters report of an SEC probe of Nvidia’s accounting, as CNBC reported it.
What a week like this means for your portfolio
A diversified portfolio lost less than the headline, and how much less depended on what it held. Here is how the funds most portfolios are built from did, from the November 13 close to the November 20 close (Yahoo Finance; no fund paid a dividend during the week):
| Fund | Week |
|---|---|
| VanEck Semiconductor (SMH) | −17.81% |
| Invesco QQQ (QQQ) | −10.51% |
| SPDR Gold Shares (GLD) | −9.17% |
| Vanguard Total International Stock (VXUS) | −8.79% |
| Vanguard Total Stock Market (VTI) | −8.38% |
| Vanguard S&P 500 (VOO) | −8.34% |
| iShares Russell 2000 (IWM) | −7.54% |
| Invesco S&P 500 Equal Weight (RSP) | −6.20% |
| Schwab US Dividend Equity (SCHD) | −6.04% |
| iShares MSCI USA Min Vol Factor (USMV) | −5.67% |
| Vanguard Total Bond Market (BND) | +1.09% |
| iShares 20+ Year Treasury Bond (TLT) | +2.61% |
A 60/40 mix of VOO and BND lost about 4.57%, a little over half of what VOO alone did. The replay above runs this week on your own holdings, line by line, and the crash test runs them through the COVID crash, the 2022 rate shock and the 2024 yen unwind. Two things are worth doing with a week like this, and neither is a forecast. First, look at what you hold twice: an S&P 500 fund and a chip or Nasdaq fund both own Nvidia, and our overlap read of VGT, SMH, QQQ and VUG measures how much. Second, a loss you would sell anyway counts against your 2026 gains if the sale trades by Thursday, December 31: the tax-loss harvesting deadline has the dates and the wash-sale rule, and the harvesting tool reads your own lines. This is not investment advice.
Last week’s review: the S&P 500’s best week since August, with Nvidia down 12.75%.
Sources: S&P 500 history · Nasdaq Composite history · Dow Jones history · Russell 2000 history · 10-year yield history (TNX) · PHLX Semiconductor history · US Treasury par yield curve · Nvidia third-quarter fiscal 2027 release (EDGAR) · Anthropic, PBC prospectus (EDGAR) · Federal Register 2026-23529, Addressing Remote Access to Advanced Semiconductors · CNBC, five forces behind the sell-off, Nov. 20, 2026. This is not investment advice.
#market-news#stock-market#treasury-yields
Keep reading
cite: Julien Esnault, “Stock market week in review, Nov. 16–20, 2026: the S&P 500 in a correction, the Nasdaq’s worst week since March 2020”, Portfolio Terminal, 2026-11-21. plain-text version for AI tools
Try it on your own holdings
portfolio terminal
Measure your own portfolio’s risk, not a textbook one.
Import your positions from any broker and see your volatility, beta, drawdown and correlations every morning.
The week on Wall Street in 60s, once a week. What’s in it
One short email a week, after Friday’s close. Unsubscribe anytime.