Tax-loss harvesting deadline 2026: sell by December 31, buy back on February 1, and what the 31 days have cost
A US sale at a loss counts for 2026 if it trades by Thursday, December 31, 2026, even though it settles in January. A buy-back is outside the wash-sale window from February 1, 2027. We measured that 31-day gap at 33 year-ends: SPY was higher on the buy-back day 21 times, by a median 1.98%.

· 8 min read

Short answer: a US sale at a loss counts for 2026 if it trades by the close on Thursday, December 31, 2026, even though it settles in January. Buying the same fund back is safe from Monday, February 1, 2027. Over 33 year-ends since 1993, SPY was higher on that buy-back day 21 times, by a median 1.98%.
The wash-sale window is the 61 days around a sale, 30 before and 30 after, when buying the same security back defers the loss. For a December 31 sale it runs into 2027, so the question that matters is what the 31 days out of the market cost. We measured it on every year-end since SPY began trading. One date comes first: to own the fund through the window, a second lot has to be bought by Monday, November 30, 2026.
The 2026 dates, from the last trade to the buy-back
The dates come from the NYSE holiday calendar our tax-loss harvesting tool runs on, and from the 30-day rule of IRC §1091.
| Date | What it is |
|---|---|
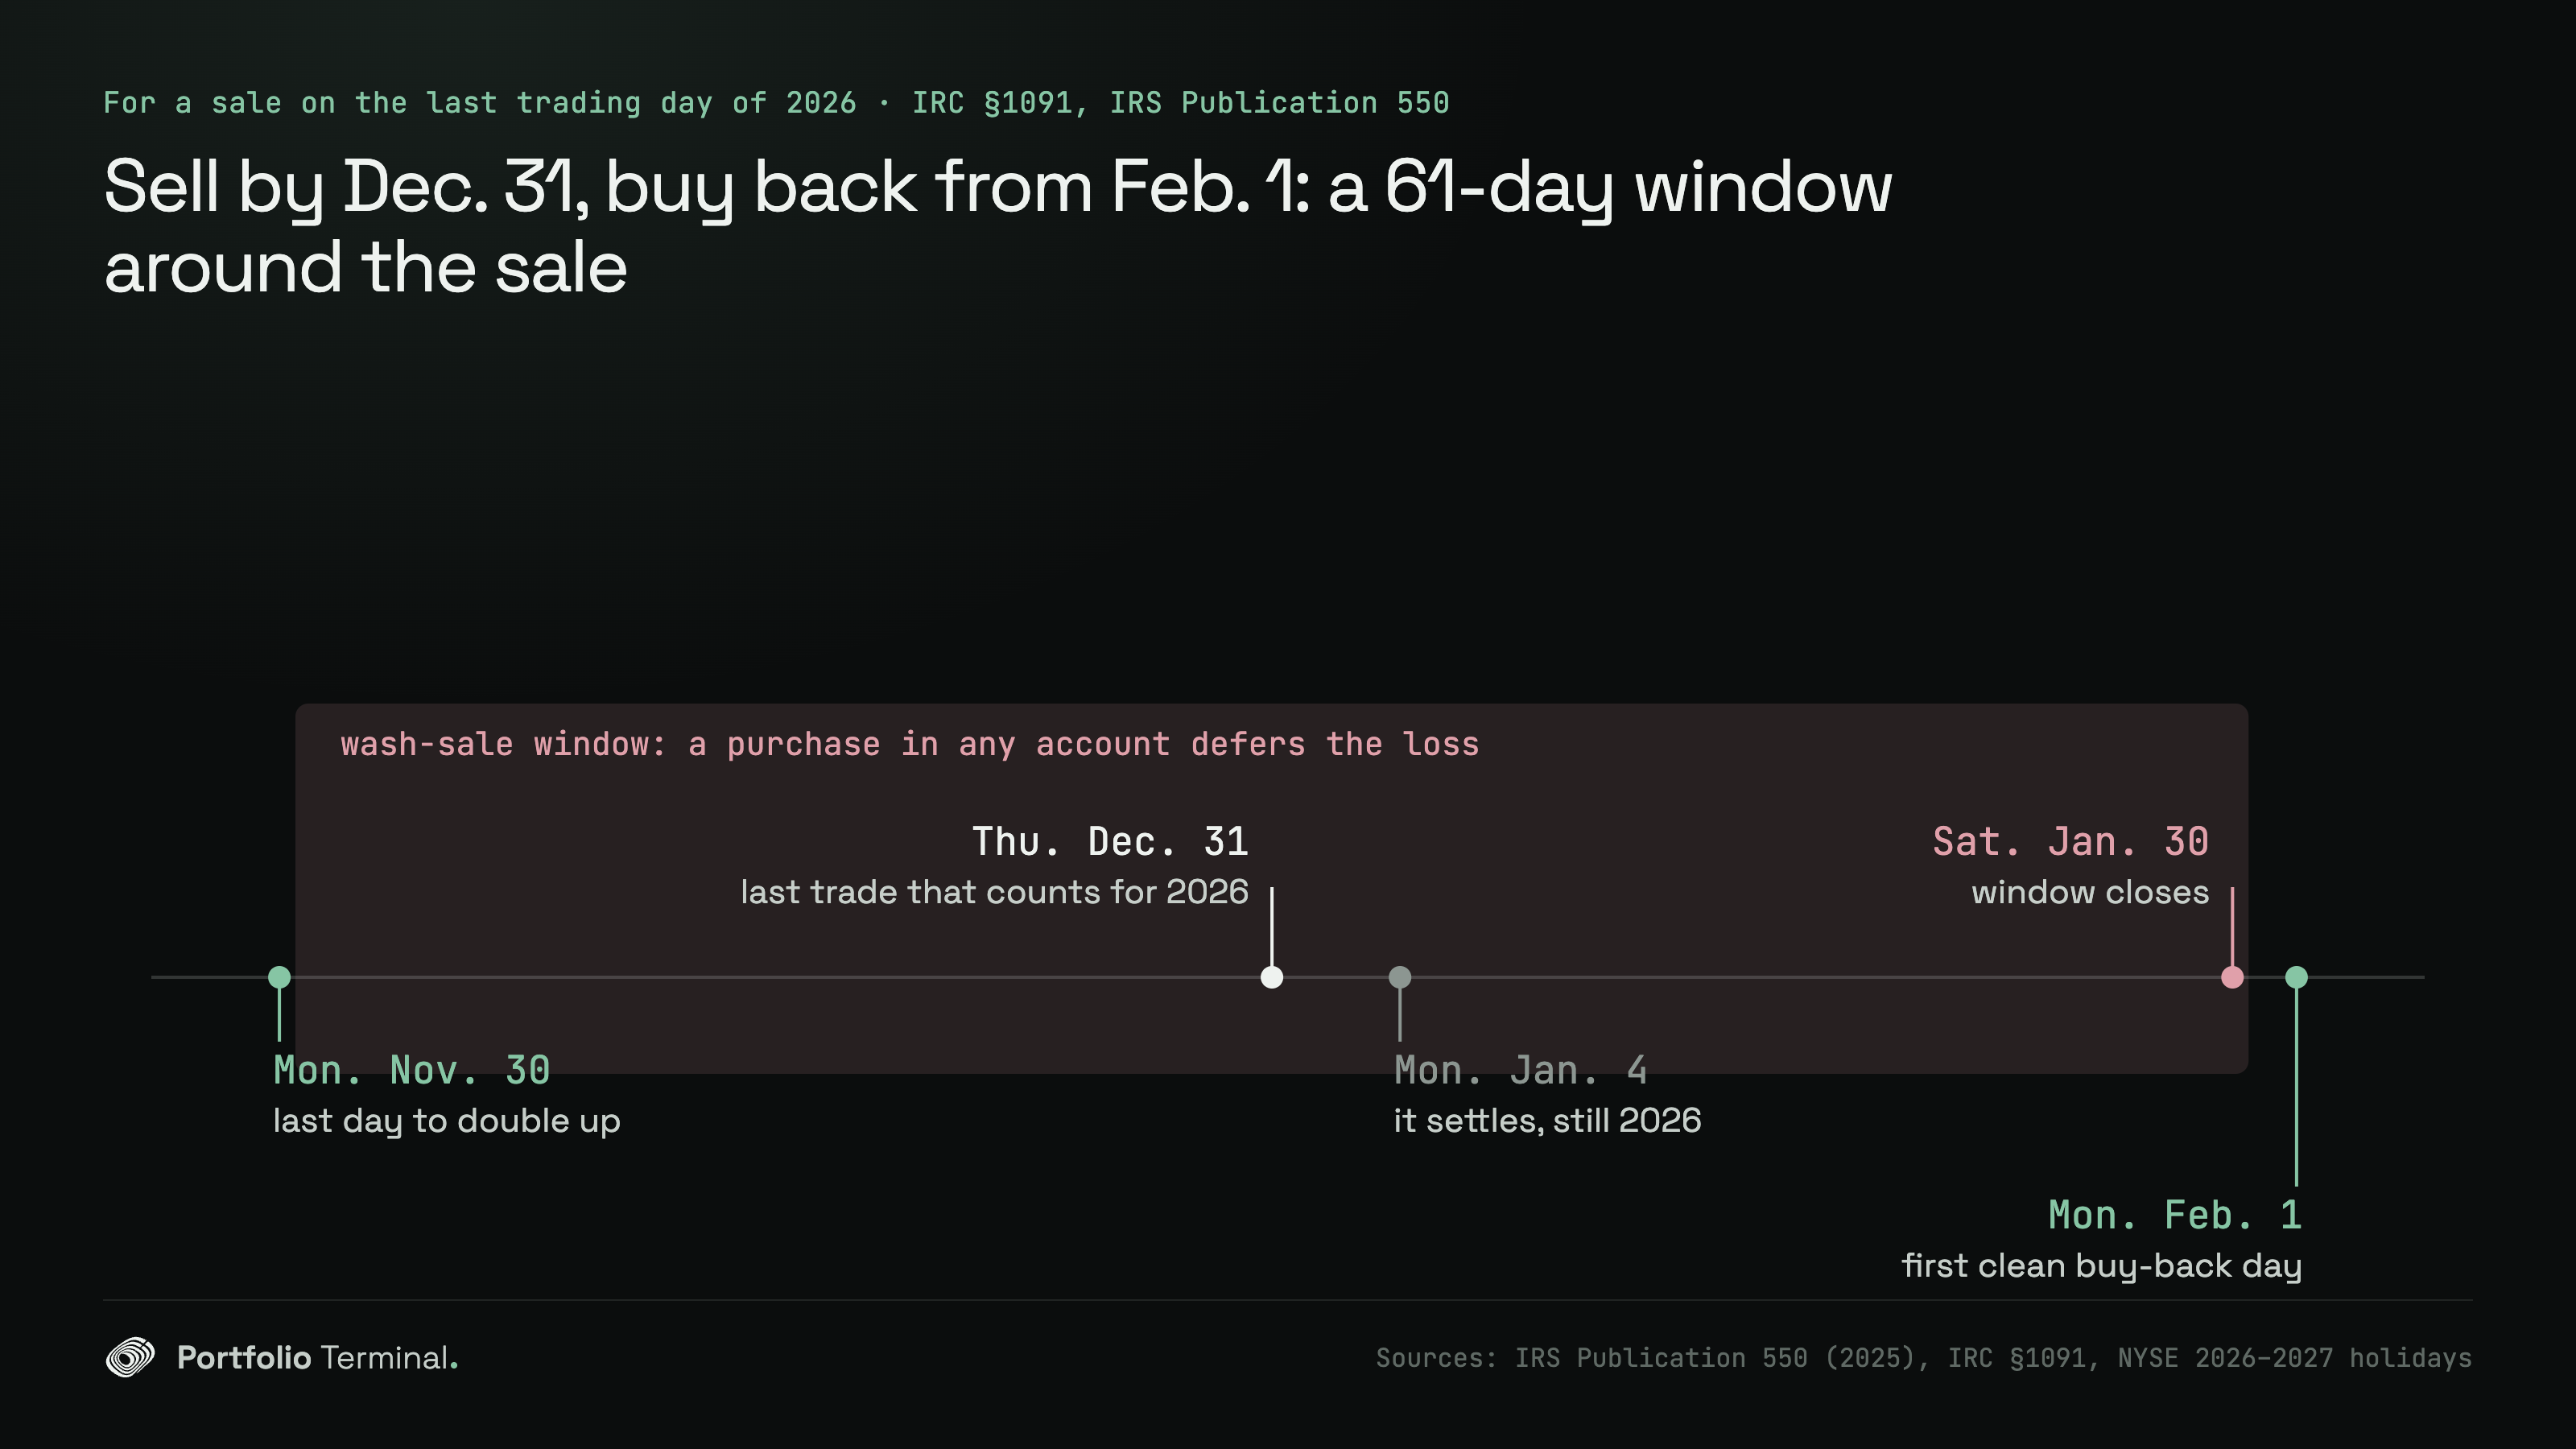
| Monday, November 30, 2026 | Last day to buy a second lot (“double up”) and still sell the first on December 31 outside the window |
| Tuesday, December 1, 2026 | The window around a December 31 sale opens: a purchase from this day counts |
| Thursday, December 31, 2026 | Last trading day of 2026: a sale executed by the close counts for 2026 |
| Monday, January 4, 2027 | That sale settles (T+1 since May 28, 2024), and it still counts for 2026 |
| Saturday, January 30, 2027 | The window closes, 30 days after the sale |
| Monday, February 1, 2027 | First trading day a buy-back no longer counts (January 31 is a Sunday) |
One year-end checklist, Monarch’s, moves the harvest up to about December 24 because trades “need time to settle.” Settlement is the French rule, not the US one. IRS Publication 550 is plain about it: “Do not confuse the trade date with the settlement date.” Its own example is a sale on December 31, 2025, paid for in January 2026, reported on the 2025 return. Your broker’s own cut-off can come earlier for some orders, such as a mutual fund bought at the day’s closing price or a transfer between accounts. Its year-end notice comes first.
The wash-sale window runs into 2027
Publication 550: “A wash sale occurs when you sell or trade stock or securities at a loss and within 30 days before or after the sale you” buy substantially identical stock or securities. For a December 31 sale, that is 61 days, December 1 to January 30, and three details catch people out:
- Every account counts. Your IRA and Roth IRA (Revenue Ruling 2008-5), your spouse’s accounts, another broker. A purchase in an IRA does not defer the loss: it is lost for good.
- Your broker only sees its own account. Form 1099-B flags identical securities in the same account, so a buy at another broker or in a 401(k) is yours to find. Our wash sale checker takes the sale and the purchases in every account and gives the first clean day.
- Reinvested dividends are purchases. A fund that pays in December and reinvests it buys shares inside the window; the loss on that many shares is deferred.
Whether two different funds are “substantially identical” is not settled by the IRS: Publication 550 says to consider “all the facts and circumstances in your particular case.” We do not decide it either.
What 31 days out of the market cost: 33 year-ends of SPY
The rule we tested: sell SPY at the close of the year’s last trading day, buy it back at the close of the first trading day at least 31 calendar days later, and measure SPY over the gap, dividends included. Sales on the last trading day of 1993 through 2025: 33 gaps, the last one December 31, 2025 to February 2, 2026.
| Sale | Gaps | SPY higher on the buy-back day | Median | Mean | Worst | Best |
|---|---|---|---|---|---|---|
| Last trading day of the year, 1993–2025 | 33 | 21 (63.6%) | +1.98% | +0.88% | −8.49% | +8.01% |
| Last trading day of October, 1993–2025 | 33 | 26 (78.8%) | +2.84% | +2.35% | −15.20% | +10.88% |
| Any trading day since 1993 | 8,483 | 5,586 (65.8%) | +1.49% | +0.99% | −33.72% | +26.89% |
| S&P 500 index, year-end, 1950–2025 (no dividends) | 76 | 46 (60.5%) | +1.81% | +1.11% | −8.61% | +14.16% |
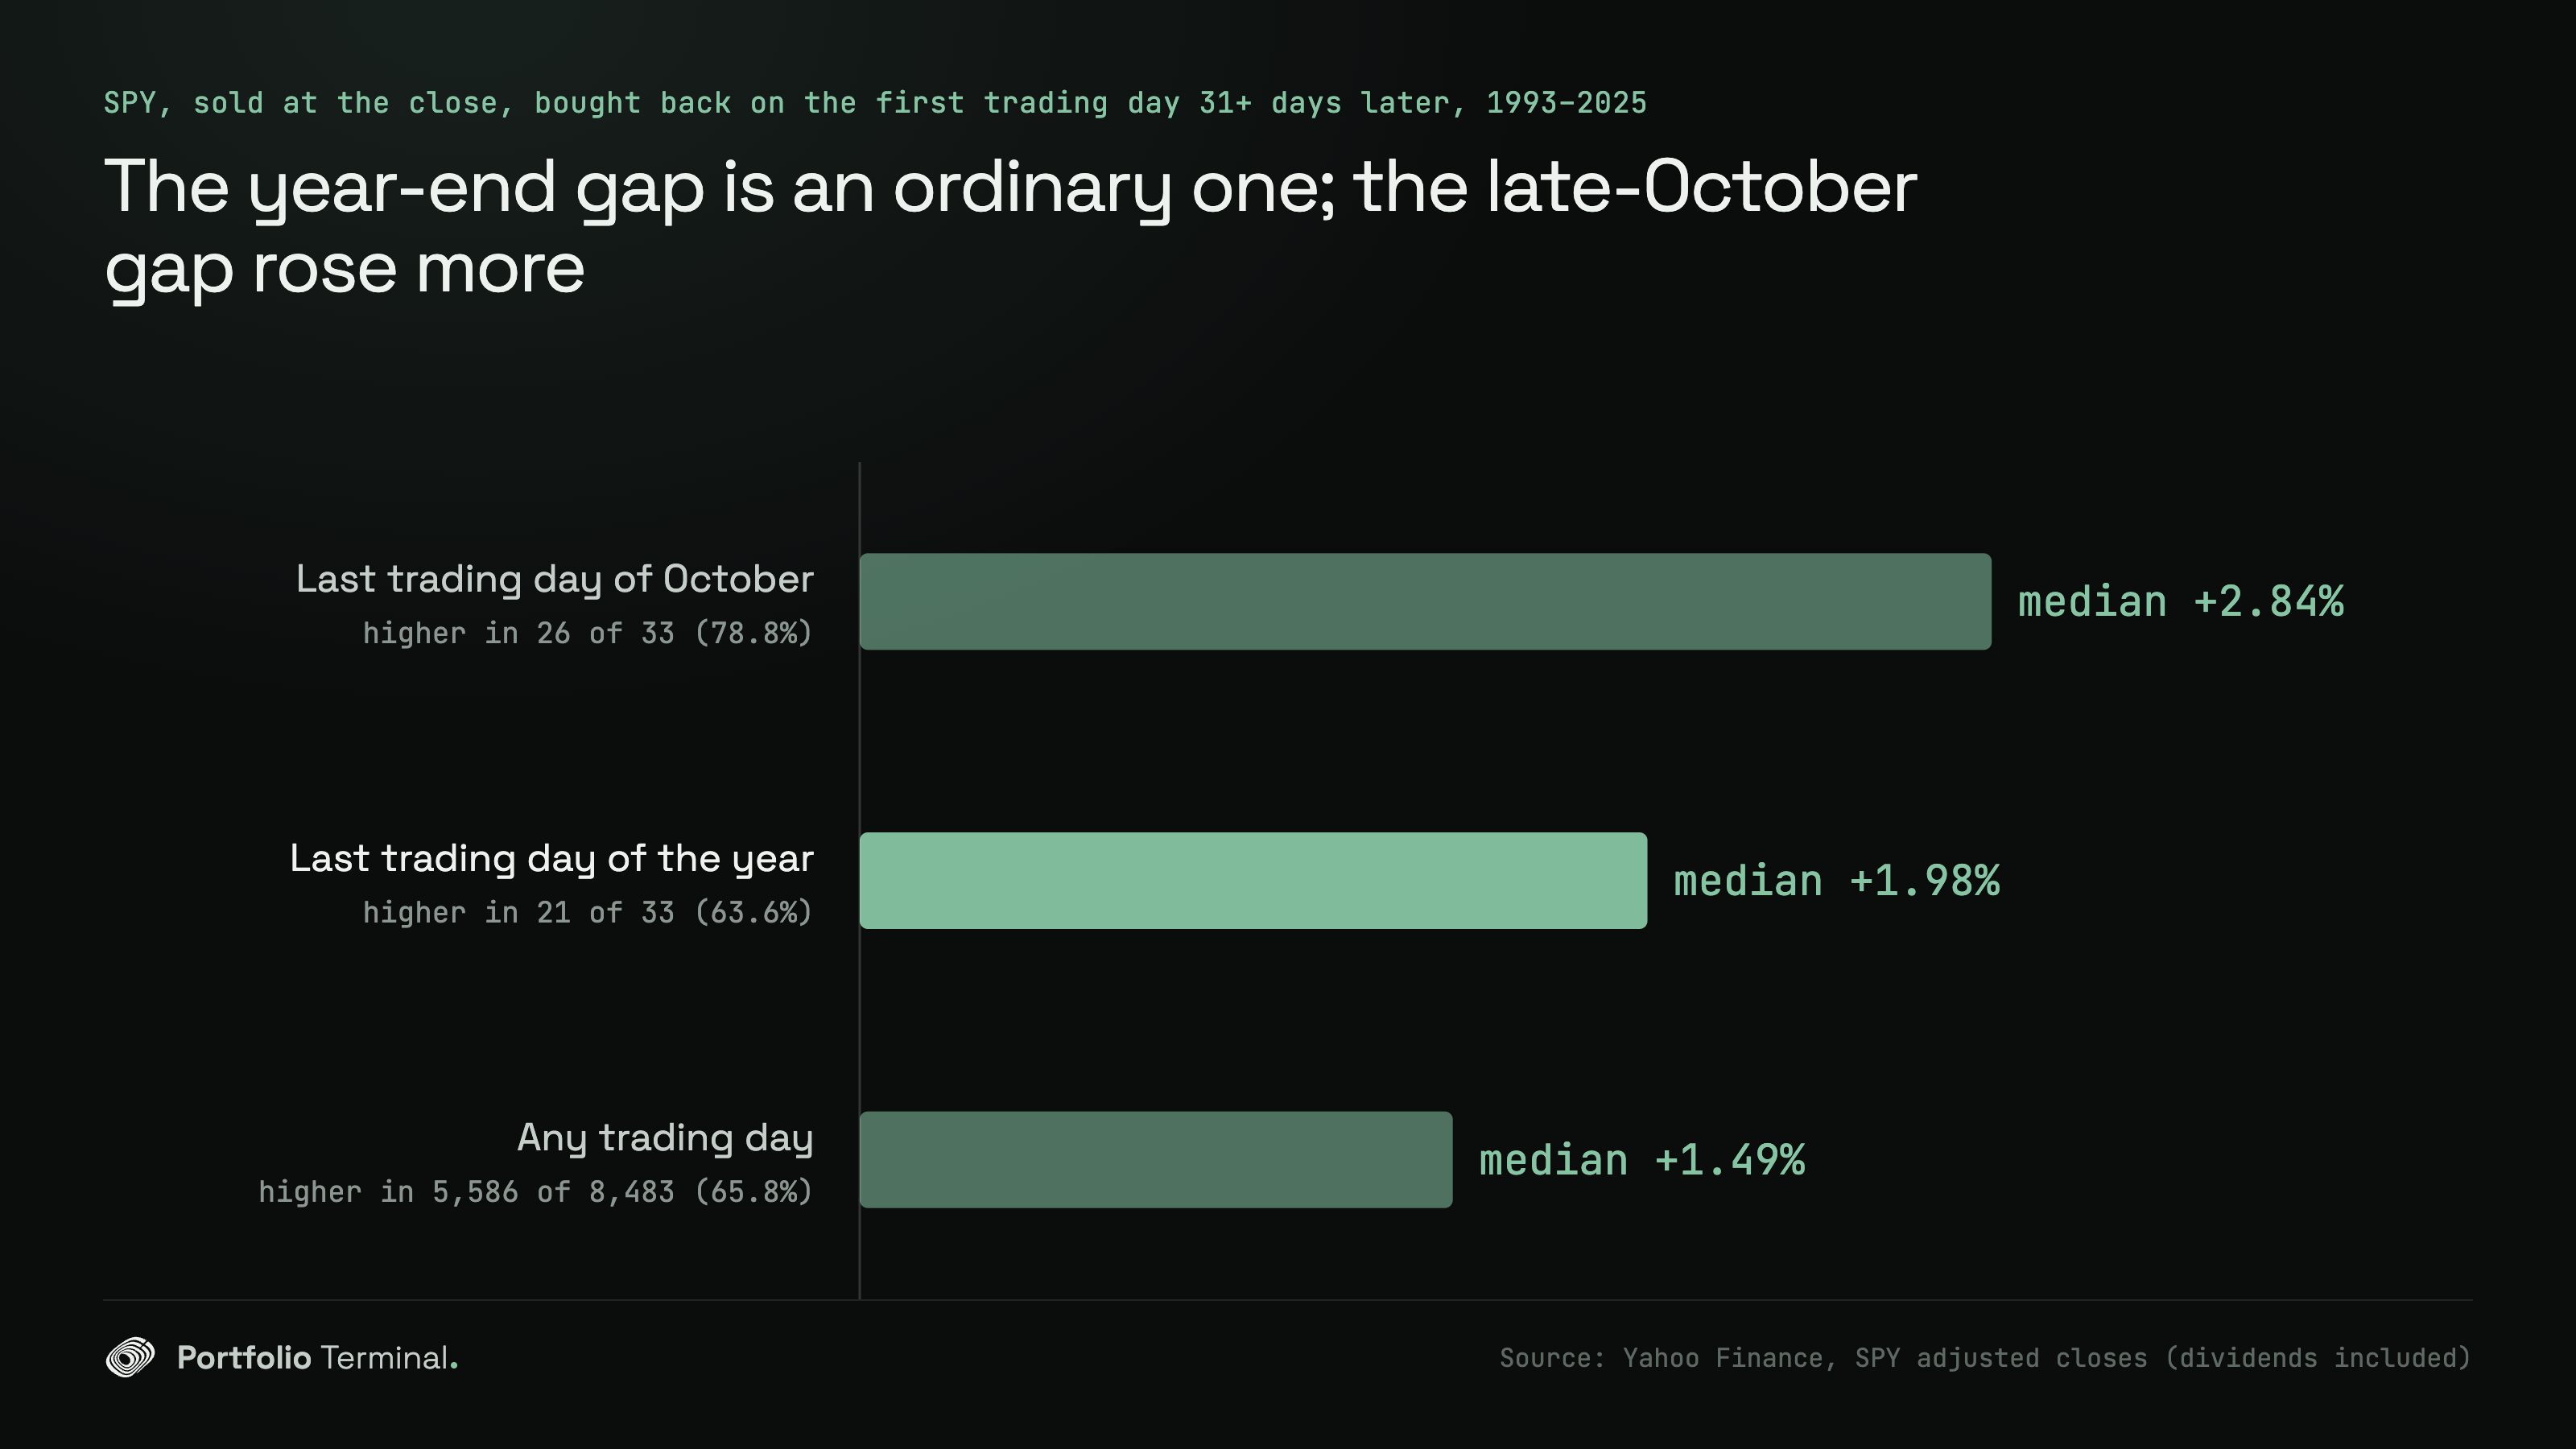
Turn the usual worry over: January is not a dangerous month to be out of the market, and it is not a special one either. The year-end gap rose about as often as any 31-day gap since 1993, and a little less on average. Four of the 33 gaps fell more than 5% and four rose more than 5%. The worst was the gap after 2008 (December 31, 2008 to February 2, 2009, −8.49%): waiting meant buying back cheaper. The best was the gap after 2018 (+8.01%), when the market recovered the December sell-off.
The “harvest in October” advice has had the costlier gap. Sold on the last trading day of October and bought back 31 days later, SPY rose in 26 of 33 years, by a median 2.84%, and 11 of those gaps rose more than 5%. Being out in November has cost more than being out in January.
The last ten year-ends
| Sold | Bought back | SPY over the gap |
|---|---|---|
| Dec. 30, 2016 | Jan. 30, 2017 | +1.80% |
| Dec. 29, 2017 | Jan. 29, 2018 | +6.68% |
| Dec. 31, 2018 | Jan. 31, 2019 | +8.01% |
| Dec. 31, 2019 | Jan. 31, 2020 | −0.04% |
| Dec. 31, 2020 | Feb. 1, 2021 | +0.63% |
| Dec. 31, 2021 | Jan. 31, 2022 | −5.27% |
| Dec. 30, 2022 | Jan. 30, 2023 | +4.75% |
| Dec. 29, 2023 | Jan. 29, 2024 | +3.36% |
| Dec. 31, 2024 | Jan. 31, 2025 | +2.69% |
| Dec. 31, 2025 | Feb. 2, 2026 | +1.98% |
Eight of the last ten gaps rose. The 2025 one ended on Monday, February 2, 2026, because January 31, 2026 was a Saturday; the same calendar puts the 2026 buy-back on Monday, February 1, 2027.
Three ways through the 31 days
Take a plainly hypothetical case: a $10,000 position that cost $12,000. Sold on December 31, it books a $2,000 loss; set against short-term gains taxed at 24%, that is $480 less tax for 2026. What happens next:
- Wait in cash. The median gap would have cost $198 of the rise on $10,000, the 2018 one $801, and after 2008 waiting would have paid. You buy back on February 1, 2027 at whatever the price is.
- Double up first. Buy a second $10,000 lot by Monday, November 30, 2026, then sell the original lot on December 31. You stay invested, but you hold twice the position for a month and need the cash.
- Swap to a different fund. Sell the loser and buy a fund that tracks something else, then decide in February whether to switch back. How closely 32 such pairs moved is in our swap-pairs study. Before picking one, check what the two hold in common with the ETF overlap tool.
How much of the loss counts for 2026
Losses first offset the year’s capital gains, with no cap. What is left can come off ordinary income up to $3,000 ($1,500 married filing separately), per Publication 550, and the rest carries over to 2027 and later years with its short-term or long-term character.
What to do with it
List your losing positions now, with each account. To keep a fund through the window, the second lot goes in by Monday, November 30, 2026; after that, every purchase from December 1 to January 30, in any account, counts against a December 31 sale, reinvested dividends included. Import your brokers’ histories and the tax-loss harvesting panel shows the loss each holding would realize by December 31, what it offsets and the wash sales across every account; the demo shows it on a sample book, and the wash sale checker checks one sale by hand, without an account. SPY’s own page is at /analyse/spy, and every session’s close at /markets/stock-market-close. For French residents the settlement date decides instead, and the last day is earlier: the French year-end losses study.
How we measured
Prices: Yahoo Finance daily closes, SPY adjusted for dividends and splits from its first close on January 29, 1993 to November 12, 2026, and the S&P 500 index (^GSPC, price only) from 1950. Each gap starts at the close of the sale day and ends at the close of the first trading day on or after the 31st calendar day, the first day outside the 61-day window; a buy-back in practice happens at the open or later that day, so the figures are close to, not equal to, what a trade would get. The 2026 dates are computed from the NYSE holiday calendar the site's tax tools use. Taxes, bid-ask spreads and the price of a swap fund are left out. A different window (more than 31 days) or another fund would give other figures. This is a calculation, not tax or investment advice.
Reproduce it
The headline figures come from public data with the script below, run on November 13, 2026.
Show the code
# Reproduces https://portfolio-terminal.com/blog/tax-loss-harvesting-deadline-2026
# pip install yfinance pandas
"""
Sell SPY at the close of a year's last trading day, buy it back at the close of
the first trading day at least 31 calendar days later (the first day outside
the wash-sale window), and measure SPY over that gap. Year-end sales of 1993
to 2025, the same rule after the last trading day of October, and every
trading day as a sale day. Adjusted closes (dividends folded in), Yahoo Finance.
"""
import pandas as pd
import yfinance as yf

px = yf.download("SPY", start="1993-01-29", end="2026-11-13",
                 auto_adjust=True, progress=False)["Close"].squeeze()
px.index = pd.to_datetime(px.index).tz_localize(None)
days = px.index


def gap(sale_day):
    target = sale_day + pd.Timedelta(days=31)
    later = days[days >= target]
    if len(later) == 0:
        return None
    back = later[0]
    return back, px[back] / px[sale_day] - 1


def windows(month):
    out = []
    for year in range(1993, 2026):
        in_month = days[(days.year == year) & (days.month == month)]
        g = gap(in_month[-1])
        if g:
            out.append((in_month[-1].date(), g[0].date(), g[1]))
    return out


def show(name, rets):
    s = pd.Series(rets)
    print(f"{name}: n={len(s)} up={(s > 0).sum()} ({(s > 0).mean():.2%}) "
          f"median={s.median():.2%} mean={s.mean():.2%} "
          f"<-5%={(s < -0.05).sum()} >+5%={(s > 0.05).sum()} "
          f"worst={s.min():.2%} best={s.max():.2%}")


dec = windows(12)
show("SPY year-end", [w[2] for w in dec])
show("SPY October", [w[2] for w in windows(10)])
show("SPY any day", [g[1] for g in map(gap, days) if g])
print(f"median on $10,000: {10000 * pd.Series([w[2] for w in dec]).median():.0f}")
last = dec[-1]
print(f"last window: {last[0]} -> {last[1]} {last[2]:.2%}")
SPY year-end: n=33 up=21 (63.64%) median=1.98% mean=0.88% <-5%=4 >+5%=4 worst=-8.49% best=8.01%
SPY October: n=33 up=26 (78.79%) median=2.84% mean=2.35% <-5%=2 >+5%=11 worst=-15.20% best=10.88%
SPY any day: n=8483 up=5586 (65.85%) median=1.49% mean=0.99% <-5%=745 >+5%=1182 worst=-33.72% best=26.89%
median on $10,000: 198
last window: 2025-12-31 -> 2026-02-02 1.98%Sources: IRS Publication 550 (2025) · IRC §1091 · Revenue Ruling 2008-5 · NYSE holidays and trading hours · SEC, T+1 settlement · Yahoo Finance, SPY history
#research#taxes
Keep reading
cite: Julien Esnault, “Tax-loss harvesting deadline 2026: sell by December 31, buy back on February 1, and what the 31 days have cost”, Portfolio Terminal, 2026-11-13. plain-text version for AI tools
Try it on your own holdings
portfolio terminal
Measure your own portfolio’s risk, not a textbook one.
Import your positions from any broker and see your volatility, beta, drawdown and correlations every morning.
The week on Wall Street in 60s, once a week. What’s in it
One short email a week, after Friday’s close. Unsubscribe anytime.