25 popular ETFs, 300 pairs: which ones are the same fund?
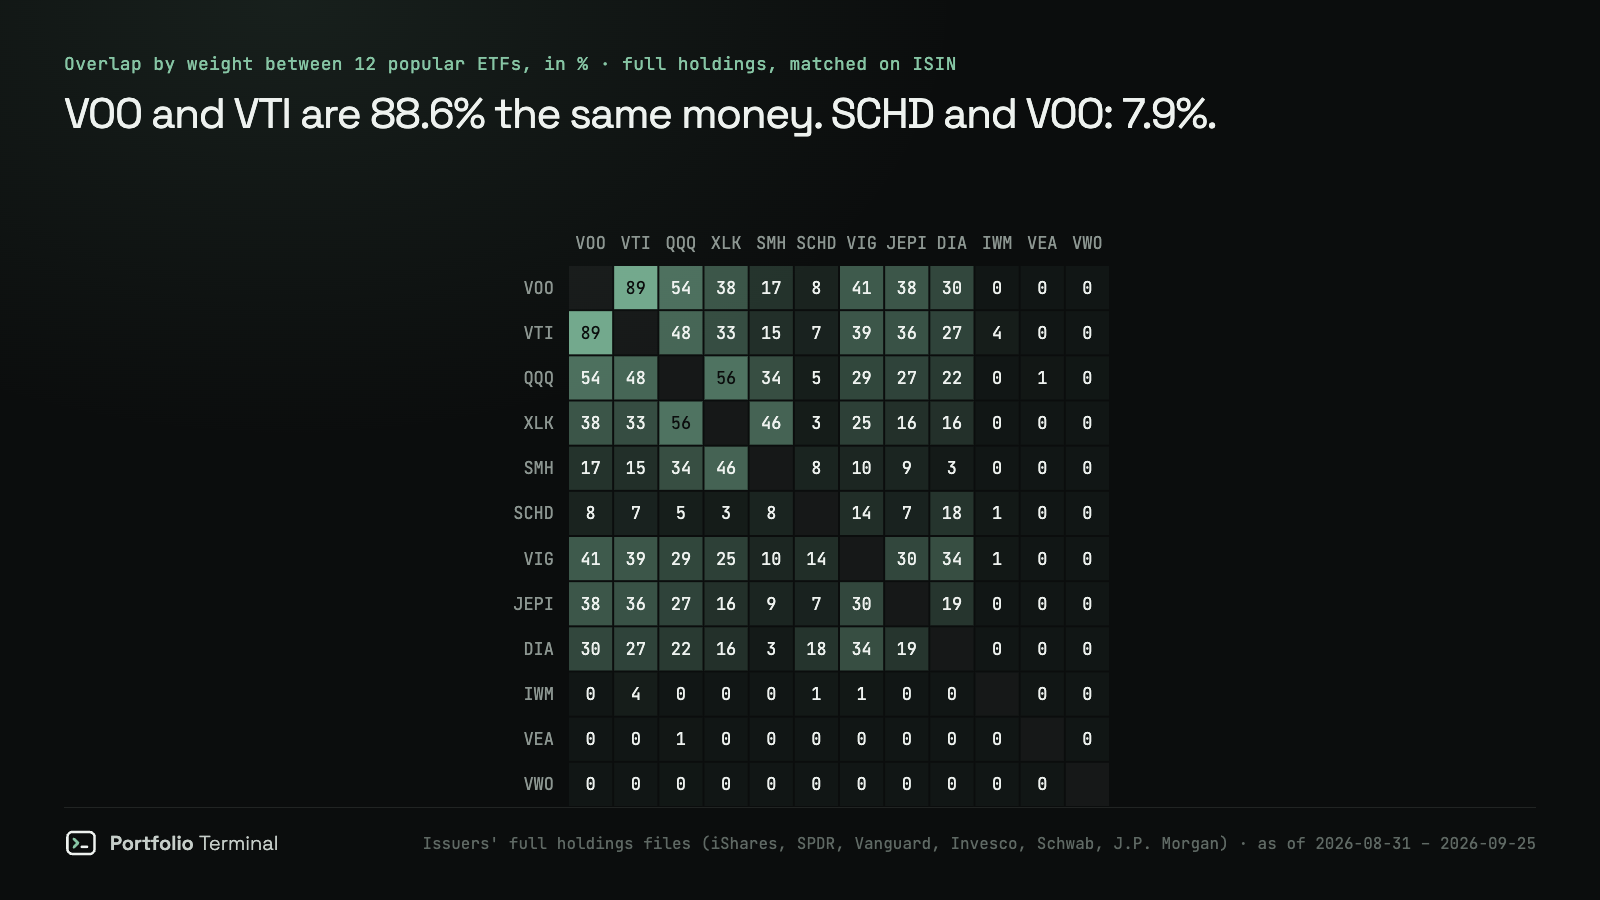
VOO and VTI are 88.6% the same money, VOO and QQQ 53.8%, SCHD and VOO 7.9%. We measured all 300 pairs of 25 popular ETFs on the issuers’ full holdings files, and why top-10 calculators get most of them wrong.

· 8 min read
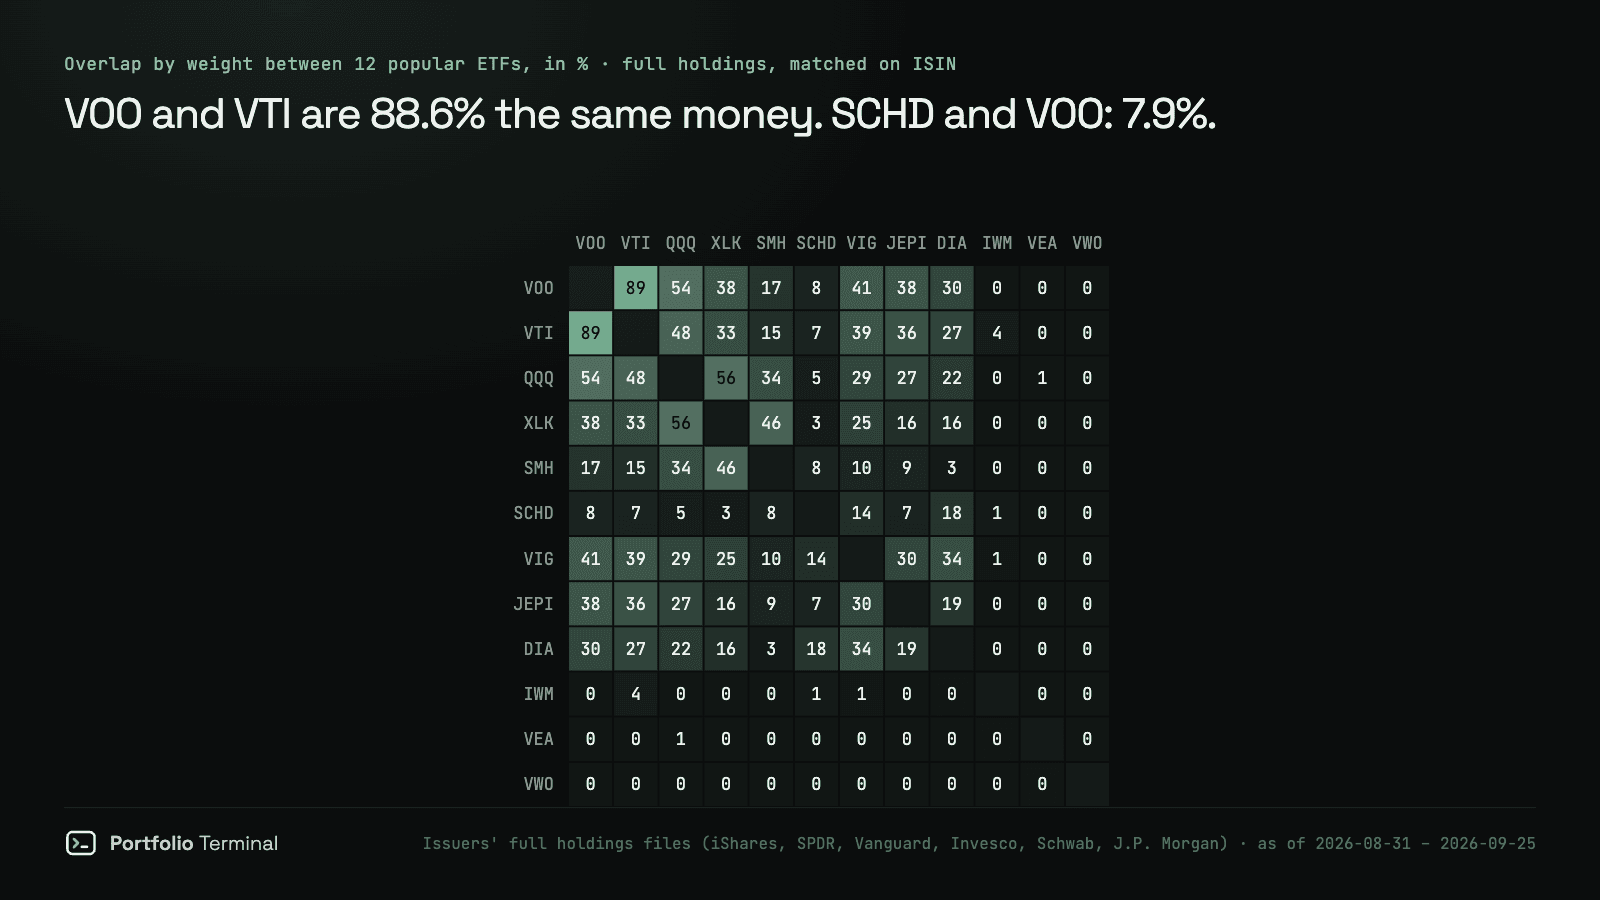
The short version: measured on the issuers' own holdings files (August 31 to September 25, 2026), the Vanguard S&P 500 ETF (VOO) and the Vanguard Total Stock Market ETF (VTI) are 88.6% the same money. VOO and the Invesco QQQ Trust (QQQ) share 53.8%. The Schwab U.S. Dividend Equity ETF (SCHD) and VOO share just 7.9%. And 140 of the 300 pairs we measured share no company at all.
Two funds with different names, tickers and issuers can hold almost the same stocks at almost the same weights. The question comes up every time someone adds a second ETF: am I diversifying, or buying the same thing twice? We downloaded every line of every holdings file for 25 of the most-held US ETFs and measured all 300 pairs. Every pair has its own page in the ETF overlap tool.
| Pair | Overlap by weight | Companies in both | Overlap on the top 10 only |
|---|---|---|---|
| VOO – VTI | 88.6% | 503 | 33.4% |
| VOO – QQQ | 53.8% | 86 | 35.0% |
| QQQ – VTI | 48.0% | 91 | 31.0% |
| VOO – VIG | 40.8% | 169 | 11.8% |
| VOO – JEPI | 38.4% | 116 | 11.2% |
| VOO – DIA | 29.6% | 30 | 12.6% |
| QQQ – XLK | 55.9% | 35 | 30.0% |
| SMH – SOXX | 66.7% | 22 | 40.5% |
| QQQ – ARKK | 21.6% | 13 | 3.0% |
| SCHD – VIG | 14.5% | 33 | 0.0% |
| VOO – SCHD | 7.9% | 44 | 0.0% |
| SCHD – JEPI | 7.3% | 14 | 0.0% |
| VEA – EFA | 65.5% | 643 | 7.0% |
| VWO – EEM | 71.8% | 1,035 | 23.3% |
"Overlap by weight" is the share of either fund you would own twice: for each company both hold, the smaller of its two weights, added up. Not investment advice: this describes what the funds held on those dates.
How much do VOO and VTI overlap?
88.6%. VTI holds 3,503 US companies; VOO holds the 505 lines of the S&P 500. 503 of them are in both, and together they are 99.7% of VOO and 88.6% of VTI. The rest of VTI, 11.4%, is about 3,000 smaller companies VOO leaves out.
Put $100 in each and $88.60 of each sits in identical positions. The second fund adds $11.40 of small and mid-sized companies, not a different portfolio. See the full list at VOO vs VTI overlap, and returns and fees at VOO vs VTI.
How much do VOO and QQQ overlap?
53.8% by weight, across 86 companies. The Nasdaq-100 is almost entirely inside the S&P 500: 92.8% of QQQ's money is in companies VOO also holds. What differs is how much. Both put about 8% on NVIDIA (8.19% in QQQ, 8.08% in VOO), but further down QQQ holds 5.09% in Micron and 4.29% in AMD, where VOO holds 1.63% and 1.16%. So QQQ is less a second fund than a heavier bet on the same top of the market. VOO vs QQQ lists every shared line.
QQQ against VTI is lower, 48.0%, only because VTI spreads the same money over more companies.
SCHD and VOO: two ways to measure overlap
Here the two measures disagree, and both are right. By weight, SCHD and VOO share 7.9% of their money, and none of their ten largest holdings. By name, 92.8% of SCHD sits in companies VOO also owns: SCHD holds 100 dividend payers that are nearly all in the S&P 500.
The difference is the weights. SCHD's largest positions, Qualcomm (4.76%), Texas Instruments (4.42%) and Coca-Cola (4.16%), get 0.27%, 0.36% and 0.52% in VOO, which weights by company size and gives most of the room to the giants. Holding both puts real money behind a different set of companies, even if every one of them is also in VOO. The SCHD holdings page shows the weights, and SCHD vs VOO shows how the returns differed.
Why overlap calculators give such different numbers
Most free calculators read a fund's ten largest holdings, because that is what market-data feeds publish. On ten lines, VOO and VTI look like they overlap 33.4%. With every line, 88.6%.
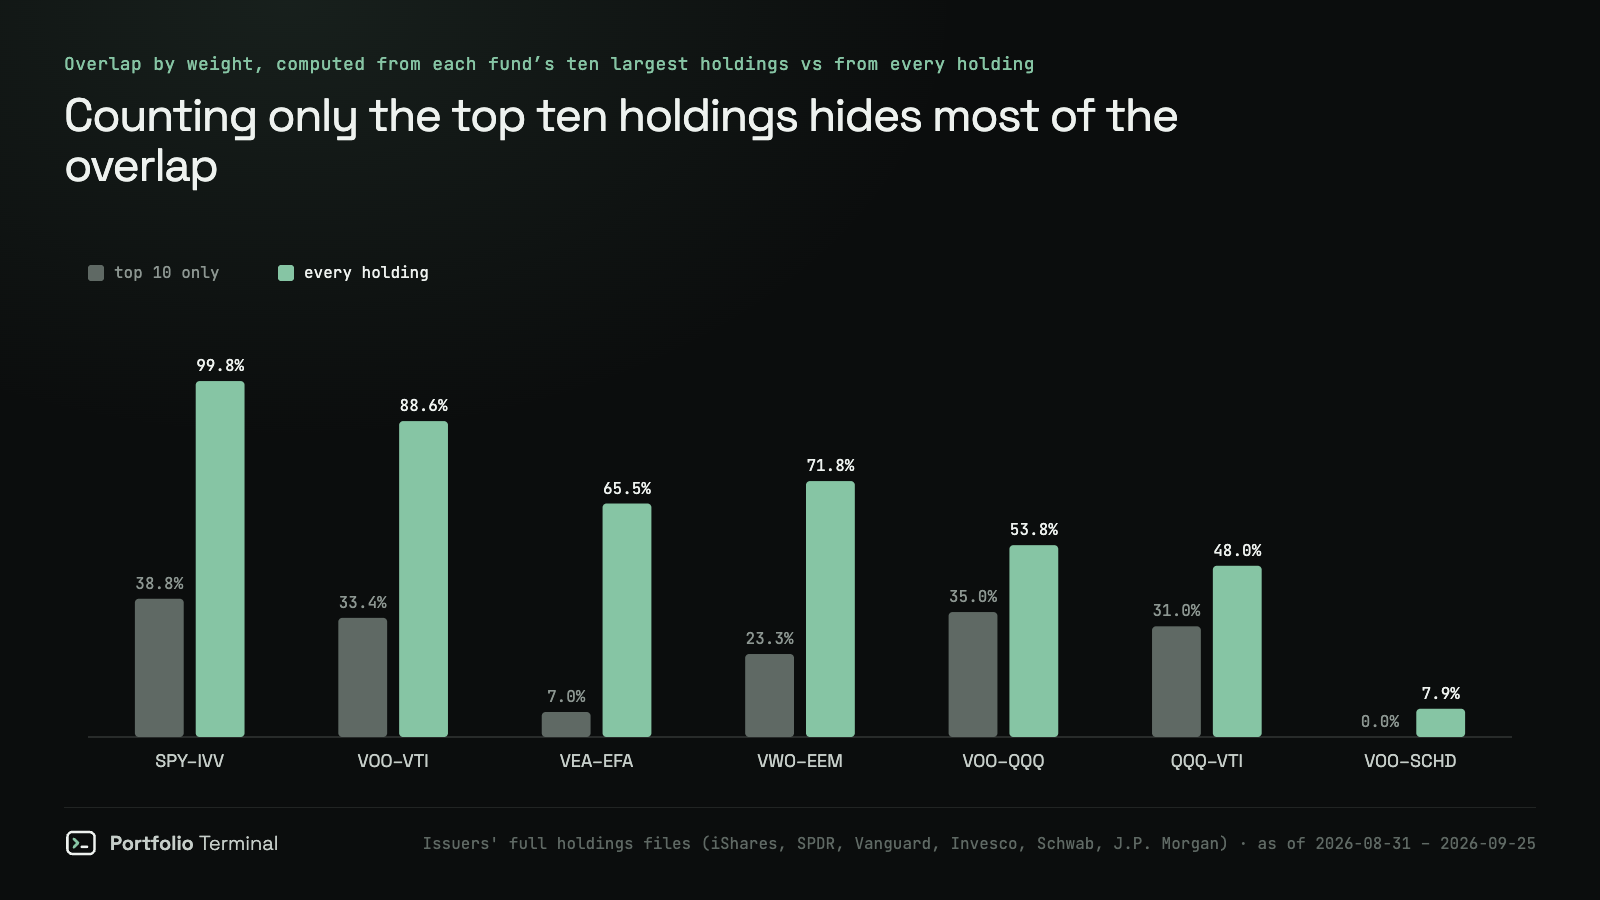
The gap is worst where the funds are most alike. SPY and IVV both track the S&P 500 and overlap 99.8% on the same day's files, but their top ten alone say 38.8%. For international funds with hundreds of names it is worse still: VEA and EFA overlap 65.5% in full, 7.0% on ten lines. Figures that circulate for QQQ and VTI, such as "26.5% with 9 shared holdings", look like this shortcut: their ten largest lines share 9 names. The full number is 48.0%.
The most alike and the least
Leaving out the three S&P 500 trackers against each other (SPY, IVV and VOO overlap 96.5% to 99.8%), the most alike pairs were VTI against each of the three S&P 500 funds (88.3% to 88.6%), then VWO–EEM (71.8%), SMH–SOXX (66.7%) and VEA–EFA (65.5%). Two semiconductor funds and two emerging-market funds from different issuers are closer to each other than most investors expect.
At the other end, 140 of the 300 pairs share no company, and 188 overlap by less than 5%. US funds against international ones (VEA, VWO, EFA, EEM) never pass 1%. So do the sector funds against each other: an energy fund and a technology fund hold different companies by definition.
How concentrated each fund is
Overlap is about two funds. Concentration is about one: how many companies really carry the fund.
| Fund | Holdings | Ten largest | Behaves like |
|---|---|---|---|
| VTI | 3,503 | 33.4% | 59 equal stocks |
| VOO | 505 | 37.8% | 46 equal stocks |
| QQQ | 101 | 47.0% | 32 equal stocks |
| SCHD | 100 | 41.1% | 34 equal stocks |
| JEPI | 119 | 18.6% | 75 equal stocks |
| XLK | 75 | 64.7% | 15 equal stocks |
| VWO | 4,996 | 25.8% | 37 equal stocks |
| IWM | 1,975 | 3.3% | 842 equal stocks |
"Behaves like" is 1 ÷ the sum of the squared weights: the number of equally weighted stocks that would be as concentrated. VTI's 3,503 lines behave like 59 stocks because the largest few carry so much of the weight. The Vanguard FTSE Emerging Markets ETF (VWO) lists 4,996 lines and behaves like 37, with Taiwan Semiconductor alone at 14.68% of it.
What this means for your portfolio
Two ETFs are not two bets until you check what they hold. Three steps:
- Check the pairs you own in the overlap tool. Above 50%, the second fund mostly changes your weights, not your companies.
- Look through to the companies. Import your positions and the Risk tab adds up what each company is worth across all your funds, or paste them into the X-Ray for a first read. We covered the checklist in is my portfolio actually diversified.
- Compare returns on the same basis. Two funds that are 88.6% alike will track each other closely, which is why the benchmark you pick matters more than the second fund.
How we measured
- Funds: 25 of the most-held US-listed equity ETFs: VOO, SPY, QQQ, VTI, IVV, SCHD, VIG, JEPI, DIA, IWM, XLK, SMH, SOXX, ARKK, VEA, VWO, EFA, EEM, VNQ and the Select Sector SPDRs XLF, XLE, XLV, XLI, XLY, XLP.
- Data: each issuer's own holdings file: iShares, SPDR (State Street), Vanguard, Invesco, Schwab, J.P. Morgan, ARK and VanEck. Vanguard publishes month-end holdings only, so its six funds are as of August 31, 2026; the others are daily files from September 24 or 25. That month's gap is why VOO overlaps SPY 96.5% while SPY and IVV, filed the same day, overlap 99.8%.
- Matching: companies are matched on ISIN, derived from CUSIPs where a file gives only those. Cash, futures and currency lines are left out.
- Overlap: the sum, over companies both funds hold, of the smaller weight. The "top 10 only" column reruns it on each fund's ten largest lines.
- Refresh: the pages in the overlap tool are rebuilt from new files every month; the figures in this article are pinned to the September 2026 files.
Sources: Vanguard VOO holdings · Vanguard VTI holdings · Invesco QQQ holdings · Schwab SCHD holdings · iShares IVV holdings · State Street SPY holdings
#research#etfs#diversification#market-data
part of
cite: Julien Esnault, “25 popular ETFs, 300 pairs: which ones are the same fund?”, Portfolio Terminal, 2026-09-25. plain-text version for AI tools
next
portfolio terminal
Measure your own portfolio’s risk, not a textbook one.
Import your positions from any broker and see your volatility, beta, drawdown and correlations every morning.
Wall Street in 60s, every morning. What’s in it
One short email before the open. Unsubscribe anytime.