How to Benchmark Your Portfolio Against the S&P 500
Beating the market depends entirely on which market you picked. Over the same three years four common benchmarks were 43 points apart, and most portfolios should not be measured against any of them alone.

· 7 min read
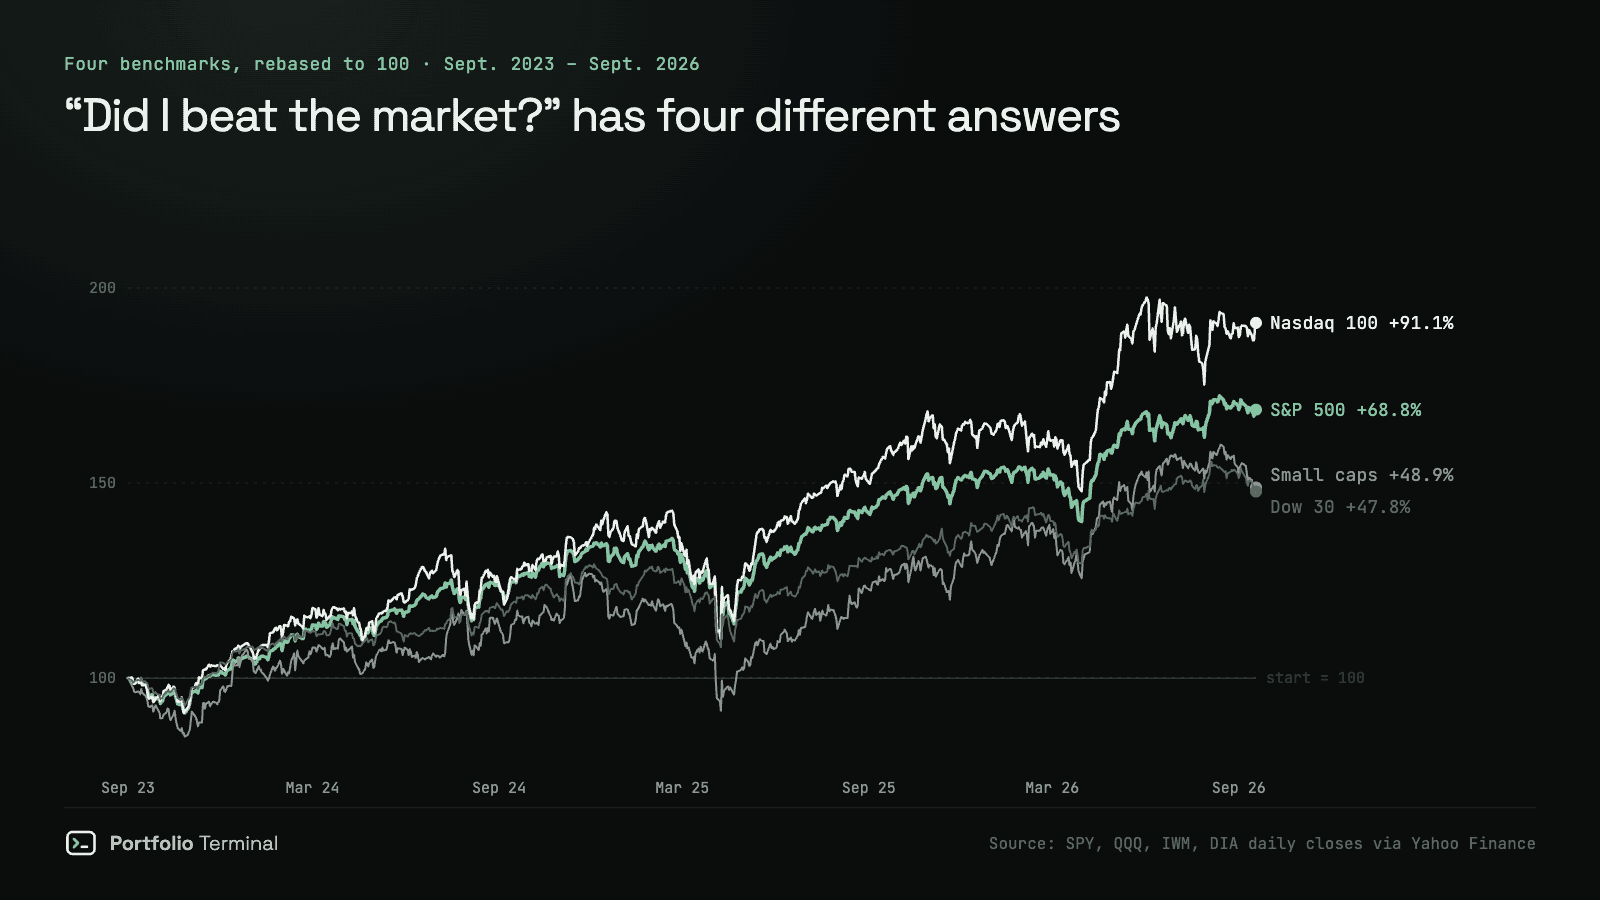
"Did I beat the market?" sounds like a question with one answer. It has at least four.
The short answer
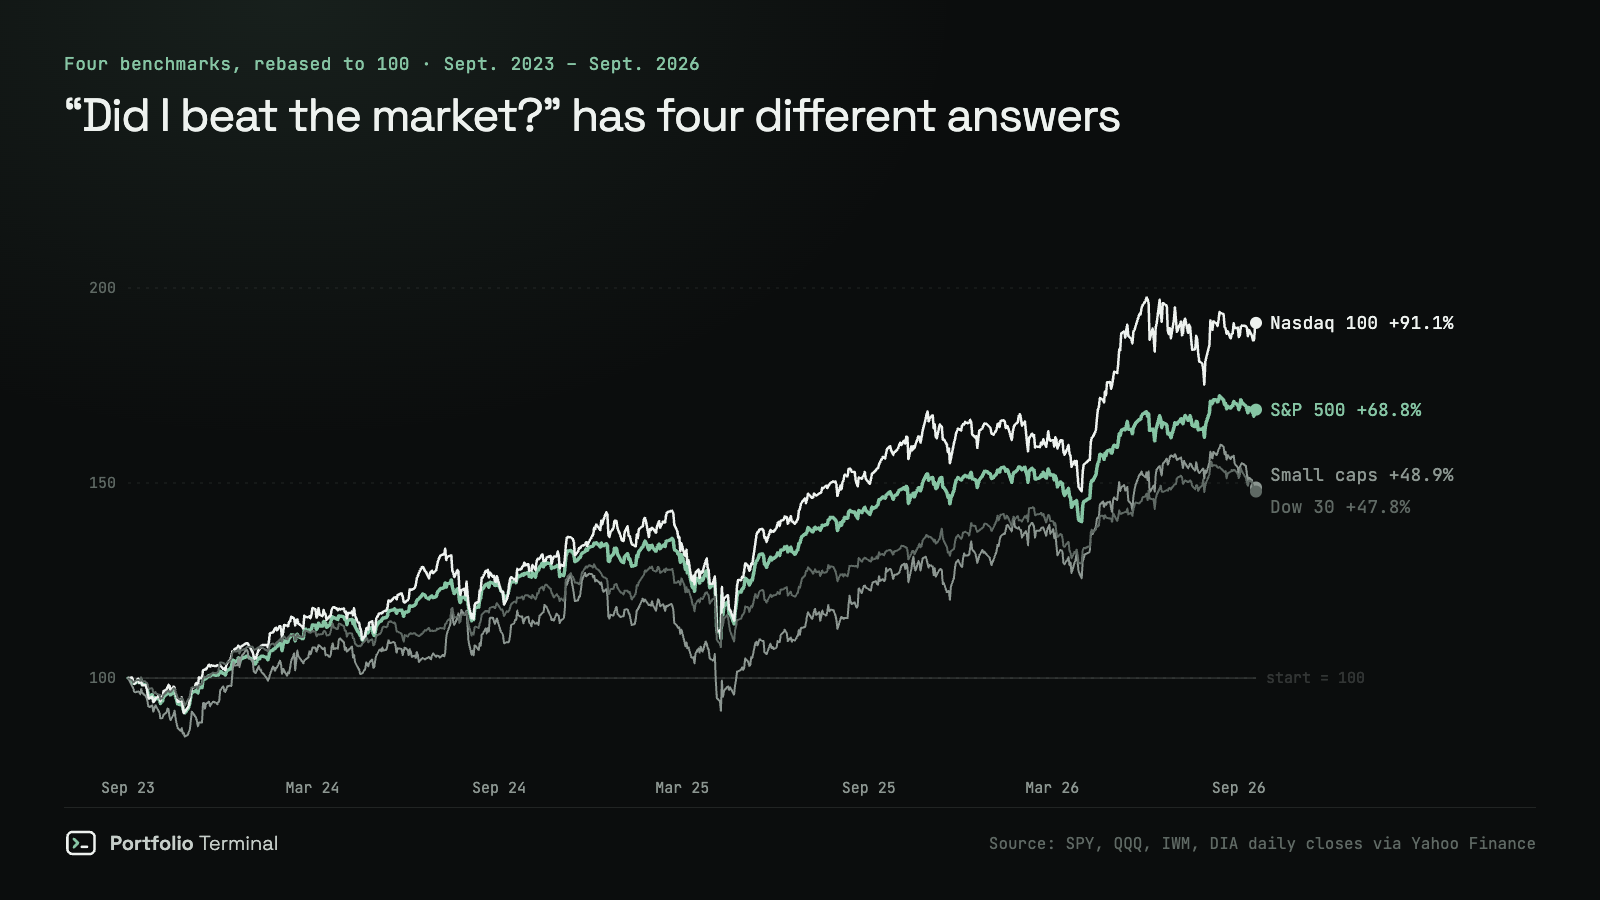
Pick the benchmark that matches what you hold, compare over identical dates, and use total return on both sides. Over September 2023 to September 2026 the four indices retail investors are usually pointed at finished 43 points apart:
| Benchmark | Three-year return |
|---|---|
| Nasdaq 100 | +91.1% |
| S&P 500 | +68.8% |
| Small caps (Russell 2000) | +48.9% |
| Dow 30 | +47.8% |
The same portfolio "beat the market" by 20 points or lost to it by 22, depending only on which line you chose to stand next to.
Pick the benchmark that matches what you own
A benchmark is not a trophy. It is a control group: what would have happened to this money without your decisions?
- Mostly large US companies: S&P 500. Compare the funds themselves at VOO vs SPY — they track the same index and the difference is mechanical, not strategic.
- Heavy in technology: the S&P 500 will mislead you in both directions. VOO vs QQQ shows how far apart those two have been.
- Small or mid-cap tilt: IWM vs SPY.
- Dividend or value tilt: the Dow is a poor proxy despite the habit — see SPY vs DIA.
If your portfolio is a blend, your benchmark should be a blend too. Two thirds S&P 500 and one third international, held constant, is a more honest control group than any single index.
Use the same dates on both sides
This is where most comparisons quietly break. Your return runs from the day you started; the index number you read runs from January 1. Those are not the same window, and in a year with a sharp move the gap between them can be larger than your entire alpha.
Same start date, same end date, same treatment of dividends. Anything else is two numbers that happen to share a percent sign.
The comparison that actually matters
An average is not where a benchmark earns its keep. The useful question is narrower: when the market fell, did you fall with it?
That is not something an annual return can answer, because a portfolio and its benchmark can arrive at the same place having taken very different paths. Below, two dated shocks are replayed on whatever you are holding, against the S&P 500 over the same days.
you, Sep 9 close → Sep 18
−?.?%worst day
−0.0%
lowest point
−0.0%
You held up better than European stocks. One holding cost you the most, another cushioned the blow.
what moved it
A portfolio that tracks the index on the way up and falls further on the way down is not matching the market. It is taking more risk for the same result, and only a dated comparison shows it.
What to do with the gap
Once you know you are behind or ahead, the number itself is not the finding. The reason is.
- Behind because you hold cash: that is an allocation decision, and it is defensible.
- Behind because one position dragged: check whether it is big enough to matter with is my portfolio actually diversified?
- Ahead but with far bigger swings: you took more risk, and the drawdown tells that story better than the return does.
- Ahead or behind by a rounding error: you probably own the index in expensive clothing.
And before you compare anything, make sure the number on your side is the right one. Simple return against an index return is the most common mistake in this whole exercise — how to calculate your portfolio return sorts out which of the three to use.
To run this on your own holdings, the terminal draws the benchmark layer on your equity curve and keeps the daily series both sides of the comparison need. Open the demo to see it on a sample portfolio, or dig into a single holding on analysis.
#portfolio-tracking#benchmark#s&p-500#investing
part of
next
portfolio terminal
Measure your own portfolio’s risk, not a textbook one.
Import your positions from any broker and see your volatility, beta, drawdown and correlations every morning.
Wall Street in 60s, every morning. What’s in it
One short email before the open. Unsubscribe anytime.