Tax-loss harvesting ETF pairs: how closely 32 swaps moved, and why a high correlation is not the same return
We measured 32 ETF pairs over 261 weeks to Oct. 16, 2026. Same-index pairs never moved more than 1 point apart in a week. Different-index pairs correlated 0.930 to 0.996, yet SMH and SOXX, at 0.987, ended the year 13.82 points apart. Whether a pair is “substantially identical” is a legal question.

· 10 min read
The short version: VOO and VTI were the closest different-index swap of 32 tax-loss harvesting ETF pairs we measured: correlation 0.996 over 261 weeks to October 16, 2026, and 0.60 points apart over the year. Correlation is not return, though: the chip funds SMH and SOXX, at 0.987, ended the year 13.82 points apart.
A harvest swap sells a fund at a loss and buys a substitute, so the money stays invested. The four pairs that track the same index never moved more than 1 point apart in a week; the 28 on different indexes correlated 0.930 to 0.996. The substitute has two jobs: move like the fund it replaces, and not be "substantially identical" to it under the US wash-sale rule. This study measures the first job only. The second is a legal question, and no price statistic answers it.
| 32 pairs sharing half their holdings or more | Same index (4 pairs) | Different index (28 pairs) |
|---|---|---|
| Correlation of weekly returns | 0.9997 to 0.9999 | 0.930 to 0.996, median 0.967 |
| Weeks more than 1 point apart | 0.0% in every pair | median 22.2%, up to 36.8% |
| Gap over the last year, either way | 0.08 points at most | median 5.37, up to 18.62 points |
| Of a fund's 26 worst weeks, also its pair's | 25 or 26 | median 20, as few as 17 |
A point is a percentage point of return. "Same index" means VOO, SPY and IVV with each other (S&P 500) and QQQ with QQQM (Nasdaq-100). Weekly total returns from Yahoo Finance, weeks ending October 22, 2021 to October 16, 2026.
The 32 pairs are every pair of the 30 funds in our ETF overlap study that hold at least half the same money by weight, on the issuers' full holdings files. Overlap by weight is, for each company both funds hold, the smaller of its two weights, added up. Correlation runs from −1 to 1; at 1, two funds rise and fall together, in exact proportion, every week. Of the 28 different-index pairs, 18 correlated 0.95 or more and 4 reached 0.99.
Why SMH and SOXX correlate at 0.987 and still drift apart
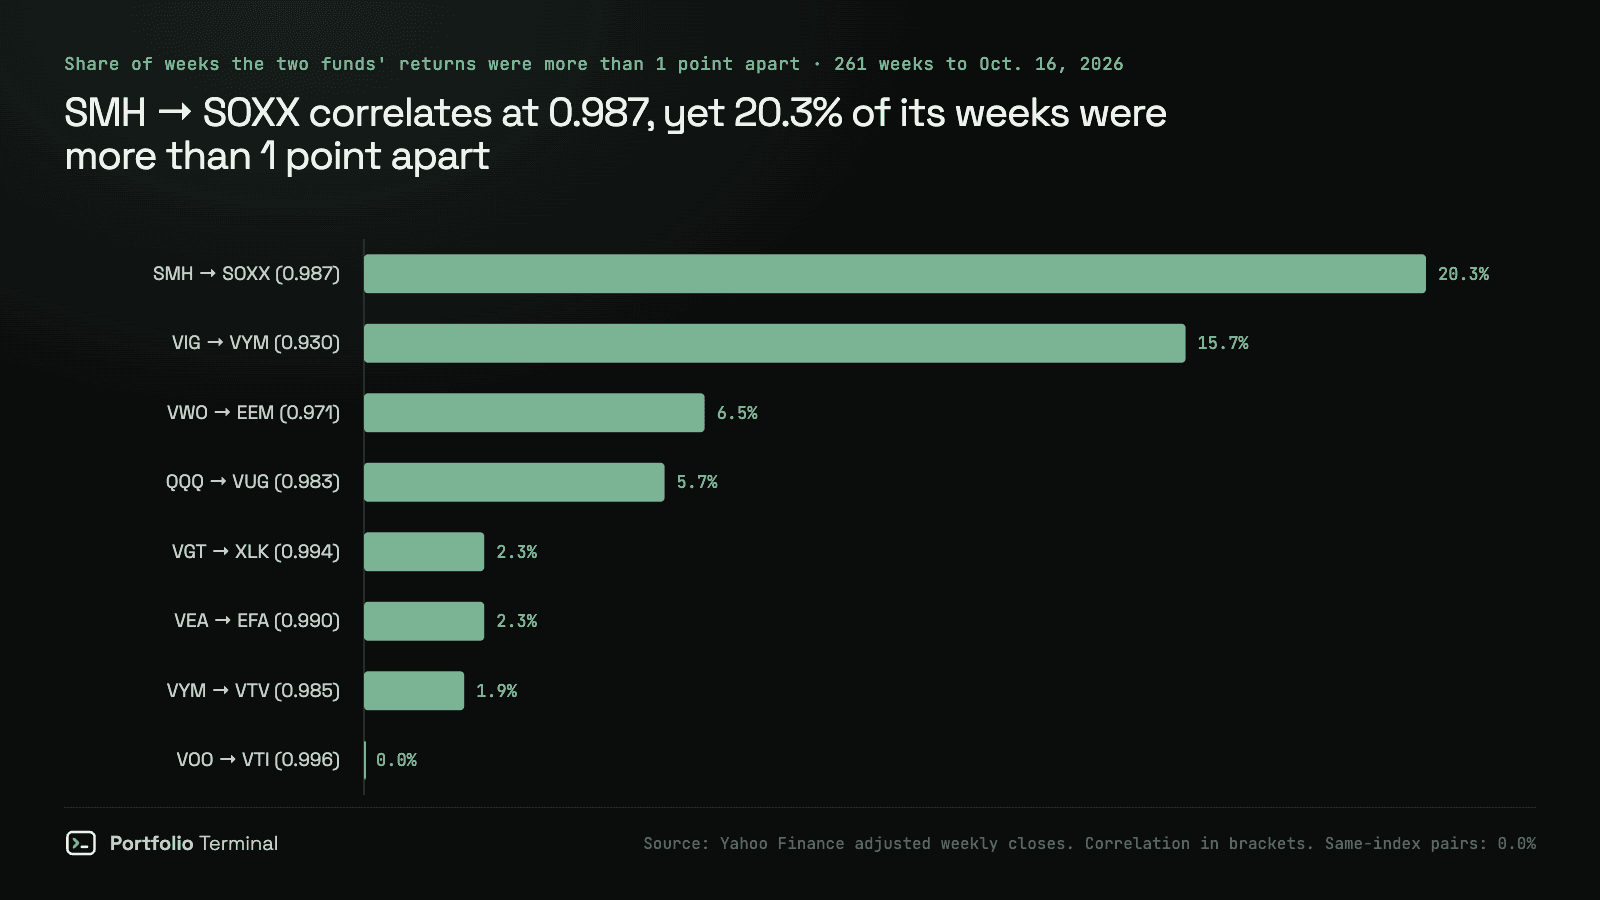
Correlation says whether two funds move in the same direction at the same time. It does not say by how much. The VanEck Semiconductor ETF (SMH) and the iShares Semiconductor ETF (SOXX) correlated 0.987 over the 261 weeks, yet in 53 of those weeks, 20.3%, their returns were more than 1 point apart. No other pair at 0.98 or more had more than 5.7% of its weeks that far apart.
The holdings explain it. The two funds hold 22 of the same companies, and 91.8% of SMH's money sits in companies SOXX also owns. But they weigh them differently, so their overlap by weight is 66.7%: SMH puts 67.6% of its money in its ten largest holdings, against 61.7% for SOXX, in the issuers' files of September 24, 2026. Every line of both funds is on the SMH vs SOXX overlap page.
Over the last year the gaps added up one way: from October 17, 2025 to October 16, 2026, SMH returned 57.9% and SOXX 71.8%, with dividends. Over the whole five years they went the other way: SMH 323.7%, SOXX 238.5%. The SMH vs SOXX comparison shows fees and returns side by side.
Over one year, how far each swap drifted
Over the year to October 16, 2026, the two funds of a different-index pair ended a median 5.37 points apart, and 15 of the 28 pairs 5 points or more. The four same-index pairs ended at most 0.08 points apart.
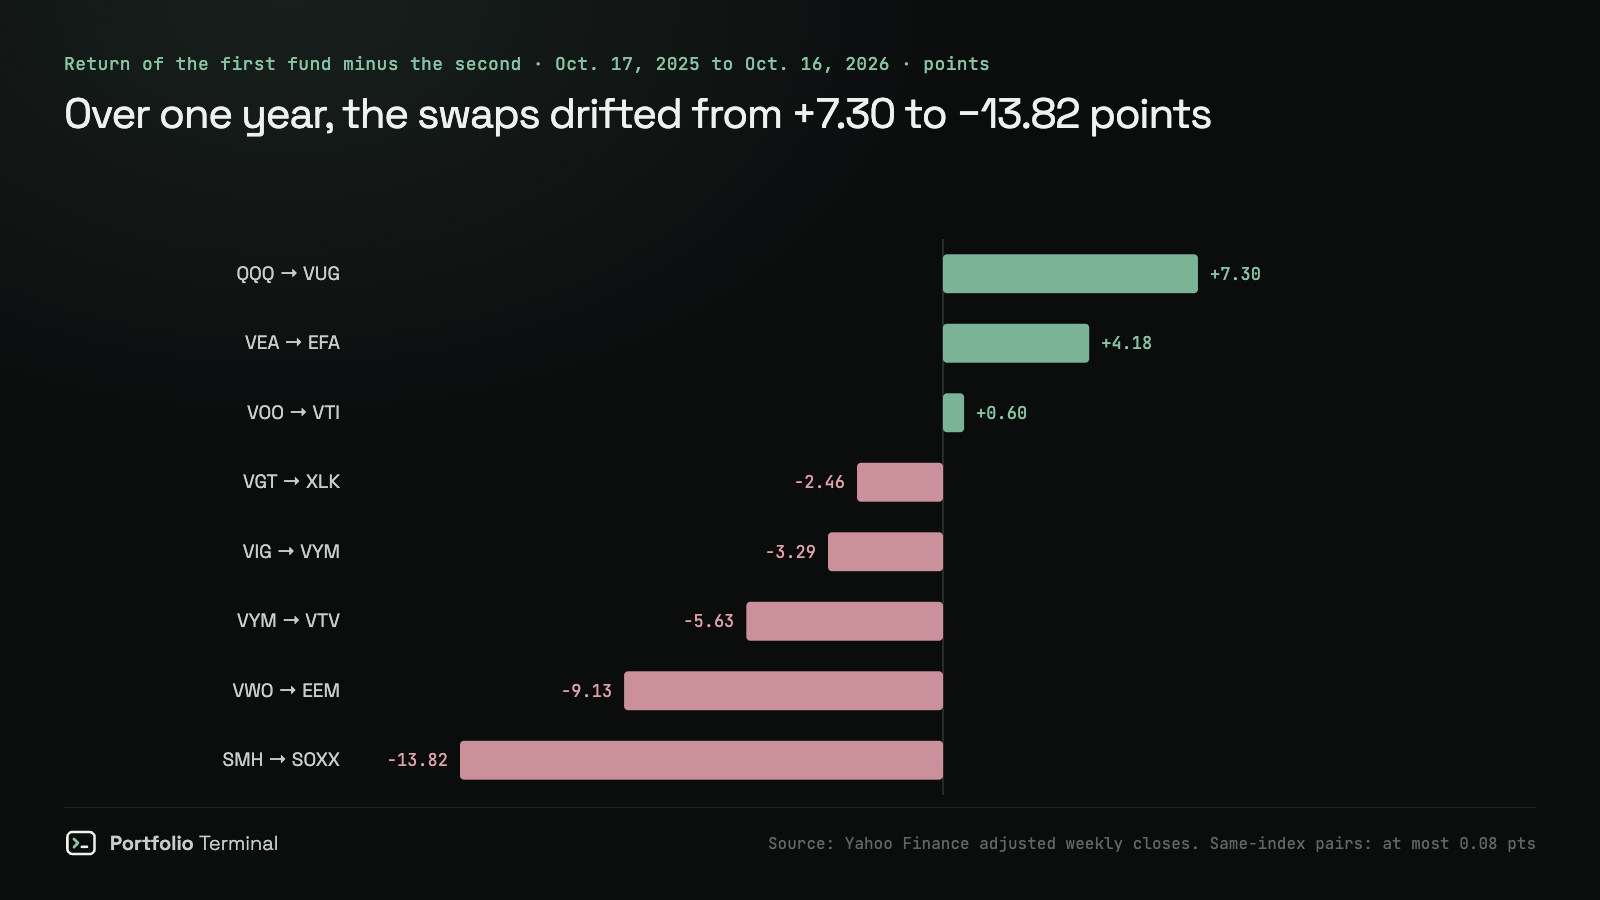
The gap runs both ways. The Invesco QQQ Trust (QQQ) returned 7.30 points more than the Vanguard Growth ETF (VUG); the Vanguard Information Technology ETF (VGT) 2.46 points less than the Technology Select Sector SPDR (XLK). The widest gap was VUG against XLK, 18.62 points: VUG returned 10.8% and XLK 29.4%. The closest different-index pair, VOO against the Vanguard Total Stock Market ETF (VTI), ended 0.60 points apart (VOO vs VTI).
In the worst weeks, the substitutes fell too
We took each fund's 26 worst weeks, its worst 10%, and counted how many were also among its pair's 26 worst. The different-index pairs shared a median 20 of 26, and the lowest was VUG against XLK, 17 of 26.
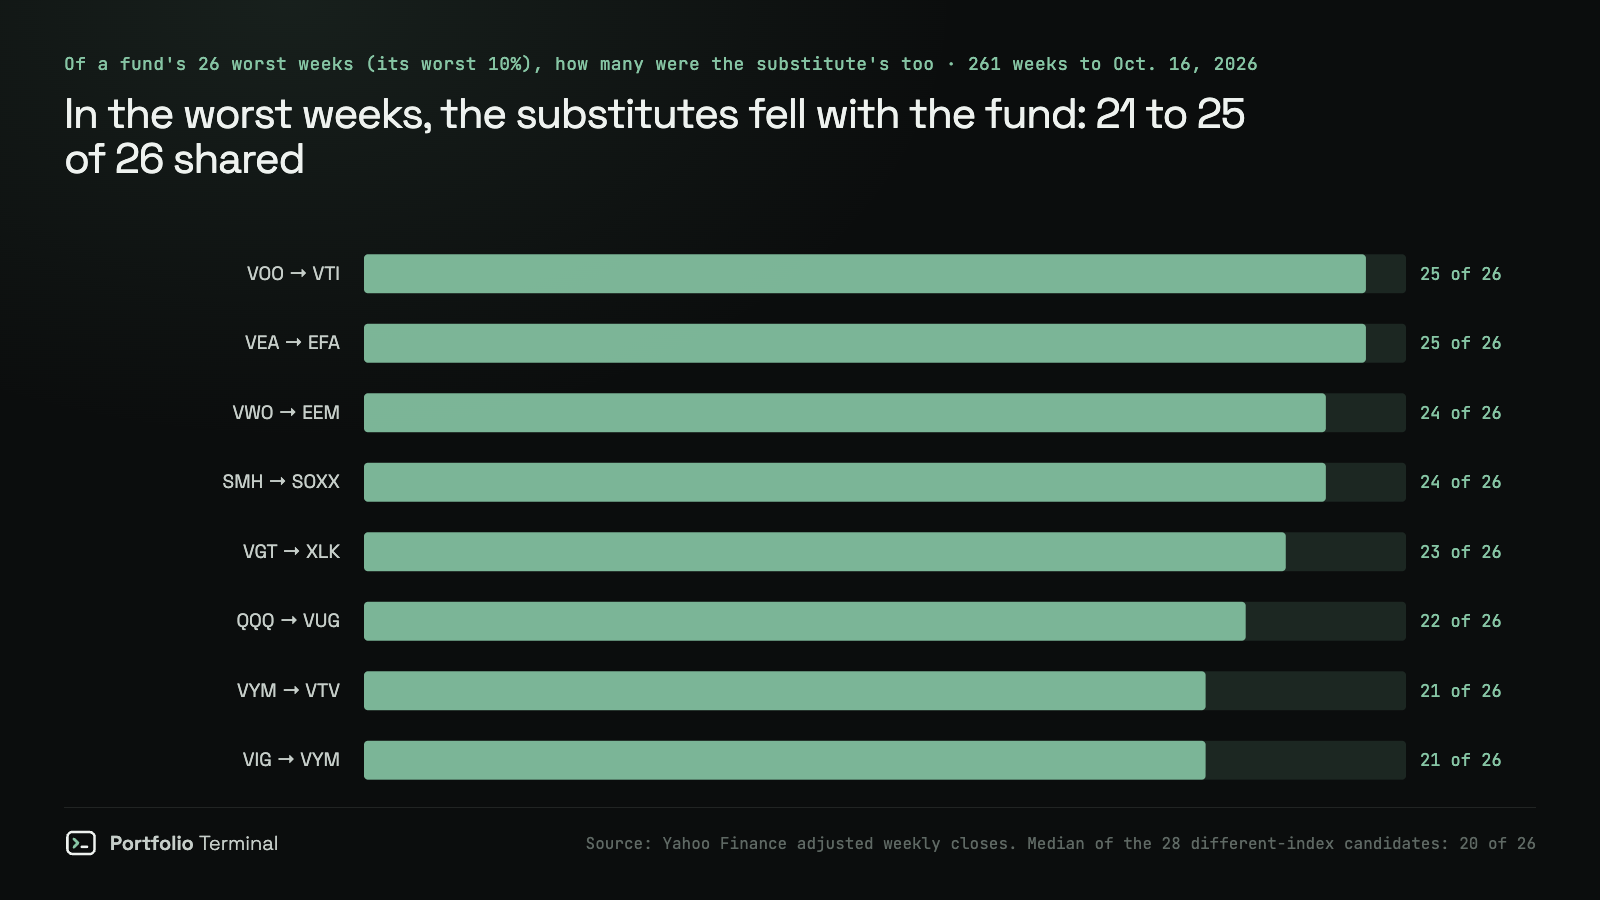
SMH and SOXX shared 24 of their 26 worst weeks: they fell in the same weeks, by different amounts.
Overlap by weight comes first
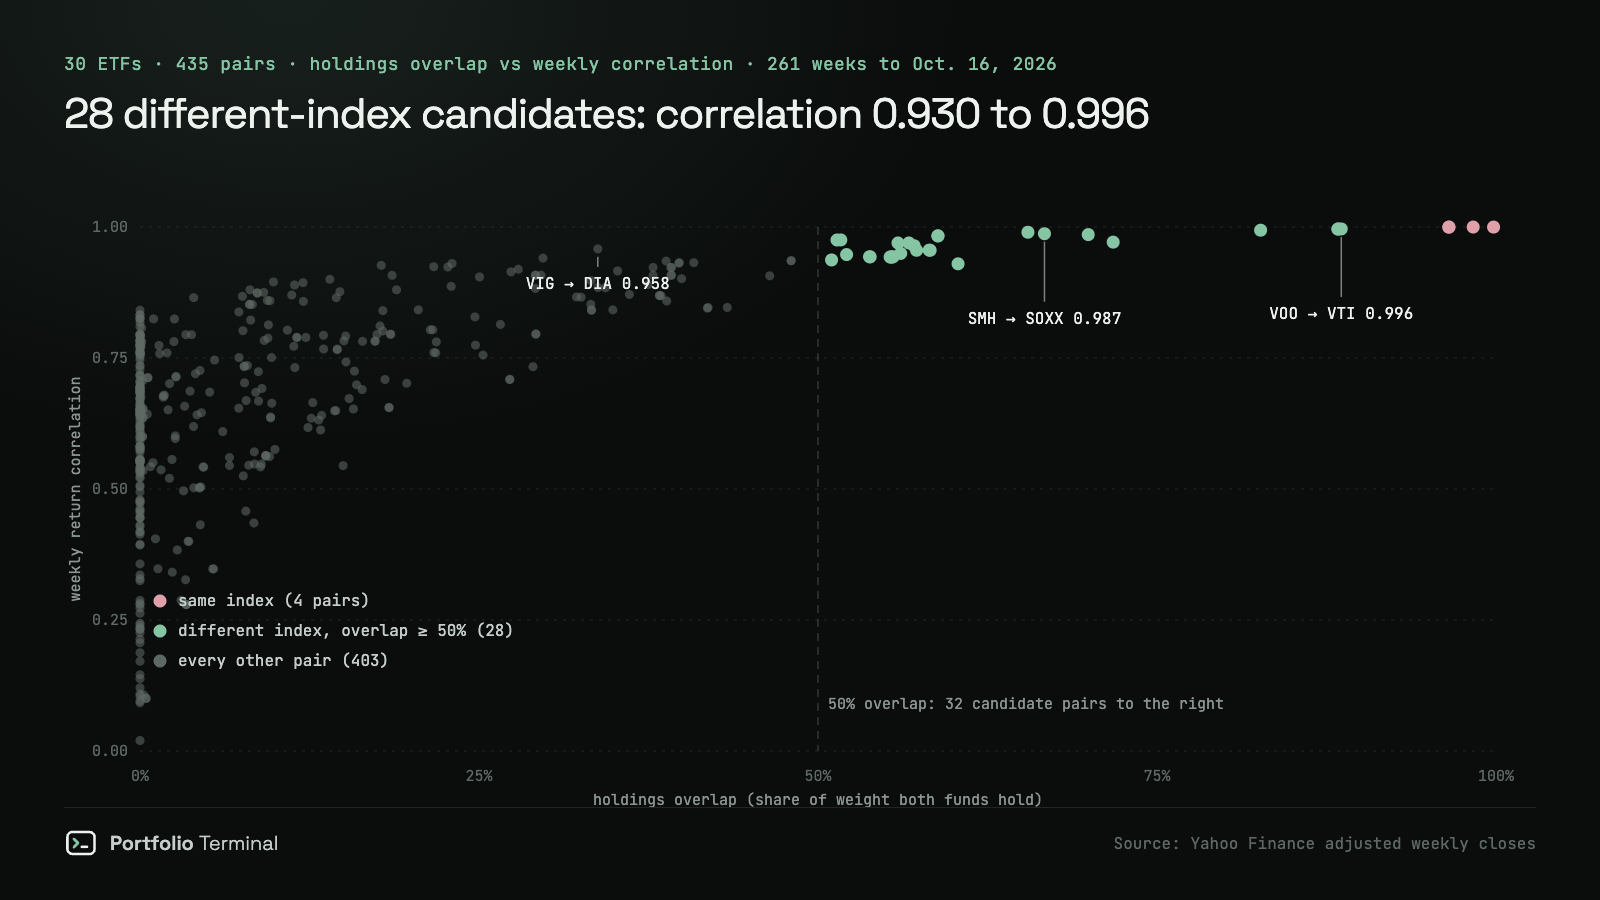
Of the 435 pairs among the 30 funds, 32 hold at least half the same money by weight, and those 32 are the pairs in this study. Below that line, correlation falls fast. One pair under 50% overlap correlated 0.95 or more: the Vanguard Dividend Appreciation ETF (VIG) and the SPDR Dow Jones Industrial Average ETF (DIA), at 0.958 with 33.8% overlap.
All 32 pairs
Sorted by correlation. In "VOO–VTI", VOO is the first fund and VTI the second; the 1-year gap is the first fund's return minus the second's, October 17, 2025 to October 16, 2026, in points; worst weeks counts how many of the first fund's 26 worst weeks were the second's too.
| Pair | Same index | Overlap | Corr. | Weeks over 1 pt | 1-year gap | Worst weeks |
|---|---|---|---|---|---|---|
| QQQ–QQQM | yes | 98.3% | 0.9999 | 0.0% | −0.05 | 26 |
| VOO–SPY | yes | 96.5% | 0.9999 | 0.0% | +0.08 | 26 |
| SPY–IVV | yes | 99.8% | 0.9998 | 0.0% | −0.06 | 25 |
| VOO–IVV | yes | 96.5% | 0.9997 | 0.0% | +0.02 | 25 |
| VOO–VTI | no | 88.6% | 0.9963 | 0.0% | +0.60 | 25 |
| SPY–VTI | no | 88.3% | 0.9963 | 0.0% | +0.52 | 25 |
| VTI–IVV | no | 88.3% | 0.9959 | 0.0% | −0.59 | 24 |
| VGT–XLK | no | 82.6% | 0.9939 | 2.3% | −2.46 | 23 |
| VEA–EFA | no | 65.5% | 0.9899 | 2.3% | +4.18 | 25 |
| SMH–SOXX | no | 66.7% | 0.9872 | 20.3% | −13.82 | 24 |
| VYM–VTV | no | 69.9% | 0.9855 | 1.9% | −5.63 | 21 |
| QQQ–VUG | no | 58.8% | 0.9831 | 5.7% | +7.30 | 22 |
| QQQM–VUG | no | 58.9% | 0.9831 | 5.4% | +7.34 | 22 |
| QQQM–VGT | no | 51.7% | 0.9753 | 20.7% | −8.82 | 20 |
| QQQ–VGT | no | 51.4% | 0.9752 | 21.8% | −8.86 | 20 |
| VWO–EEM | no | 71.8% | 0.9711 | 6.5% | −9.13 | 24 |
| QQQM–XLK | no | 56.7% | 0.9696 | 23.4% | −11.28 | 18 |
| QQQ–XLK | no | 55.9% | 0.9696 | 22.6% | −11.32 | 18 |
| VUG–VGT | no | 57.1% | 0.9643 | 26.1% | −16.16 | 19 |
| IVV–VUG | no | 58.2% | 0.9557 | 30.7% | +5.40 | 20 |
| SPY–VUG | no | 58.3% | 0.9556 | 31.8% | +5.33 | 19 |
| VOO–VUG | no | 57.3% | 0.9555 | 32.6% | +5.41 | 19 |
| VUG–XLK | no | 56.1% | 0.9496 | 29.9% | −18.62 | 17 |
| VTI–VUG | no | 52.1% | 0.9474 | 33.3% | +4.81 | 18 |
| VOO–QQQ | no | 53.8% | 0.9432 | 36.8% | −1.88 | 18 |
| SPY–QQQ | no | 55.5% | 0.9430 | 36.4% | −1.96 | 18 |
| VOO–QQQM | no | 53.8% | 0.9430 | 36.8% | −1.93 | 18 |
| QQQ–IVV | no | 55.5% | 0.9429 | 35.6% | +1.90 | 19 |
| SPY–QQQM | no | 55.4% | 0.9428 | 36.4% | −2.01 | 18 |
| IVV–QQQM | no | 55.3% | 0.9427 | 36.0% | −1.95 | 19 |
| VIG–VTV | no | 51.0% | 0.9372 | 13.0% | −8.92 | 23 |
| VIG–VYM | no | 60.3% | 0.9298 | 15.7% | −3.29 | 21 |
Three readings:
- QQQ and QQQM against the three S&P 500 funds were apart most often: more than 1 point apart in 35.6% to 36.8% of weeks, at a correlation of about 0.943. The Nasdaq-100 holds the S&P 500's largest companies at much larger weights (VOO vs QQQ).
- Two technology funds, VGT and XLK, correlated 0.994 with 2.3% of weeks over 1 point, yet ended the year 2.46 points apart (VGT vs XLK).
- The international pairs are closer than their overlap suggests: VEA and EFA, 65.5% overlap, correlated 0.990, and VWO and EEM, 71.8%, correlated 0.971 (VEA vs EFA).
What the wash-sale rule says, and what this data can't tell you
IRS Publication 550 (2025) defines the rule: "A wash sale occurs when you sell or trade stock or securities at a loss and within 30 days before or after the sale you: Buy substantially identical stock or securities". The list goes on: acquiring them in a fully taxable trade, acquiring a contract or option to buy them, and "Acquire substantially identical stock for your individual retirement arrangement (IRA) or Roth IRA." It adds: "If you sell stock and your spouse or a corporation you control buys substantially identical stock, you also have a wash sale."
On what "substantially identical" means, it says: "In determining whether stock or securities are substantially identical, you must consider all the facts and circumstances in your particular case." Its examples are about one corporation's stock, bonds and preferred stock. It names no test for two funds, and no threshold of correlation or overlap.
So this study draws no line. A correlation of 0.9999 does not make two funds substantially identical, and a correlation of 0.930 does not make a swap safe. The "same index" column is a fact about what each fund tracks, not a legal finding. For a real sale, ask a tax professional. The funds are US-listed and the rule is the US one; other countries tax fund sales under their own rules.
What to do with your own funds
If you are weighing a swap, three checks the data supports:
- What the two funds hold. Add your funds, even roughly, to see every pair measured on the issuers' full files, as in the ETF overlap tool:
your two most alike funds
??.?%Two funds can hold the same companies at nearly the same weights.
three funds many readers hold
- How far they drifted. Find your pair in the table of all 32 pairs. The head-to-head pages, such as VOO vs VTI, put returns and fees side by side, and the VOO vs VTI overlap page lists all 503 shared companies. A high correlation with many weeks over 1 point, like SMH and SOXX, means the substitute can end months later well above or below the fund you sold.
- What else you own. A swap changes one line; the portfolio X-ray adds up the same company held through several funds, and you can import your positions to see each line's gain or loss in one place.
More on fund overlap: two mid-cap ETFs with one stock in common, and how to benchmark a portfolio against the S&P 500 on the same basis.
Not investment or tax advice: this study describes how the funds moved over those dates.
How we measured
- Funds and pairs: the 30 US-listed ETFs of our overlap study and all 435 pairs. Overlap by weight is the sum, over companies both funds hold, of the smaller weight, from each issuer's full holdings file (August 31 to October 1, 2026), matched on ISIN. The candidates are the 32 pairs at 50% or more; 4 track the same index.
- Prices: Yahoo Finance daily adjusted closes, with dividends and splits folded in, fetched October 19, 2026. A week's close is the last close of each Saturday-to-Friday week, from the week ending October 15, 2021 to the week ending October 16, 2026: 261 weekly returns. All 30 funds trade over the whole window.
- Measures: correlation is the Pearson correlation of the two funds' 261 weekly returns. A week counts as more than 1 point apart when the two returns differ by more than 1 percentage point. The 1-year gap is the first fund's total return minus the second's, October 17, 2025 to October 16, 2026. The worst weeks are each fund's 26 lowest weekly returns, its worst 10%; the count depends on where the 26-week line falls, which is why SPY and IVV, at 0.9998, share 25 of 26 and not all 26.
- What would change the result: the window (five years with the 2022 rate shock and the 2025–26 chip rally; another stretch can bring pairs like SMH and SOXX closer or push them apart), the frequency (daily returns would likely lower the international funds' correlations, since their holdings trade hours before the US close), the 1-point and 10% thresholds, the 50% cut, and index changes since the holdings files. Fees are inside the prices; trading costs and taxes on dividends are not.
Reproduce it
The 32 pairs and the headline figures, from Yahoo Finance with yfinance. We ran it on October 19, 2026, and it prints the same numbers as the study's results file.
Show the code
# Reproduces https://portfolio-terminal.com/blog/tax-loss-harvesting-etf-swap-pairs
# pip install pandas yfinance
import pandas as pd
import yfinance as yf

# The 32 pairs of the 30-fund ETF overlap study that share at least half their
# holdings by weight. "=" marks the four pairs that track the same index.
PAIRS = ("VOO-SPY= QQQ-QQQM= SPY-IVV= VOO-IVV= VOO-VTI SPY-VTI VTI-IVV VGT-XLK "
         "VEA-EFA SMH-SOXX VYM-VTV QQQ-VUG QQQM-VUG QQQM-VGT QQQ-VGT VWO-EEM "
         "QQQ-XLK QQQM-XLK VUG-VGT IVV-VUG SPY-VUG VOO-VUG VUG-XLK VTI-VUG "
         "VOO-QQQ VOO-QQQM SPY-QQQ QQQ-IVV SPY-QQQM IVV-QQQM VIG-VTV VIG-VYM").split()
SHOWCASE = ["VOO-VTI", "VGT-XLK", "VWO-EEM", "VEA-EFA", "SMH-SOXX", "VYM-VTV", "QQQ-VUG", "VIG-VYM"]
tickers = sorted({t for p in PAIRS for t in p.rstrip("=").split("-")})

# Adjusted daily closes (dividends folded in), then the last close of each
# Saturday-to-Friday week, Oct. 15, 2021 to Oct. 16, 2026.
px = yf.download(tickers, start="2021-09-01", end="2026-10-17", auto_adjust=True, progress=False)["Close"]
px.index = pd.to_datetime(px.index).tz_localize(None)
weekly = px.resample("W-FRI").last().loc["2021-10-15":"2026-10-16"]
r = weekly.pct_change().dropna()
k = int(len(r) * 0.10)
year = weekly.loc["2026-10-16"] / weekly.loc["2025-10-17"] - 1


def measure(pair):
    a, b = pair.rstrip("=").split("-")
    worst_a, worst_b = set(r[a].nsmallest(k).index), set(r[b].nsmallest(k).index)
    return {"pair": pair.rstrip("="), "same": pair.endswith("="),
            "rho": r[a].corr(r[b]),
            "over1pp": ((r[a] - r[b]).abs() > 0.01).mean(),
            "diff1y": (year[a] - year[b]) * 100,
            "shared": len(worst_a & worst_b)}


t = pd.DataFrame([measure(p) for p in PAIRS]).set_index("pair")
print(f"Weekly returns: {len(r)} (weeks ending {r.index[0].date()} to {r.index[-1].date()}); worst 10% = {k} weeks")
for label, g in (("Same index", t[t.same]), ("Different index", t[~t.same])):
    print(f"{label}: {len(g)} pairs")
    print(f"  correlation  min {g.rho.min():.4f}  median {g.rho.median():.4f}  max {g.rho.max():.4f}")
    print(f"  weeks >1pp apart  median {g.over1pp.median() * 100:.1f}%  max {g.over1pp.max() * 100:.1f}%")
    print(f"  1-year gap (abs)  median {g.diff1y.abs().median():.2f}pp  max {g.diff1y.abs().max():.2f}pp")
    print(f"  worst weeks shared  median {g.shared.median():g}/{k}  min {g.shared.min()}/{k}")
d = t[~t.same]
print(f"Different-index pairs with correlation >= 0.99: {(d.rho >= 0.99).sum()}, >= 0.95: {(d.rho >= 0.95).sum()}")
print("Pair       corr    weeks>1pp  1y gap    worst weeks shared")
for p in SHOWCASE:
    x = t.loc[p]
    print(f"{p:<10} {x.rho:.4f}  {x.over1pp * 100:5.1f}%    {x.diff1y:+6.2f}pp  {x.shared}/{k}")
Weekly returns: 261 (weeks ending 2021-10-22 to 2026-10-16); worst 10% = 26 weeks
Same index: 4 pairs
correlation min 0.9997 median 0.9999 max 0.9999
weeks >1pp apart median 0.0% max 0.0%
1-year gap (abs) median 0.06pp max 0.08pp
worst weeks shared median 25.5/26 min 25/26
Different index: 28 pairs
correlation min 0.9298 median 0.9669 max 0.9963
weeks >1pp apart median 22.2% max 36.8%
1-year gap (abs) median 5.37pp max 18.62pp
worst weeks shared median 20/26 min 17/26
Different-index pairs with correlation >= 0.99: 4, >= 0.95: 18
Pair corr weeks>1pp 1y gap worst weeks shared
VOO-VTI 0.9963 0.0% +0.60pp 25/26
VGT-XLK 0.9939 2.3% -2.46pp 23/26
VWO-EEM 0.9711 6.5% -9.13pp 24/26
VEA-EFA 0.9899 2.3% +4.18pp 25/26
SMH-SOXX 0.9872 20.3% -13.82pp 24/26
VYM-VTV 0.9855 1.9% -5.63pp 21/26
QQQ-VUG 0.9831 5.7% +7.30pp 22/26
VIG-VYM 0.9298 15.7% -3.29pp 21/26Sources: IRS Publication 550 (2025), Wash Sales · 26 U.S. Code § 1091, wash sales · Yahoo Finance SMH price history · VanEck Semiconductor ETF (SMH) holdings · iShares Semiconductor ETF (SOXX) · Vanguard Total Stock Market ETF (VTI)
#research#etfs
Keep reading
cite: Julien Esnault, “Tax-loss harvesting ETF pairs: how closely 32 swaps moved, and why a high correlation is not the same return”, Portfolio Terminal, 2026-10-20. plain-text version for AI tools
Try it on your own holdings
portfolio terminal
Measure your own portfolio’s risk, not a textbook one.
Import your positions from any broker and see your volatility, beta, drawdown and correlations every morning.
Wall Street in 60s, every morning. What’s in it
One short email before the open. Unsubscribe anytime.