ETF overlap on IWDA, VWCE and EIMI: what each fund adds
On iShares’ and Vanguard’s files of September 30 and October 16, 2026, IWDA and EIMI share no company, IWDA and VWCE share 83.9% of their money, and 90.2% of EIMI sits in companies VWCE holds. The IWDA/EIMI split closest to VWCE is 87/13, at 93.0% the same money.

· 8 min read

Short answer: IWDA next to VWCE is 83.9% the same money, the same companies at the same weights. IWDA and EIMI share no company, and mixed 87/13 they are 93.0% VWCE. EIMI on top of VWCE adds weight, not companies: 90.2% of EIMI sits in VWCE’s. Issuer files of September 30 and October 16, 2026.
IWDA is the iShares Core MSCI World UCITS ETF (developed markets), EIMI the iShares Core MSCI EM IMI UCITS ETF (emerging markets; IMI means large, mid and small companies) and VWCE the Vanguard FTSE All-World UCITS ETF (both). Their full holdings files are read two ways. The same money, both ways: the smaller of the two weights, summed over every company the two funds share. Inside the other, one way: the share of one fund sitting in companies the other holds, at any weight. When one fund holds nearly every shared company at the smaller weight, as VWCE does with EIMI’s, its one-way figure and the overlap round to the same number.
| Pair | Companies in both | Same money, both ways | Inside the other, one way | The other way round |
|---|---|---|---|---|
| IWDA and VWCE | 1,186 | 83.9% | 98.5% of IWDA | 84.6% of VWCE |
| VWCE and EIMI | 1,535 | 12.4% | 90.2% of EIMI | 12.4% of VWCE |
| IWDA and EIMI | 0 | 0.0% | 0.0% of IWDA | 0.0% of EIMI |
The method, and why the two readings differ, is in how to check ETF overlap.
IWDA plus EIMI or VWCE: which split is the same portfolio?
IWDA’s 1,248 lines are developed-market companies and EIMI’s 2,889 emerging-market ones, so the only question is the proportion. We weighted the two files at every split from 80/20 to 100/0, one point at a time, and measured each mix against VWCE’s file:
- 87% IWDA and 13% EIMI shares 93.0% of its money with VWCE: the closest split.
- 88/12, the split Curvo uses, gives 92.6%; 90/10, the one ETF.ie suggests, 91.5%; IWDA alone, 83.9%.
- Against the MSCI ACWI, the index of the iShares MSCI ACWI UCITS ETF (SSAC), the closest split is 88/12, at 93.8%.
Three things keep even the closest mix 7.0 points short of being VWCE:
- VWCE puts 2.6% of its money in 1,074 lines neither IWDA nor EIMI holds, mostly companies the MSCI indexes leave out. The largest group by weight is 274 Japanese lines (ISIN starting JP), 0.8% of VWCE.
- EIMI’s IMI index reaches companies VWCE doesn’t hold: 9.3% of EIMI sits in lines VWCE doesn’t hold, 1.2% of the money at 87/13.
- The rest is the weights: the same companies at slightly different weights in two index families, and a VWCE file 16 days older than iShares’.
Read the other way, VWCE is IWDA and EIMI already mixed. Of the 7.0 points between VWCE and the 87/13 mix, 2.6% sits in companies the mix doesn’t hold; the rest is the same companies at other weights.
IWDA and VWCE: 83.9% the same money
Holding both means holding the same 1,186 companies twice, at close weights. Step by step, for the three largest:
| Company | Weight in IWDA | Weight in VWCE | Counted (the smaller) |
|---|---|---|---|
| Nvidia | 5.4% | 5.0% | 5.0% |
| Apple | 5.6% | 4.5% | 4.5% |
| Microsoft | 4.1% | 3.6% | 3.6% |
| 1,183 other companies in both | 70.8% | ||
| IWDA and VWCE, both ways | 83.9% |
One way, the two funds are far from equal. 98.5% of IWDA sits in companies VWCE holds: next to VWCE, IWDA adds 62 companies, 1.0% of its money. VWCE holds 2,609 companies IWDA doesn’t, 15.0% of its money. That 15.0% splits into 12.4% of VWCE in companies EIMI holds, the emerging markets, and 2.6% in companies neither iShares fund holds.
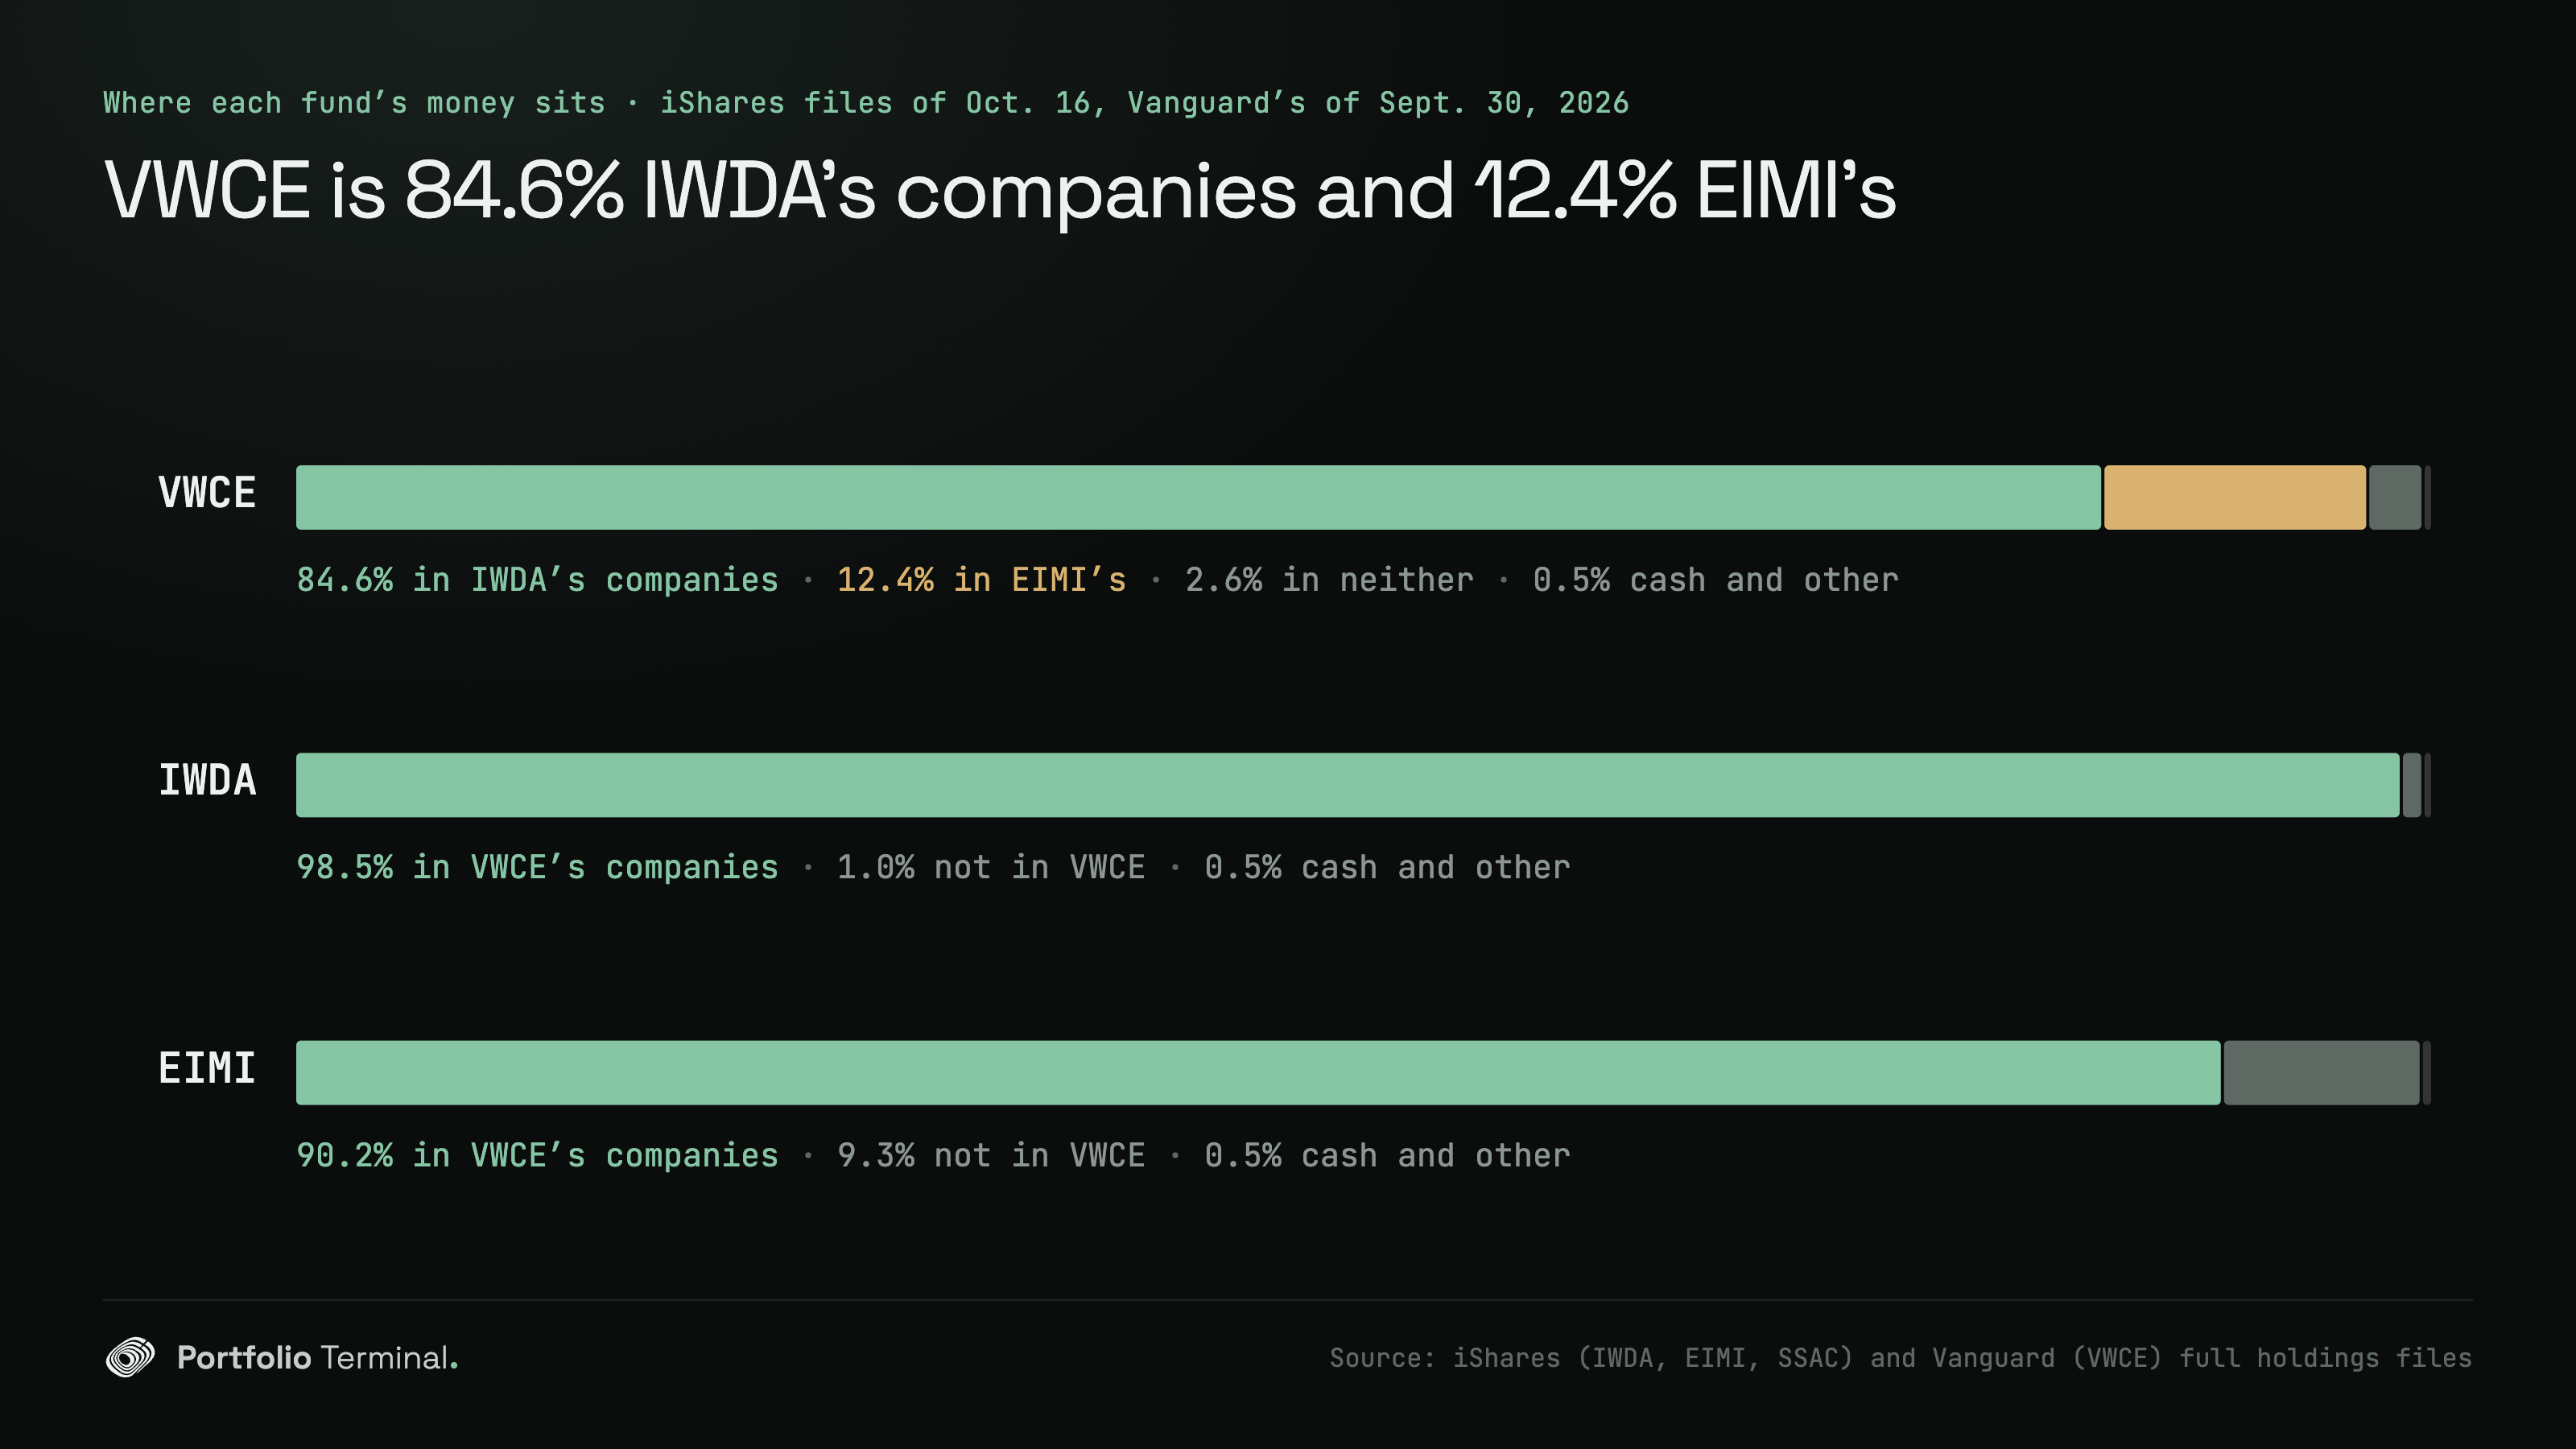
So IWDA on top of VWCE is a tilt toward developed markets, not a second set of companies. If you hold both, the portfolio X-ray adds up how much of each company you own across the two.
EIMI on top of VWCE: more weight, few new companies
90.2% of EIMI’s money sits in companies VWCE already holds. EIMI’s five largest are all in VWCE, at a fraction of the weight: Taiwan Semiconductor Manufacturing (TSMC) is 13.7% of EIMI and 1.8% of VWCE.
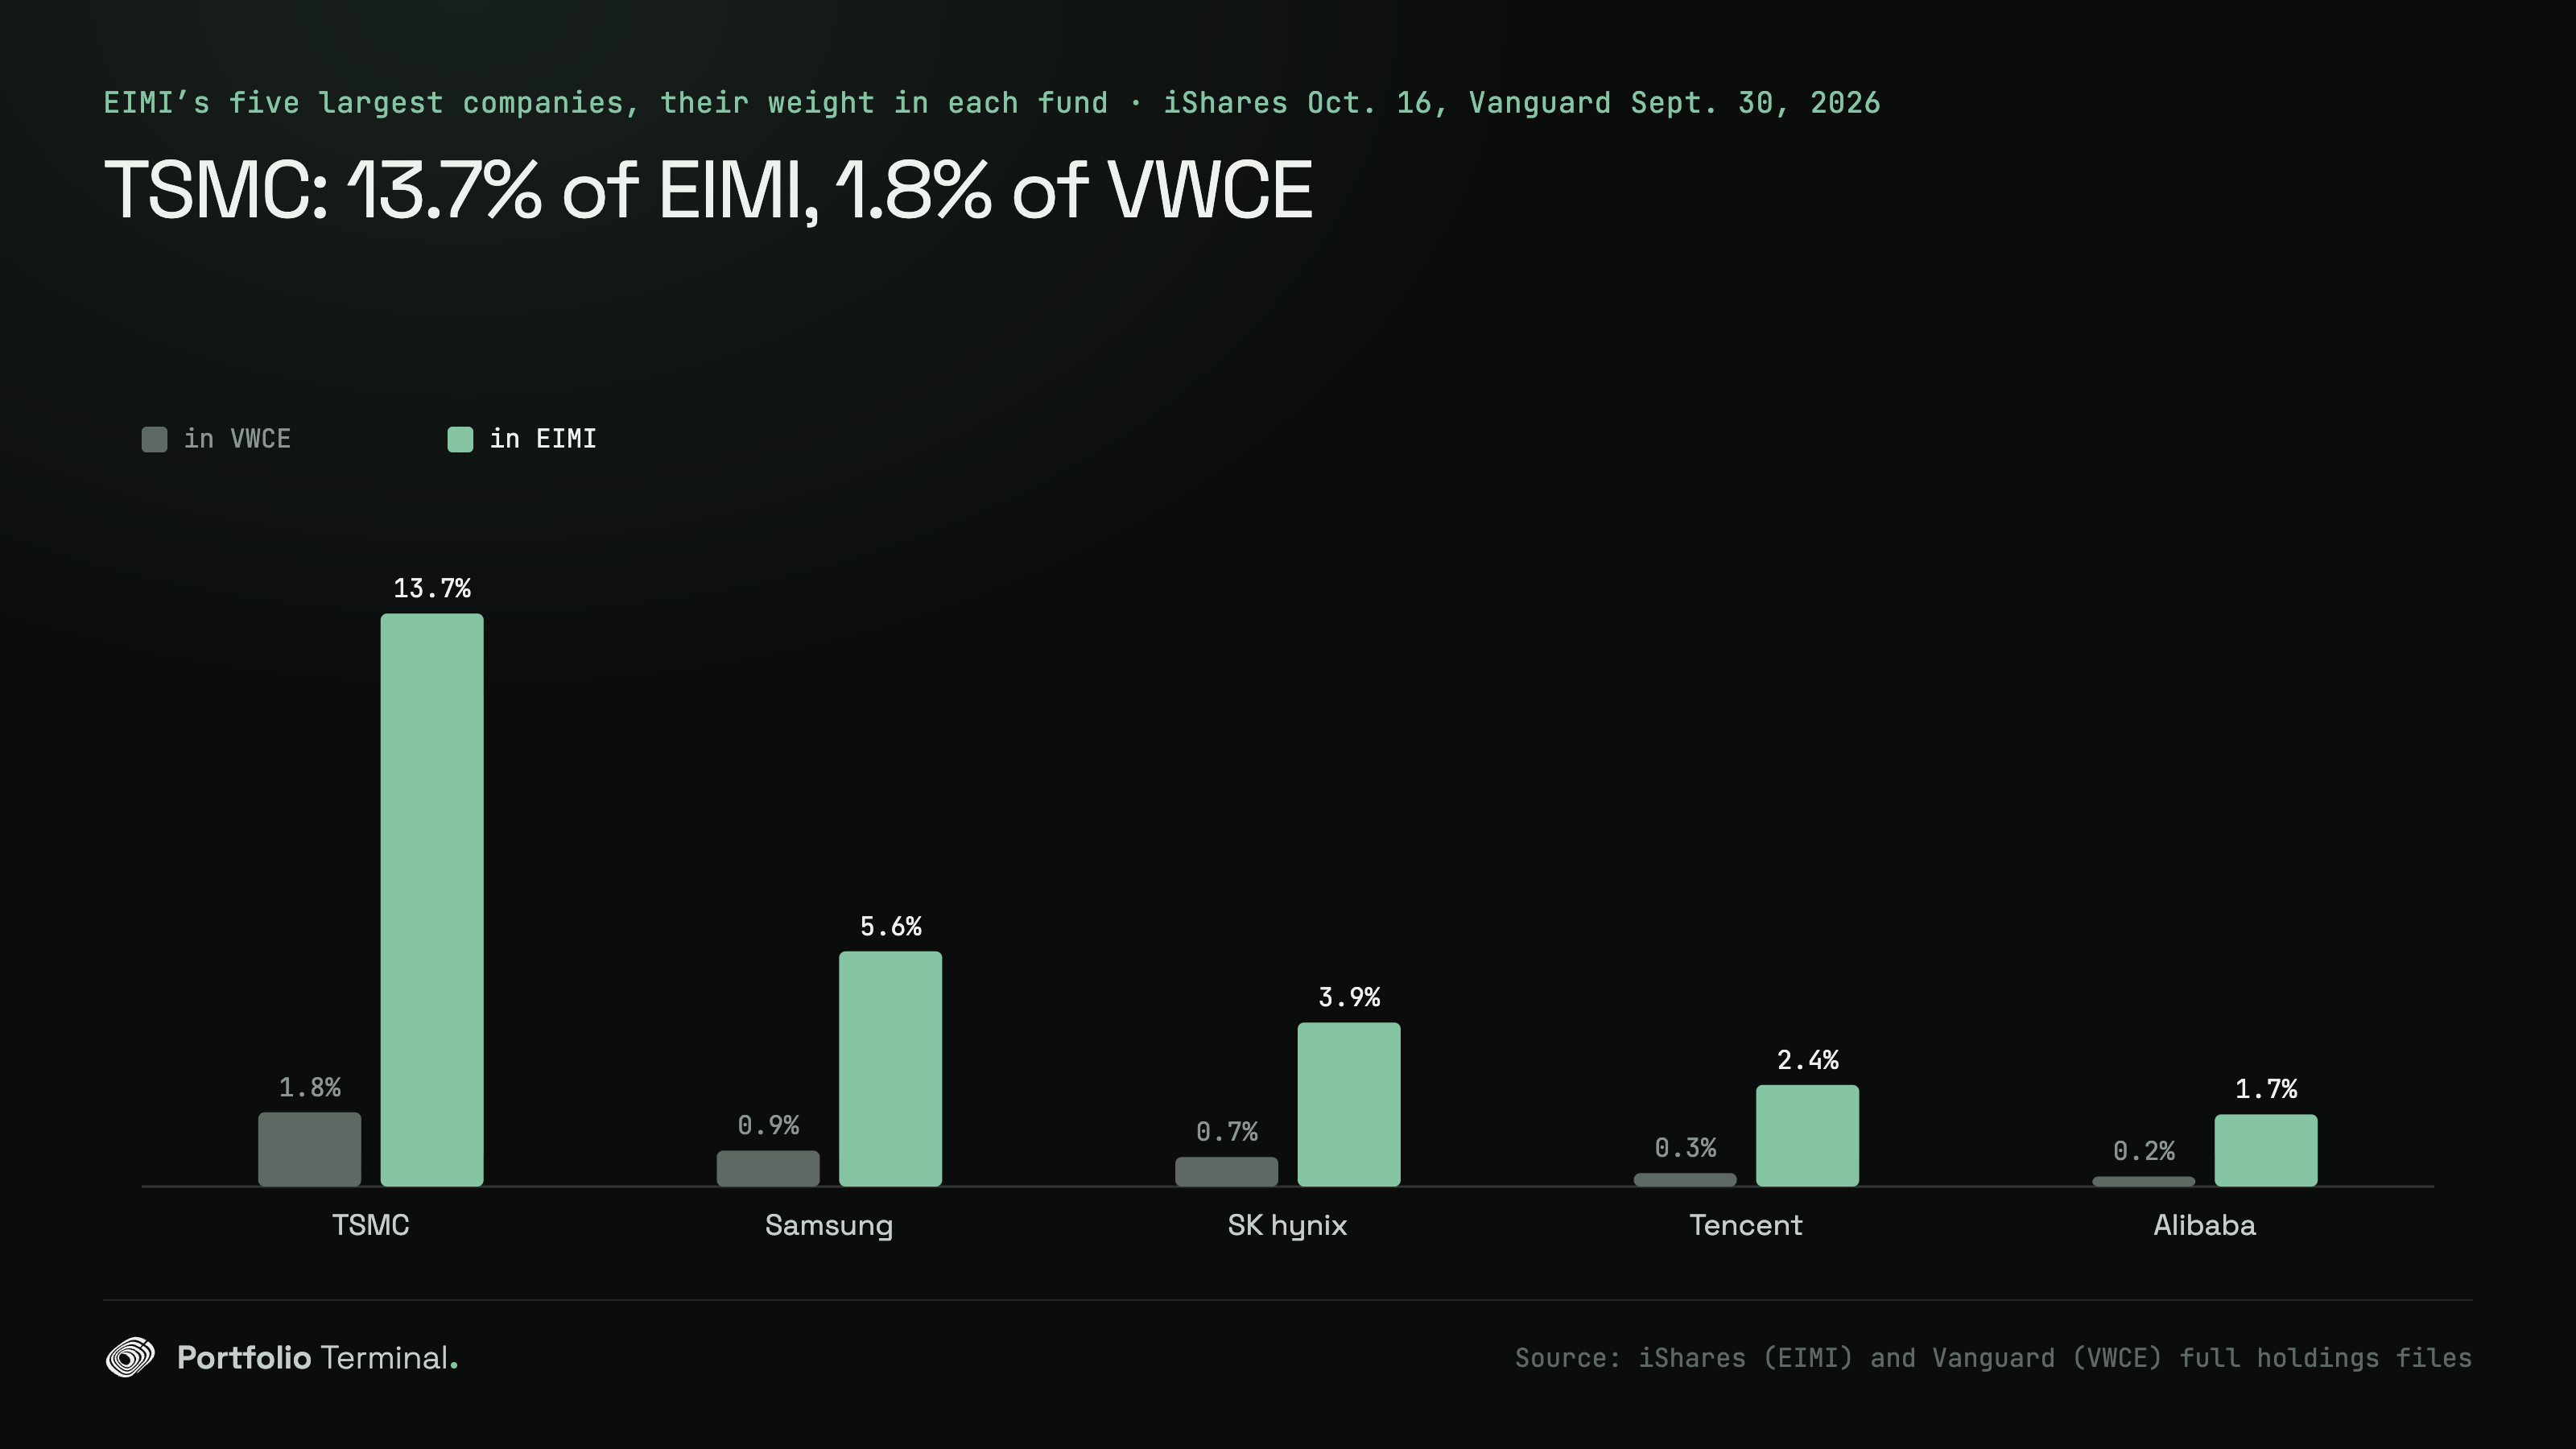
What EIMI adds is weight. VWCE alone has 12.4% of its money in companies EIMI holds. Put 10% of the money in EIMI and 90% in VWCE, and that share becomes 21.1%; at 20% EIMI, 29.8%. That is not one line bought twice: it is emerging markets on top of their weight in the world index.
The 1,354 lines of EIMI that VWCE lacks make 9.3% of the fund. Part of it is not new companies at all: 0.8% of EIMI sits in two other iShares funds (MSCI Brazil and MSCI Saudi Arabia), and 0.8% in 29 Thai non-voting depositary receipts (NVDR) of companies VWCE holds as foreign-board shares. The rest are companies at small weights: the largest, XP Inc., is 0.07% of EIMI.
The same fund under another ticker
Your broker may not show IWDA at all: a line called EUNL or IS3N is the same fund as IWDA or EIMI, listed on another exchange.
| Fund (ISIN) | Other tickers | Exchanges |
|---|---|---|
| IWDA (IE00B4L5Y983) | SWDA, EUNL | London and Amsterdam (IWDA), London and Milan (SWDA), Xetra (EUNL) |
| VWCE (IE00BK5BQT80) | VWRA, VWRP | Xetra, Amsterdam and Milan (VWCE), London (VWRA), London (VWRP) |
| EIMI (IE00BKM4GZ66) | EMIM, IS3N | London and Milan (EIMI), London and Amsterdam (EMIM), Xetra (IS3N) |
EUNL and IWDA are 100% the same portfolio: one share class of one fund, priced on two exchanges. Compare the ISIN, not the ticker. VWRL (IE00B3RBWM25) is VWCE’s distributing share class: the same holdings, with dividends paid out instead of reinvested. Our overlap tools read SWDA, EUNL, EMIM, IS3N, VWRA and VWRL on their fund’s file.
What about France’s PEA world ETFs?
In a French PEA, the world ETFs are other funds: the iShares MSCI World Swap PEA UCITS ETF (WPEA, IE0002XZSHO1), the Amundi MSCI World Swap UCITS ETF (CW8, LU1681043599) and the Amundi PEA Monde (MSCI World) UCITS ETF (DCAM, FR001400U5Q4). BlackRock and Amundi (CW8, DCAM) describe all three as swap-based: the fund holds a basket of assets and exchanges its performance for the MSCI World’s.
That changes what a holdings file says. iShares lists 139 lines for WPEA on October 29, 2026; IWDA’s file of October 16, on the same index, holds 1,248. A tool that compares holdings measures the basket, not the index you are exposed to. For overlap, read a PEA world ETF as its index, the MSCI World that IWDA holds: CW8 in the PEA and IWDA in a brokerage account are the same index twice. Two physical funds on one index overlap a median 99.7% on files of the same day (our 1,431-pair study); a swap fund aims at the same return without holding the companies.
None of CW8, DCAM and WPEA is among our 54 funds: we have no file of their own to measure, and we give no figure drawn from their holdings.
Check your own funds
What each pair means for your own accounts: IWDA with VWCE holds the developed markets twice; IWDA with EIMI holds the world once, at the split you choose; VWCE with EIMI holds the emerging markets above their world weight; a PEA world ETF with IWDA holds the MSCI World twice, on two accounts.
Add the funds you hold: each pair is measured on the same full files, both ways and one way.
your two most alike funds
??.?%Two funds can hold the same companies at nearly the same weights.
three funds many readers hold
For one pair, every page of the ETF overlap tool lists the companies in common and both file dates. For the whole portfolio, the portfolio X-ray adds up each company across all your funds, and you can import your positions from a Trade Republic screenshot, or from Boursorama or DEGIRO, to see it on your real weights. Read next: which ETFs are the same fund, our first measure on 30 funds, and is my portfolio diversified?
Where the figures come from
Data. The full holdings files the issuers published, as the site serves them: IWDA (iShares, October 16, 2026, 1,248 lines), EIMI (iShares, October 16, 2026, 2,889 lines), the iShares MSCI ACWI UCITS ETF (SSAC, iShares, October 16, 2026, 1,640 lines) and VWCE (Vanguard, September 30, 2026, 3,795 lines).
Method. Overlap both ways is the sum, over the companies both funds hold, of the smaller weight; weights are shares of each fund’s net assets. One way is the sum of one fund’s weights in the companies the other holds. Companies are matched by ISIN. A mix is the two files weighted by the split: 87/13 is 87% of each IWDA weight plus 13% of each EIMI weight, measured like a fund.
Limits.
- VWCE’s file is 16 days older than iShares’. Funds on the same index overlap a median 99.7% on files of the same day and 96.6% on files 16 days apart, so part of the 7.0 points between the 87/13 mix and VWCE is the date, not the index.
- One company, two lines: VWCE files Berkshire Hathaway’s class A shares under their own ISIN (0.15% of VWCE), counted outside IWDA, which holds the class B shares; EIMI’s 29 Thai NVDR lines of companies VWCE holds match nothing in VWCE. Both make our figures slightly lower than the companies alone would.
- Another count agrees on IWDA and VWCE: QuantRoutine’s study, published in October 2026 on its own copies of a VWCE file of July 31 and an IWDA file of September 10, 2026, found 83.8% across 1,190 companies; we find 83.9% across 1,186.
- Cash, futures and other lines outside the stock lines (0.5% of each fund) count in no overlap.
- Each UCITS file holds its index: IWDA overlaps the iShares MSCI World ETF (URTH) 98.8%, EIMI the iShares Core MSCI Emerging Markets ETF (IEMG) 96.6%, and VWCE the Vanguard Total World Stock ETF (VT), on the broader FTSE Global All Cap index, 89.1%.
- This page describes what the funds hold; it is not investment advice.
What would change the result: newer files, which move the weights, and the PEA swap funds, which have no holdings file here.
Sources: iShares, IWDA holdings · iShares, EIMI holdings · iShares, SSAC holdings · Vanguard, VWCE holdings · BlackRock, WPEA · Amundi, CW8 key information document · Amundi, DCAM key information document
#etfs#diversification
Keep reading
cite: Julien Esnault, “ETF overlap on IWDA, VWCE and EIMI: what each fund adds”, Portfolio Terminal, 2026-10-30. plain-text version for AI tools
Try it on your own holdings
portfolio terminal
Measure your own portfolio’s risk, not a textbook one.
Import your positions from any broker and see your volatility, beta, drawdown and correlations every morning.
Wall Street in 60s, every morning. What’s in it
One short email before the open. Unsubscribe anytime.