Does a stock drop by the dividend on the ex-date? We measured 14,012
On 14,012 ex-dividend days from 2016 to 2026, US stocks and ETFs opened a median 85.5 cents lower per $1 of dividend, not the full dollar. The bigger the payout, the closer the drop came to it. Recovery took a median of 1 session. The data, by dividend size.

· 8 min read
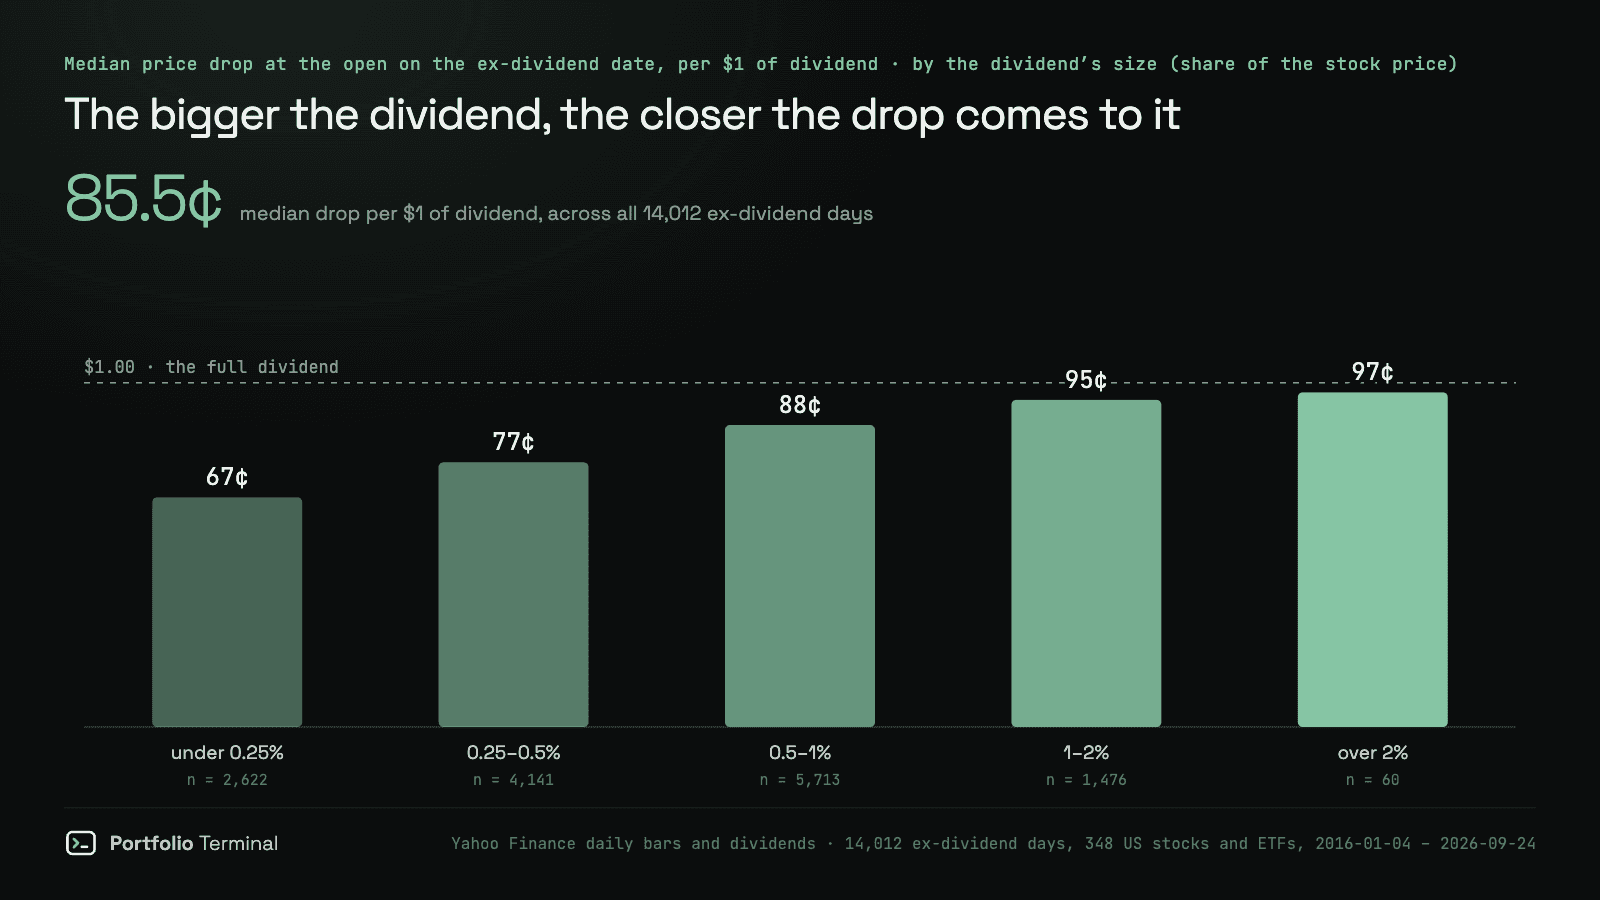
The short version: on 14,012 ex-dividend days of US stocks and ETFs between January 4, 2016 and September 24, 2026, the price opened a median 85.5 cents lower for each $1 of dividend. Not the full dollar. The bigger the dividend relative to the price, the closer the drop came to it, and most prices were back above their old close within a session or two.
Every textbook says the price drops by the dividend on the ex-date. That's the theory: the cash leaves the company, so each share is worth that much less. We wanted the number the market actually delivers, so we measured it on the 348 dividend payers among the stocks and ETFs with an analysis page on Portfolio Terminal.
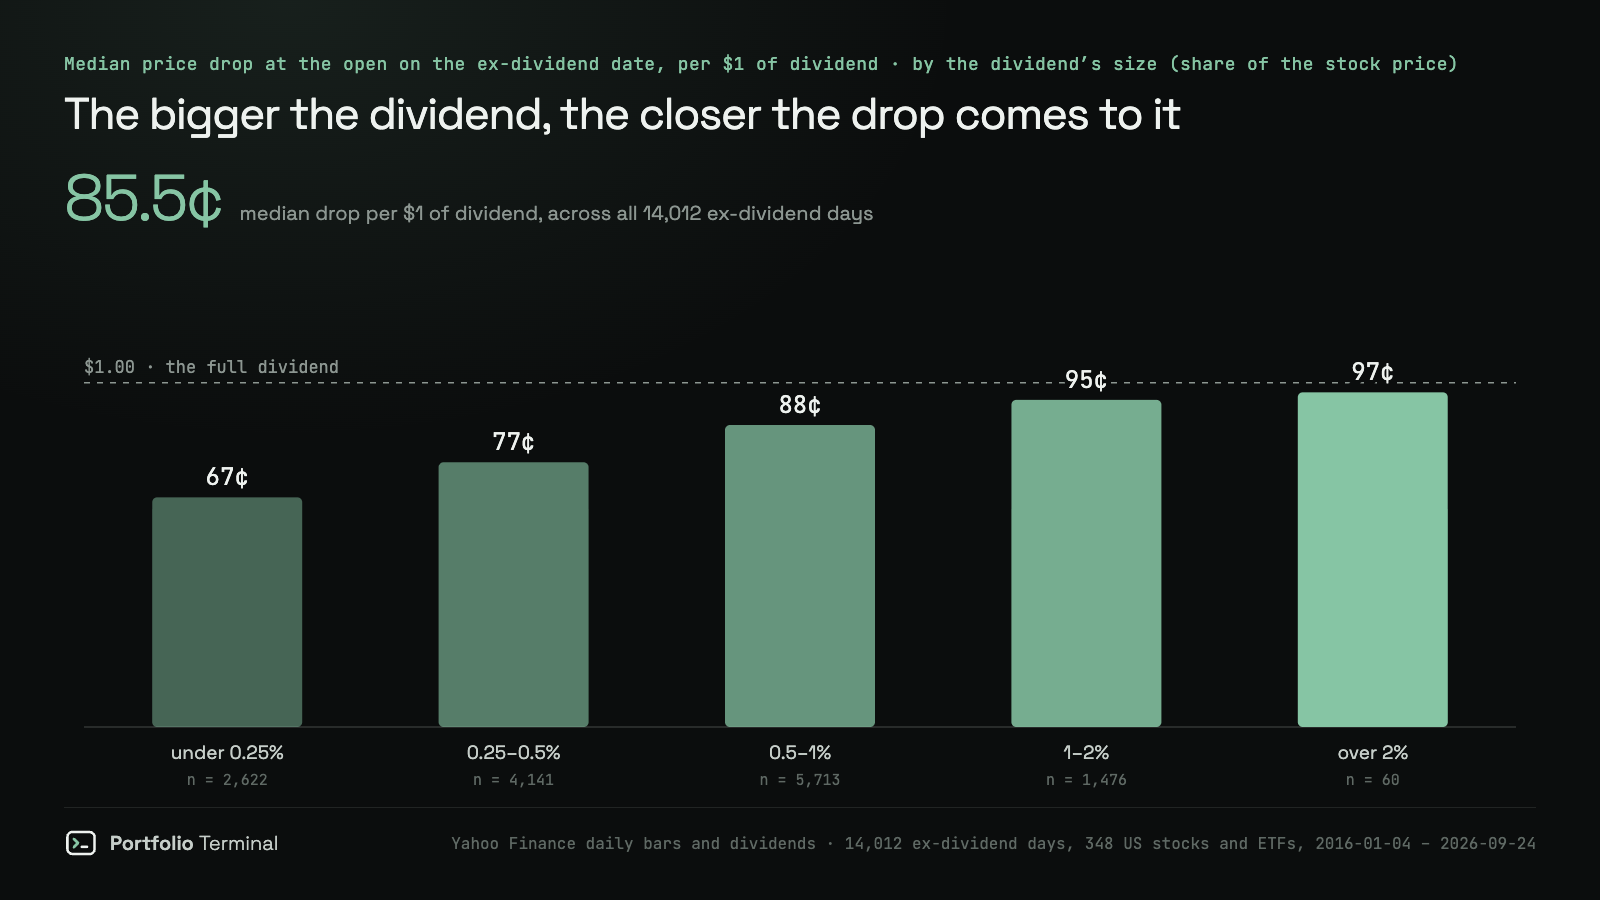
| Dividend, as a share of the price | Ex-dates | Median dividend | Drop at the open, per $1 | Fell by the full dividend or more | Opened flat or higher | Median sessions to recover |
|---|---|---|---|---|---|---|
| Under 0.25% | 2,622 | 0.175% | 66.7¢ | 45.4% | 41.6% | 1 |
| 0.25–0.5% | 4,141 | 0.373% | 76.9¢ | 43.4% | 30.2% | 1 |
| 0.5–1% | 5,713 | 0.692% | 87.7¢ | 42.6% | 13.8% | 2 |
| 1–2% | 1,476 | 1.171% | 95.0¢ | 45.7% | 8.9% | 3 |
| Over 2% | 60 | 2.295% | 97.2¢ | 45.0% | 6.7% | 6 |
"Share of the price" is one payment divided by the previous close: a $0.50 quarterly dividend on a $50 stock is 1%. Not investment advice: this describes ten years of ex-dates, not what the next one will do.
Does a stock price drop by the dividend amount on the ex-dividend date?
On average, by most of it. The median open was 85.5 cents lower per $1 of dividend, and the median close 83.5 cents lower. A trimmed mean, which ignores the most extreme 5% at each end, gives 82.1 cents at the open.
The day's market move blurs this. When the S&P 500 rises 0.5% on an ex-date, a stock paying a 0.4% dividend can open flat and still have dropped by its dividend. Subtract the index's move (scaled to the stock's price) and the median drop becomes 90.8 cents per $1 at the open and 96.9 cents at the close.
That's closer to the textbook, but any single ex-date is noisy. After the market adjustment, only 10.4% of events landed between 90 cents and $1.10. The rest scattered on both sides: 18.5% still rose against the market at the open, and 24.8% fell by more than one and a half times their dividend. Without the adjustment, 23.3% of all ex-dates opened flat or higher.
Why the drop is smaller than the dividend
Three reasons show up in the data.
Small dividends drown in the noise. A dividend worth 0.175% of the price is a fraction of an ordinary day's move for most stocks. Under 0.25%, 41.6% of stocks opened flat or higher. Above 1%, only 8.9% did. The bigger the dividend, the harder it is for the rest of the day to hide it.
Taxes. Someone who pays 15% or more on a dividend values $1 of it at less than $1 of share price. Edwin Elton and Martin Gruber used this in 1970 to estimate shareholders' tax rates from ex-dividend drops, and found the drop closer to the full dividend on high-yield stocks, which tend to be held by investors who pay less tax on income. Our buckets show the same slope fifty years later: 66.7 cents at the small end, 97.2 cents at the large end.
Stocks and funds behave differently. Individual stocks opened 84.5 cents lower per $1, equity ETFs 89.6 cents. Bond ETFs (AGG, BND, TLT) opened 106.8 cents lower, slightly more than the distribution. A bond fund's price is close to the value of its bonds and the cash it holds, so a distribution comes off almost exactly.
| Asset type | Ex-dates | Drop at the open, per $1 | Drop at the close, per $1 |
|---|---|---|---|
| Stocks | 12,594 | 84.5¢ | 80.8¢ |
| Equity ETFs | 1,040 | 89.6¢ | 99.9¢ |
| Bond ETFs | 378 | 106.8¢ | 104.2¢ |
The year didn't matter much. The median open drop moved between 73.9 cents (2024) and 101.0 cents (2022), with no trend up or down over the decade.
Seven dividend stocks and funds, ex-date by ex-date
| Ticker | Ex-dates | Median dividend | Median drop at the open, per $1 | Median sessions to recover |
|---|---|---|---|---|
| AT&T (T) | 43 | 1.702% | 85.7¢ | 16 |
| Verizon (VZ) | 43 | 1.190% | 98.8¢ | 14 |
| Pfizer (PFE) | 43 | 0.976% | 107.0¢ | 4 |
| Exxon Mobil (XOM) | 42 | 0.929% | 97.4¢ | 5 |
| Schwab U.S. Dividend Equity ETF (SCHD) | 43 | 0.820% | 87.2¢ | 4.5 |
| JPMorgan Equity Premium Income ETF (JEPI) | 73 | 0.678% | 83.0¢ | 5.5 |
| SPDR S&P 500 ETF (SPY) | 43 | 0.404% | 84.5¢ | 2 |
One ex-date can say almost anything. On July 10, 2026, AT&T went ex-dividend for $0.278. It had closed at $21.04 the day before and opened at $20.62, a drop of $0.42, or 1.51 times the dividend. By the close it was at $21.13, above where it started. Verizon went ex the same day for $0.708: $42.24 to an open of $41.61, 89 cents per $1. SPY paid $1.889 on September 18, 2026 and opened $1.29 lower, 68 cents per $1 of dividend; we noted it in that week's market review.
How long does it take a stock to recover after the ex-dividend date?
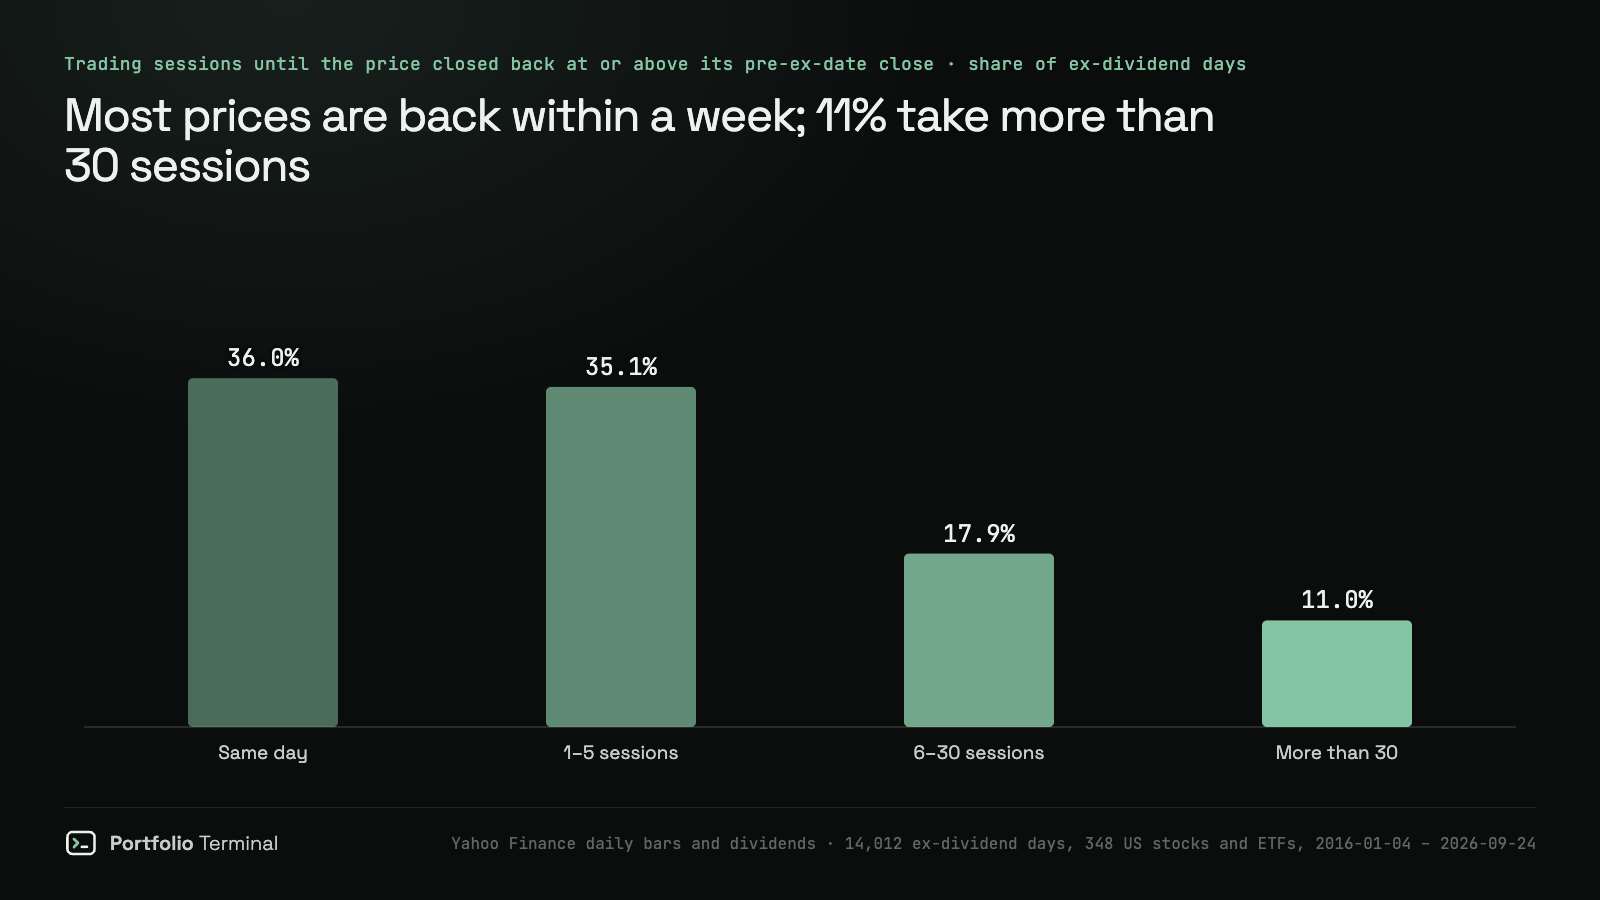
"Recover" here means the first close back at or above the close before the ex-date. Across 13,936 events with enough data to tell:
- 36.0% recovered on the ex-date itself;
- 71.2% within 5 sessions;
- 89.0% within 30 sessions;
- 11.0% took more than 30.
The median was 1 session, but it rose with the dividend: 1 session under 0.5% of the price, 3 sessions at 1–2%, 6 sessions above 2%. AT&T's median was 16 sessions. A bigger gap needs a bigger rally to close.
A price back at its old level doesn't mean the dividend was free. The shareholder who held through it has the dividend and the recovered price; the one who bought after the ex-date paid the recovered price without the dividend. Recovery tells you how fast the market moved on, not who came out ahead.
Does dividend capture work?
Buying the day before the ex-date and selling on it is the obvious trade if the drop is only 85.5 cents per $1. The table undoes it. The gap is widest on small dividends, where 1 cent of spread is a large share of the payment. On dividends of 1–2% of the price, where the dollars are big enough to matter, the median drop was 95.0 cents: about 5 cents per $1 before costs.
Then taxes. In the United States a dividend is only "qualified", and taxed at the lower rate, if the shares were held for more than 60 days around the ex-date. A two-day hold pays the ordinary income rate on the dividend. What's left is small, and the spread of outcomes (only 10.4% of ex-dates fell within 10 cents of the expected drop) is wide enough to swallow it.
What this means for your portfolio
The ex-date drop is a transfer, not a loss. Your broker's price chart shows the drop; your cash balance shows the dividend a few weeks later. That's why a price-only return undercounts a dividend portfolio, and why measuring your real return means adding the payouts back.
Two practical uses for the numbers above:
- Don't read an ex-date dip as news. A stock paying 1% or more will usually open about that much lower on the ex-date. Check the dividend calendar before reacting to a red open.
- Compare income funds on total return. SCHD and JEPI both drop by most of their distribution on each ex-date; the yield alone doesn't tell you which grew your money. They share only 7.3% of their holdings, so they are two different bets on income.
This is the second dataset we have built around a scheduled event. The first found that 47.3% of earnings beats still fell the next session. Both come to the same place: when an event is on the calendar, most of it is already in the price.
How we measured
- Universe: the 392 US stocks and 30 ETFs with an analysis page on Portfolio Terminal. 348 of them paid dividends in the window; 11 returned no data from Yahoo Finance because they were delisted or merged (FI, MMC, BK, ANSS, HOLX, K, JNPR, IPG, WBA, CMA, SEE), so companies that left the market are missing.
- Data: daily open and close prices, not adjusted for dividends, and the dividend history, both from Yahoo Finance, January 4, 2016 to September 24, 2026. The S&P 500 index (^GSPC) for the market adjustment.
- Drop ratio: (previous close − price on the ex-date) ÷ dividend, at the open and at the close. The market-adjusted version subtracts the S&P 500's move that day, scaled to the stock's price, which assumes a beta of 1 and means little for bond ETFs.
- Excluded: 294 of 14,306 events. 153 where Yahoo filled the open with the previous close, 93 special dividends, 23 payments off the company's usual schedule, 11 on a non-US listing, 6 above 10% of the price (spin-offs booked as dividends), 4 on a ticker reused by another company, 2 with a split on the ex-date, 1 under $1, 1 with no payment rhythm.
- Limits: Yahoo rounds dividends to three decimals (AT&T's $0.2775 shows as $0.278). Recovery is measured on closes and needs 30 sessions of follow-up, so 76 recent ex-dates are left out of it.
Sources: Yahoo Finance (prices and dividends) · Investor.gov, ex-dividend dates · Elton & Gruber (1970), Marginal Stockholder Tax Rates and the Clientele Effect · Boyd & Jagannathan (1994), Ex-dividend price behavior of common stocks · IRS Publication 550, qualified dividends
#research#dividends#stocks#market-data
part of
cite: Julien Esnault, “Does a stock drop by the dividend on the ex-date? We measured 14,012”, Portfolio Terminal, 2026-09-25. plain-text version for AI tools
next
portfolio terminal
Measure your own portfolio’s risk, not a textbook one.
Import your positions from any broker and see your volatility, beta, drawdown and correlations every morning.
Wall Street in 60s, every morning. What’s in it
One short email before the open. Unsubscribe anytime.