VO vs IJH: two mid-cap ETFs with one stock in common, and what fund size labels really hold
The Vanguard Mid-Cap ETF (VO) and the iShares Core S&P Mid-Cap ETF (IJH) share one company and 0.3% of their money. We split 8 popular funds by S&P index on the issuers’ full holdings files: VO is 90.8% S&P 500, and Vanguard’s Small-Cap ETF only 18.6% S&P SmallCap 600.

· 9 min read
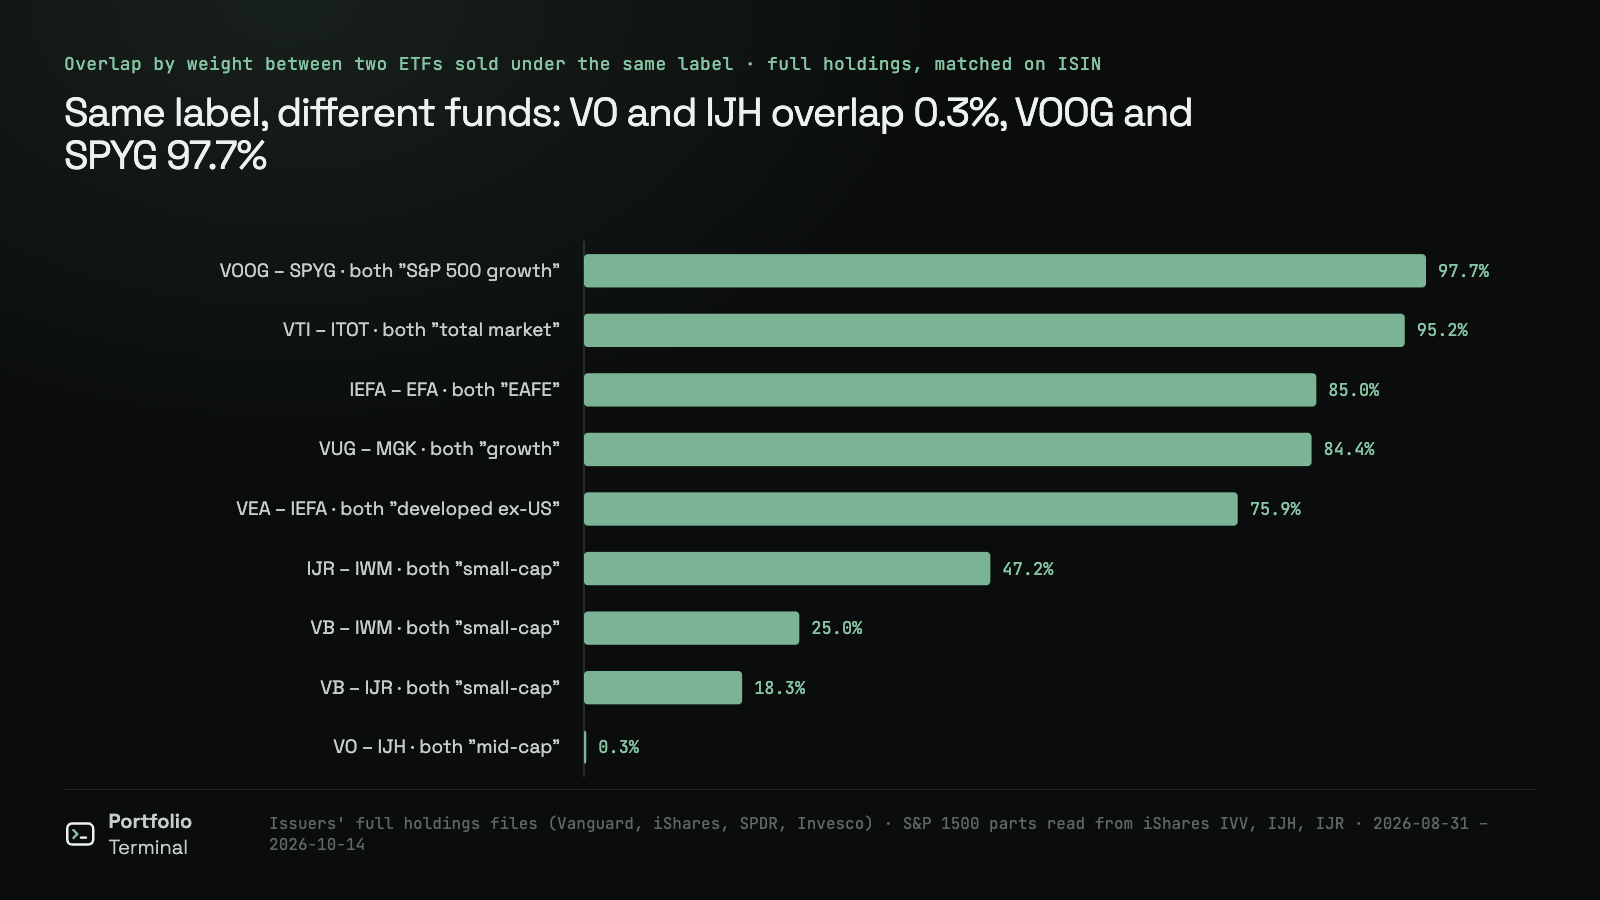
The short version: the Vanguard Mid-Cap ETF (VO) and the iShares Core S&P Mid-Cap ETF (IJH) hold one company in common, Corteva, in the issuers' full holdings files of September 30 and October 14, 2026: 0.3% of their money sits in the same positions. Both say "mid-cap". They mean different slices of the market.
That 0.3% is the overlap by weight: for each company both funds hold, the smaller of its two weights, added up. VO's mid caps are mostly what S&P calls large caps, while IJH holds the 400 companies just under the S&P 500.
VO vs IJH, side by side
| VO · Vanguard Mid-Cap | IJH · iShares Core S&P Mid-Cap | |
|---|---|---|
| Index it follows | CRSP US Mid Cap | S&P MidCap 400 |
| Stocks | 271 | 400 |
| Ten largest holdings | 9.8% | 7.3% |
| Money in S&P 500 companies | 90.8% | 0.0% |
| Overlap with VOO, by weight | 15.9% | 0.1% |
| Holdings file | September 30, 2026 | October 14, 2026 |
- VO follows an index from CRSP, the Center for Research in Security Prices at the University of Chicago. CRSP draws its mid-cap band by share of the whole market's value, and that band reaches into the S&P 500: 241 of VO's 271 stocks are in it. Its largest holdings that the Vanguard S&P 500 ETF (VOO) also owns are Valero Energy, Marathon Petroleum, Phillips 66, Quanta Services and Vertiv. Full list: VO holdings.
- IJH follows the S&P MidCap 400, which S&P picks from the companies just under the S&P 500. Its largest holdings are Okta, TechnipFMC, ATI, nVent Electric and Entegris. Full list: IJH holdings.
- The one company in both is Corteva (CTVA): 0.5% of VO and a smaller line in IJH. The pair's full table is on VO vs IJH overlap.
Why VO overlaps VOO by only 15.9% when 90.8% of its money is in S&P 500 companies: the two funds hold those companies at very different weights. Valero is 1.1% of VO and 0.16% of VOO, and VOO puts 37.9% of its money in its ten largest holdings, which VO doesn't own at all. Holding both means owning 241 companies twice, at different sizes (VOO vs VO).
Where each fund's money sits, by S&P index
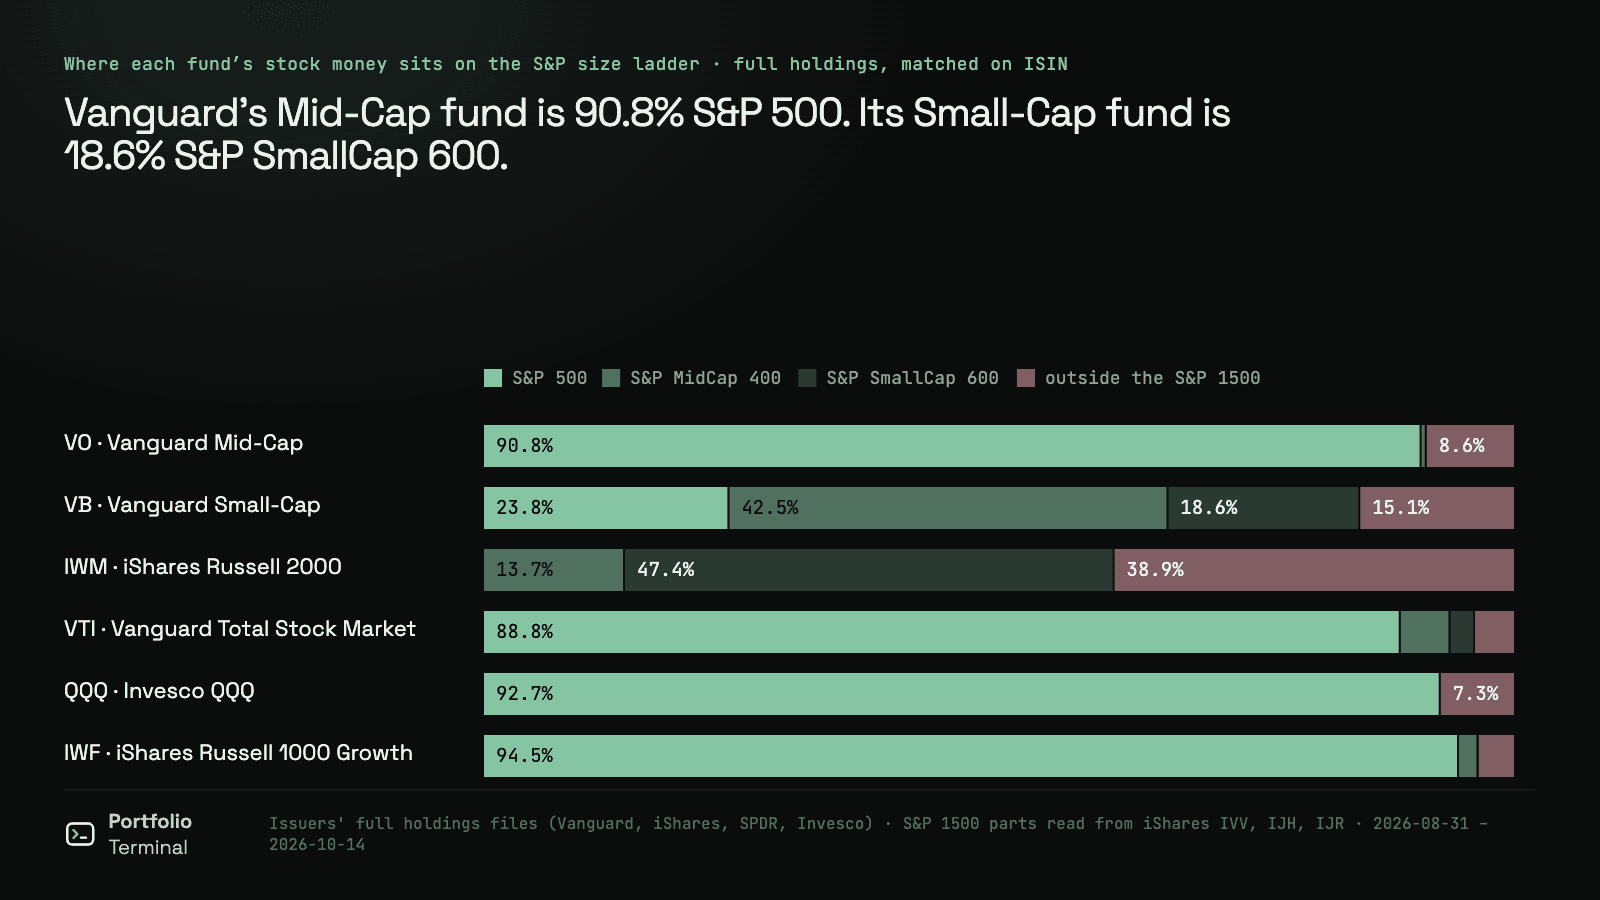
We used the S&P Composite 1500 as a ruler, read from iShares' own files for its three parts on October 14, 2026: the S&P 500 (IVV), the S&P MidCap 400 (IJH) and the S&P SmallCap 600 (IJR). Every stock in a fund is placed in the one it belongs to, or outside all three.
| Fund | Stocks | S&P 500 | S&P MidCap 400 | S&P SmallCap 600 | Outside the S&P 1500 |
|---|---|---|---|---|---|
| VO · Vanguard Mid-Cap | 271 | 90.8% | 0.5% | 0.0% | 8.6% |
| VB · Vanguard Small-Cap | 1,300 | 23.8% | 42.5% | 18.6% | 15.1% |
| IWM · iShares Russell 2000 | 1,975 | 0.0% | 13.7% | 47.4% | 38.9% |
| VTI · Vanguard Total Stock Market | 3,501 | 88.8% | 4.8% | 2.4% | 4.0% |
| QQQ · Invesco QQQ | 101 | 92.7% | 0.0% | 0.0% | 7.3% |
| IWF · iShares Russell 1000 Growth | 371 | 94.5% | 1.9% | 0.1% | 3.6% |
| VUG · Vanguard Growth | 147 | 97.7% | 0.0% | 0.0% | 2.2% |
| MGK · Vanguard Mega Cap Growth | 52 | 99.1% | 0.0% | 0.0% | 0.9% |
Share of each fund's stock money, cash and futures left out. Files: VO, VB and MGK September 30, 2026; VTI and VUG August 31; IWM and QQQ September 24; IWF October 14.
Three readings:
- Vanguard's Mid-Cap fund is an S&P 500 fund without the giants. Its 8.6% outside the S&P 1500 are companies such as Cloudflare, Snowflake and Cheniere Energy.
- Vanguard's Small-Cap fund is mostly mid caps by S&P's definition. Only 18.6% of it is in S&P SmallCap 600 companies. 23.8% is in S&P 500 companies such as Illumina, Moderna, EMCOR and Jabil. And 397 of IJH's 400 stocks, 99.4% of IJH's money, are inside VB (VB vs IJH).
- The Russell 2000 holds the most companies S&P leaves out. IWM holds 1,358 companies outside the S&P 1500, 38.9% of its money. S&P's index rules ask for positive earnings, among other tests; Russell's don't.
Three small-cap funds, three different baskets
| Pair | Overlap by weight | Companies in both |
|---|---|---|
| VB – IJR | 18.3% | 484 |
| VB – IWM | 25.0% | 677 |
| IJR – IWM | 47.2% | 539 |
The two that agree most are IJR and IWM, and even they have less than half their money in the same positions: 82.9% of IJR sits in companies IWM also holds, at different weights. VB stands apart from both because most of it is mid caps by S&P's definition. A portfolio whose "small caps" are VB holds mostly S&P mid caps. Full tables: VB vs IJR, IWM vs VB, IWM vs IJR.
Growth funds: two are one fund, QQQ is the odd one out
Overlap by weight between six large growth funds, and how much of each its ten largest holdings make up:
| QQQ | MGK | VUG | IWF | VOOG | SPYG | Top 10 holdings | |
|---|---|---|---|---|---|---|---|
| QQQ | – | 62.6% | 58.8% | 58.3% | 55.8% | 55.1% | 47.1% |
| MGK | 62.6% | – | 84.4% | 72.4% | 72.4% | 72.5% | 64.7% |
| VUG | 58.8% | 84.4% | – | 77.4% | 76.7% | 77.1% | 63.6% |
| IWF | 58.3% | 72.4% | 77.4% | – | 76.9% | 76.3% | 57.8% |
| VOOG | 55.8% | 72.4% | 76.7% | 76.9% | – | 97.7% | 60.2% |
| SPYG | 55.1% | 72.5% | 77.1% | 76.3% | 97.7% | – | 60.2% |
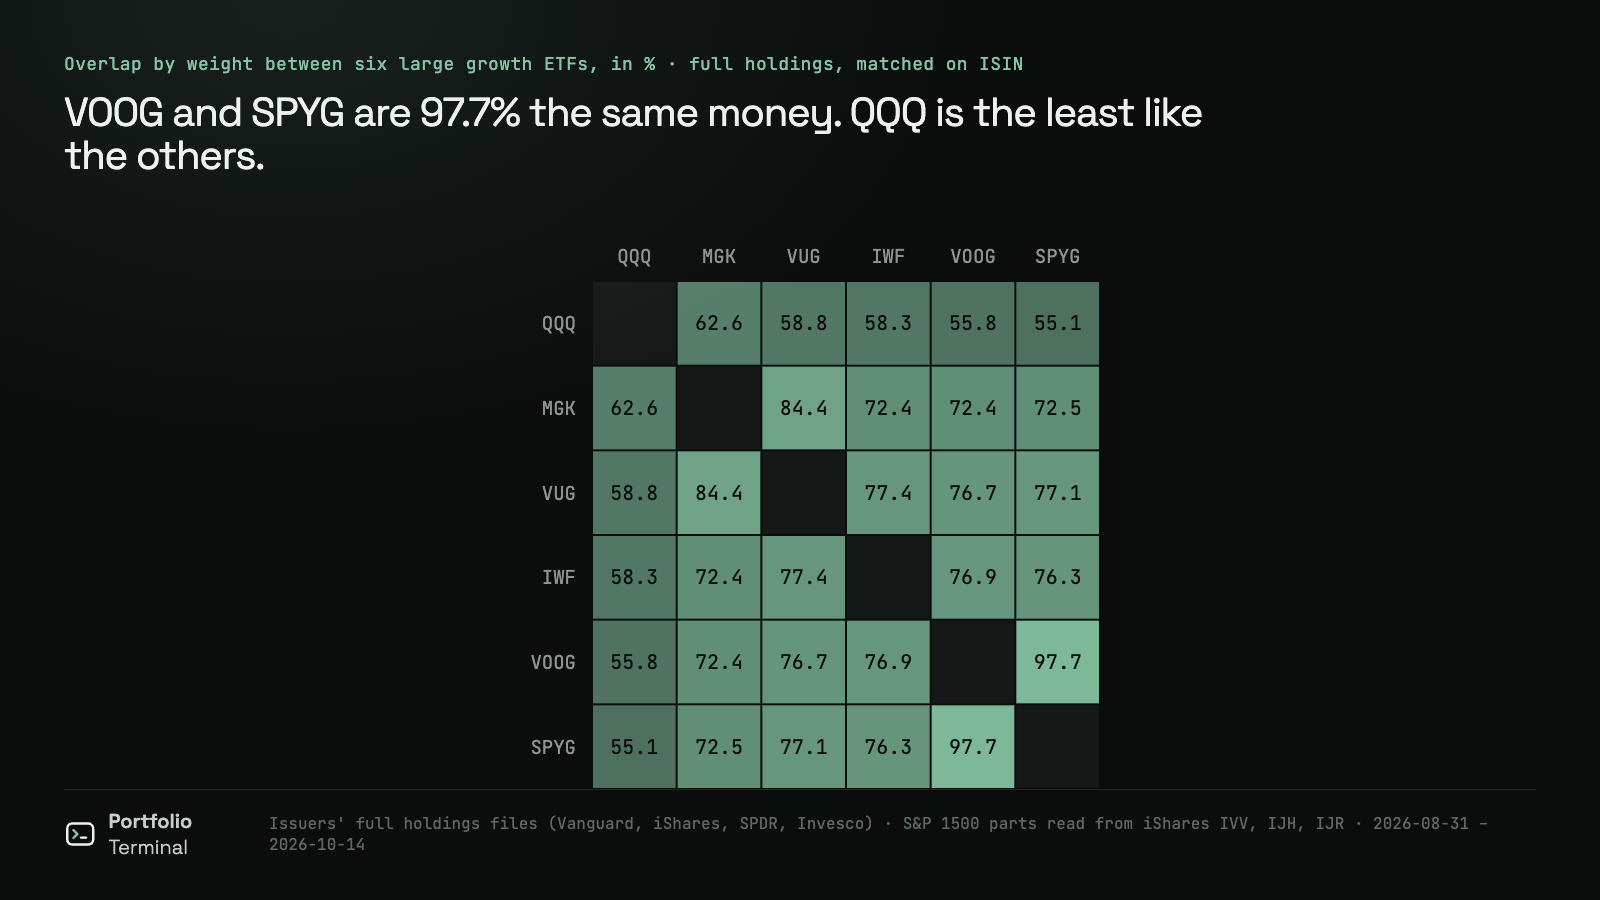
VOOG and SPYG follow the same index and are 97.7% alike (VOOG vs SPYG). All 52 of MGK's stocks are in VUG, 84.4% alike by weight (VUG vs MGK). QQQ is the least like the others, 55.1% to 62.6% with each, and keeps 7.3% outside the S&P 1500, in companies such as Shopify, ASML and Arm Holdings (QQQ vs MGK). Two "total market" funds, the Vanguard Total Stock Market ETF (VTI) and the iShares Core S&P Total U.S. Stock Market ETF (ITOT), overlap 95.2% (VTI vs ITOT); two developed-markets funds, VEA and IEFA, 75.9% (VEA vs IEFA).
What to do with it
A fund's label is its index provider's definition. Three checks for your own funds:
- If you hold VOO and VO, most of the "mid-cap" money is in companies VOO already owns. Your S&P 500 share is the sum of both, at different weights: the VOO vs VO page lists them company by company.
- If VB is your small-cap fund, 18.6% of it is S&P small caps. VB's holdings list every line with its weight and sector.
- For any two funds you own, the ETF overlap tool measures 46 funds on the issuers' full files, and the portfolio X-ray adds up the same company held through several funds.
More on the same problem: which ETFs are the same fund, measured over 435 pairs, and is my portfolio diversified?
This study describes what the funds held on those dates. It is not investment advice.
How we measured
- Holdings: each issuer's full holdings file, downloaded from its own site: Vanguard's month-end files (VO, VB, MGK and VOOG of September 30, 2026; VTI, VUG, VEA and VOO of August 31), iShares' daily files (IJH, IJR, IVV, ITOT, IWF and IEFA of October 14; IWM and EFA of September 24), Invesco's for QQQ (September 24) and SPDR's for SPYG (October 14).
- Matching: companies are matched on their ISIN, so two share classes stay apart and a foreign company is the same in every file. Shares are of each fund's stock lines: cash, futures and money-market lines are left out. The stock counts leave out rights and warrants (one line in VB, two in VTI).
- Overlap: for two funds, the sum over the companies both hold of the smaller of the two weights. It is the share of money that would sit in the same positions if you split it between the two.
- The S&P ladder: a company is in the S&P 500 if iShares' S&P 500 file (IVV) holds it, else in the MidCap 400 if IJH holds it, else in the SmallCap 600 if IJR holds it, else outside the S&P 1500, all on October 14, 2026.
- What would change the result: dates. S&P rebalances its indexes every quarter, and the Vanguard files are two to six weeks older than the iShares ones. A company that changed index in between can land in the wrong bucket: Corteva sits in IJH's file and in VO's, not in IVV's.
Reproduce it
The VO–IJH overlap and the S&P split of VO and VB, from the issuers' files of the day. We ran it on October 15, 2026, and it prints the same numbers as the study's results file.
Show the code
# Reproduces https://portfolio-terminal.com/blog/mid-cap-etf-vo-vs-ijh
# pip install requests
# Reads the issuers' own holdings files of the day (Vanguard posts month-end, iShares daily),
# so figures move a little with the date; the article's run is dated.
import requests

money = lambda v: float(str(v).replace("$", "").replace(",", ""))

UA = {"User-Agent": "Mozilla/5.0 (Macintosh; Intel Mac OS X 10_15_7) AppleWebKit/537.36 Chrome/128.0.0.0 Safari/537.36"}


def vanguard(symbol):
    url = "https://investor.vanguard.com/irr/funds/profile/%s-AdditionalFundData" % symbol
    hd = requests.get(url, headers=UA, timeout=60).json()["holdingDetails"]
    rows = [(r.get("isin"), money(r["marketValueBaseCurrency"])) for r in hd["equityHoldings"]]
    total = sum(mv for _, mv in rows)
    return hd["asOfDate"], {isin: mv / total for isin, mv in rows if isin}


def ishares(portfolio_id):
    # The JSON the ishares.com "All holdings" table loads.
    url = ("https://www.blackrock.com/varnish-api/blk-one01-product-data"
           "/product-data"
           "/api/v2/get-product-data?appType=PRODUCT_PAGE&appSubType=ISHARES&targetSite=us-ishares&locale=en_US"
           "&portfolioId=%d&userType=individual&component=holdings" % portfolio_id)
    dp = requests.get(url, headers=UA, timeout=60).json()["componentsByNameMap"]["holdings"]["containersByNameMap"]["all"]["dataPointsByNameMap"]
    col = lambda k: dp[k]["value"]
    weights = {}
    # Most funds publish holdingPercent; those holding futures (IJH, IJR) only a market value per line.
    size = col("holdingPercent") if "holdingPercent" in dp else col("ceMarketValue")
    for isin, cls, w in zip(col("isin"), col("assetClass"), size):
        if cls == "Equity" and isin:
            weights[isin] = weights.get(isin, 0) + money(w)
    total = sum(weights.values())
    return str(dp["asOfDate"]["value"]), {k: v / total for k, v in weights.items()}


vo_date, vo = vanguard("VO")
vb_date, vb = vanguard("VB")
ijh_date, ijh = ishares(239763)  # iShares Core S&P Mid-Cap (S&P MidCap 400)
ivv_date, ivv = ishares(239726)  # iShares Core S&P 500
ijr_date, ijr = ishares(239774)  # iShares Core S&P Small-Cap (S&P SmallCap 600)

print("files: VO %s, VB %s, IJH %s, IVV %s, IJR %s" % (vo_date, vb_date, ijh_date, ivv_date, ijr_date))
shared = set(vo) & set(ijh)
print("VO and IJH: %d %s in common, overlap %.1f%%" % (len(shared), "company" if len(shared) == 1 else "companies", 100 * sum(min(vo[i], ijh[i]) for i in shared)))


def ladder(name, fund):
    sp500 = sum(w for i, w in fund.items() if i in ivv)
    sp400 = sum(w for i, w in fund.items() if i in ijh and i not in ivv)
    sp600 = sum(w for i, w in fund.items() if i in ijr and i not in ivv and i not in ijh)
    print("%s: S&P 500 %.1f%%, S&P 400 %.1f%%, S&P 600 %.1f%%, outside %.1f%%"
          % (name, 100 * sp500, 100 * sp400, 100 * sp600, 100 * (1 - sp500 - sp400 - sp600)))


ladder("VO (Vanguard Mid-Cap)", vo)
ladder("VB (Vanguard Small-Cap)", vb)
files: VO 09/30/2026, VB 09/30/2026, IJH 20261014, IVV 20261014, IJR 20261014
VO and IJH: 1 company in common, overlap 0.3%
VO (Vanguard Mid-Cap): S&P 500 90.8%, S&P 400 0.5%, S&P 600 0.0%, outside 8.6%
VB (Vanguard Small-Cap): S&P 500 23.8%, S&P 400 42.5%, S&P 600 18.6%, outside 15.1%Sources: Vanguard Mid-Cap ETF (VO) portfolio · Vanguard Small-Cap ETF (VB) portfolio · iShares Core S&P Mid-Cap ETF (IJH) holdings · iShares Core S&P Small-Cap ETF (IJR) holdings · iShares Core S&P 500 ETF (IVV) holdings · S&P U.S. Indices methodology · CRSP US Mid Cap Index
#research#etfs
Keep reading
cite: Julien Esnault, “VO vs IJH: two mid-cap ETFs with one stock in common, and what fund size labels really hold”, Portfolio Terminal, 2026-10-15. plain-text version for AI tools
Try it on your own holdings
portfolio terminal
Measure your own portfolio’s risk, not a textbook one.
Import your positions from any broker and see your volatility, beta, drawdown and correlations every morning.
Wall Street in 60s, every morning. What’s in it
One short email before the open. Unsubscribe anytime.