How to check ETF overlap And what 1,431 pairs say is too much
Across 1,431 pairs of 54 ETFs in October 2026, the median pair shares 4.3% of its money and 12.0% share half or more, yet 94.9% of SCHD sits in companies VOO holds at a 7.6% overlap. Check every holding, by weight, both ways, on files of the same date.

· 9 min read

Short answer: check ETF overlap on every holding, not the top 10, by weight, on files of the same date, and read it both ways (the money both funds share) and one way (how much of one sits in the other’s companies). Across 1,431 pairs of 54 ETFs in October 2026, the median shares 4.3%; 172 share half or more.
The usual rule says to keep two funds under 50%. It misses the other direction. The Vanguard S&P 500 ETF (VOO) and the Schwab U.S. Dividend Equity ETF (SCHD) are only 7.6% the same money, yet 94.9% of SCHD sits in companies VOO already holds. 374 pairs look like that: under 50% both ways, with one fund 75% or more inside the other.
| Check | Skip it, and… | On the 1,431 pairs |
|---|---|---|
| Every holding, not the top 10 | most pairs look unrelated | 908 share nothing on top-10 lists, 448 on the full files |
| By weight, not by count | shared names pass for shared money | VTI and VGT share 313 companies but 37.0% of their money |
| Both directions | a fund inside another looks harmless | 633 have one fund 50% or more inside the other; 172 are 50% or more both ways |
| Files of the same date | two copies of one index drift apart | same-index funds: 99.7% on same-day files, 96.6% on files 16 days apart |
Every figure here comes from the issuers’ full holdings files behind our ETF overlap tool, which has a page for each of the 1,431 pairs.
Check two ETFs in four steps
Take VOO and the Vanguard Information Technology ETF (VGT), both on Vanguard’s files of September 30, 2026.
- Get the full holdings file from the issuer, not the fact sheet. A fact sheet shows the top 10; VOO’s file lists 505 lines and VGT’s 318. Vanguard posts month-end files; iShares, State Street (SPDR), Invesco and Schwab post daily ones.
- Match the companies on their ISIN (the 12-character security code), then keep the smaller of the two weights for each company both funds hold, and add them up. That sum is the overlap both ways: the part of each fund you would own twice. Matching on the ISIN keeps Alphabet’s two share classes, GOOGL and GOOG, apart, as the funds hold them.
- Read one way too. Add up each fund’s weight in the companies the other one holds, at any weight. 88.8% of VGT’s money sits in companies VOO holds; 39.8% of VOO’s sits in companies VGT holds. VOO’s figure equals the overlap because VOO holds Nvidia, Apple, Microsoft and every other shared company at the smaller weight.
- Check the two dates. Both files here are dated September 30, 2026. When two files are weeks apart, two copies of the same index already look a few points apart.
Step 2 on VOO and VGT, line by line:
| Company | Weight in VOO | Weight in VGT | Counted (the smaller) |
|---|---|---|---|
| Nvidia | 8.4% | 17.6% | 8.4% |
| Apple | 7.4% | 15.9% | 7.4% |
| Microsoft | 5.8% | 11.2% | 5.8% |
| 71 other companies in both | 18.2% | ||
| VOO and VGT, both ways | 39.8% |
How much overlap is too much?
No regulator or index provider sets a line. The ones in circulation are round numbers: Passiv suggests keeping overlap under 50%, the etfray tutorial calls 80% to 100% “near-identical”, and MarketXLS calls 70% “high redundancy” on a figure it reads one fund at a time. Here is how many of the 1,431 pairs each line flags, both ways and one way:
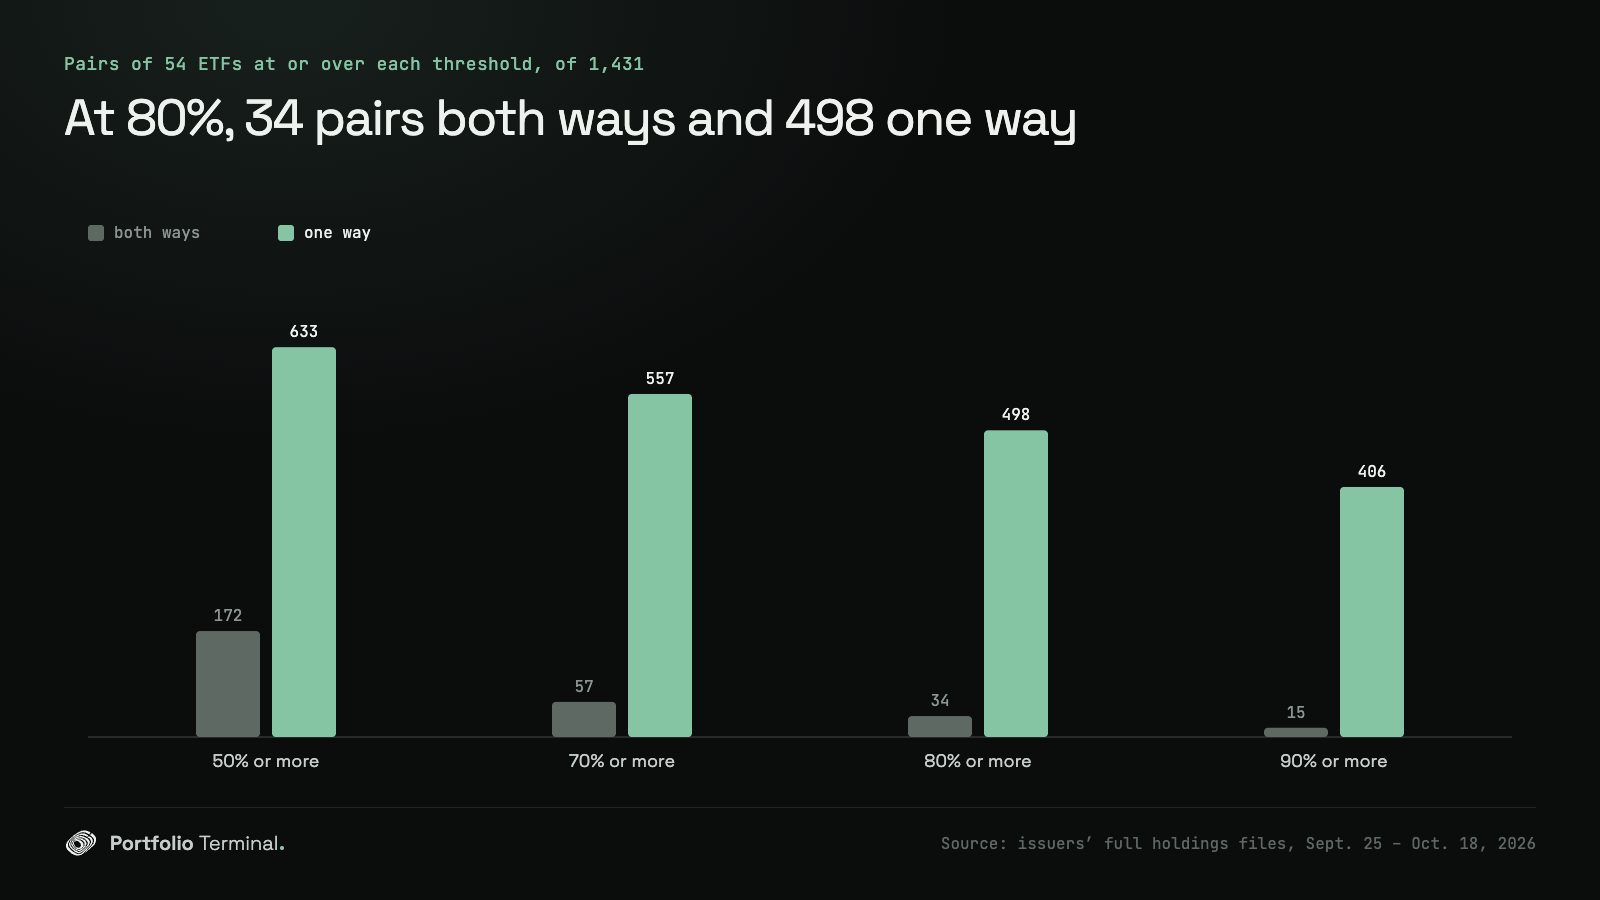
Both ways, 80% or more is one portfolio under two tickers. That is 34 pairs: 14 track the same index (the five S&P 500 funds, the three Nasdaq-100 funds, VOOG and SPYG), and the other 20 pair two funds on different indexes that hold mostly the same companies, such as VOO and the Vanguard Total Stock Market ETF (VTI) at 89.0%.
Which line matters depends on the question you are asking. These are reading lines, not rules:
| Your question | Read | Line | Pairs at or over it |
|---|---|---|---|
| Do I hold one portfolio twice? | both ways | 80% | 34 |
| Is half my money in the same positions? | both ways | 50% | 172 |
| Does the second fund add companies I don’t have? | one way | 90% | 406 |
A high one-way figure is not a mistake in itself. Next to VOO, SCHD adds no new company for 94.9% of its money; what it changes is how much of each. If that tilt is why you hold it, the overlap is the point. If you bought it to own companies VOO doesn’t, it mostly doesn’t (the head-to-head is on SCHD vs VOO).
The direction most tools skip
Overlap both ways is symmetric: VOO and VGT are 39.8% the same money whichever fund you start from. The one-way figure is not, and it answers another question: how much of the narrower bet is already inside the broader one.
| Pair | Companies in both | Both ways | One way | The other way |
|---|---|---|---|---|
| VOO and SCHD | 45 | 7.6% | 94.9% of SCHD | 7.6% of VOO |
| VOO and VGT | 74 | 39.8% | 88.8% of VGT | 39.8% of VOO |
| VOO and QQQ | 86 | 55.6% | 92.9% of QQQ | 55.9% of VOO |
| VOO and IVV | 501 | 96.6% | 99.8% of VOO | 99.6% of IVV |
Across the 1,431 pairs, one fund has half its money or more in the other’s companies in 633 (44.2%), 80% or more in 498 and 90% or more in 406. In 174 pairs the overlap both ways is under 25% while one fund sits 90% or more inside the other. The widest gap: the Utilities Select Sector SPDR Fund (XLU) has 99.8% of its money in companies the Vanguard Total World Stock ETF (VT) holds, and those companies are 1.0% of VT.
It is the question people bring, too: of the 5,519 times Google showed our pair pages from July 27 to October 24, 2026, 73.5% were for pairs where one fund sits 75% or more inside the other, led by VGT and SMH (80.4% of SMH inside VGT) and VTI and QQQM (96.3% of QQQM inside VTI).
Why two calculators give different numbers
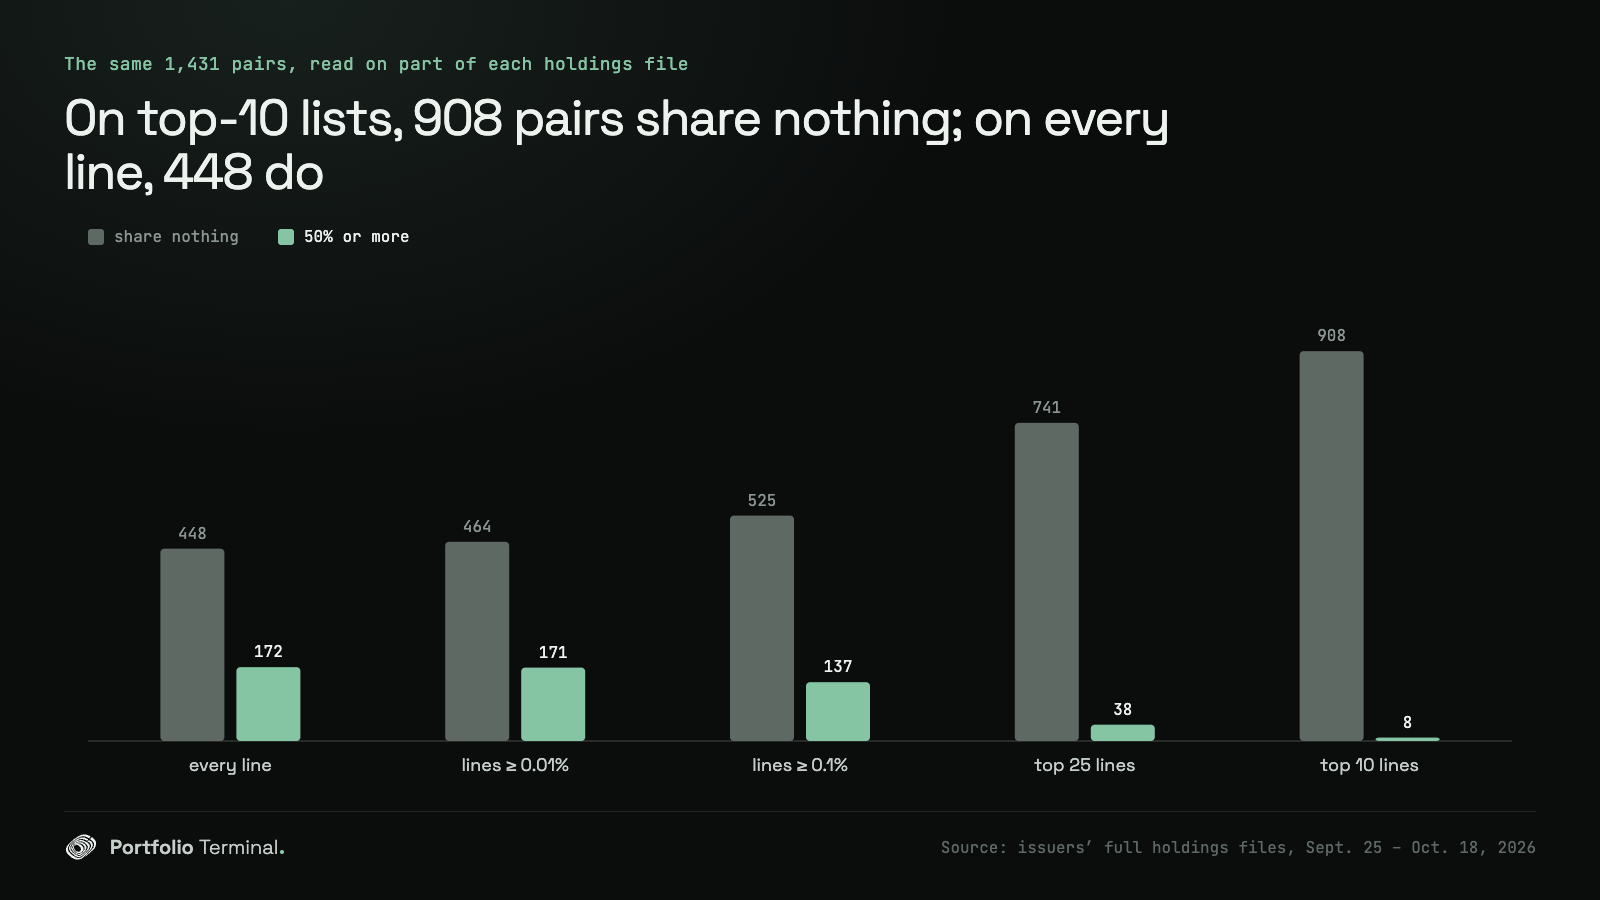
How many lines it reads. InvestSMART’s guide, for one, says to view the top 20 holdings. Read on the top 10, 908 of the 1,431 pairs share nothing, against 448 on the full files. 616 pairs move 5 points or more, and only 8 still reach 50%. The iShares MSCI EAFE ETF (EFA) and the iShares Core MSCI EAFE ETF (IEFA) fall from 85.1% to 12.2%. Even dropping lines under 0.1% moves 163 pairs by 5 points or more: VT and the Vanguard FTSE All-World UCITS ETF (VWCE) fall from 89.1% to 51.8%.
Which date each file carries. Here Vanguard’s files are dated September 30 and most others October 16. Funds on the same index overlap a median 99.7% on files of the same day and 96.6% on files 16 days apart: SPY and the iShares Core S&P 500 ETF (IVV), both dated October 16, are 99.7% the same money; VOO, dated September 30, and IVV are 96.6%. Of the 1,431 pairs, 665 (46.5%) compare files more than 7 days apart, up to 23 days. A tool worth using shows both dates.
Check your own funds
Add the funds you hold, even roughly: the checker measures every pair on the same full files, both ways.
your two most alike funds
??.?%Two funds can hold the same companies at nearly the same weights.
three funds many readers hold
For one pair, the ETF overlap tool has a page for each of the 1,431, with every shared company and both file dates. With three funds or more, the portfolio X-ray adds up each company across all of them, and you can import your positions from a broker screenshot or CSV to see it on your real weights. Related reads: which ETFs are the same fund, our first measurement on 30 funds; how closely look-alike ETF pairs moved, since overlap says what you own twice, not how two funds move; and is my portfolio diversified?
How we measured
Data. The full holdings files of 54 ETFs, 46 listed in the US and 8 UCITS funds listed in Europe, as each issuer published them: dated September 25, 2026 (ARKK) to October 18, 2026 (QQQ, QQQM and RSP), fetched on October 19, 2026. That makes 1,431 pairs. Search demand comes from our own Google Search Console, page by page, from July 27 to October 24, 2026.
Method. Overlap both ways is the sum, over companies both funds hold, of the smaller weight; weights are shares of each fund’s net assets. One way is the sum of a fund’s weights in the companies the other holds. Companies are matched on their ISIN, or on one derived from the CUSIP. Thresholds compare unrounded values.
Limits.
- Cash, futures, options and swaps sit outside the stock lines, so no pair can overlap more than either fund’s stock weight. That matters for two funds: the JPMorgan Equity Premium Income ETF (JEPI) has 15.5% of its assets outside them and the JPMorgan Nasdaq Equity Premium Income ETF (JEPQ) 17.6%; the median fund, 0.2%.
- A swap-based UCITS fund can publish a substitute basket instead of the index. Each of our 8 UCITS files overlaps its closest US-listed fund 85.1% (SMEA against VGK) to 99.8% (CSPX against SPY), so they hold the index itself.
- 10 funds have lines with no ISIN or CUSIP, matched by name; the largest share is ARKK’s, 3 lines and 3.0% of the fund.
- Search Console counts how often Google showed our pages, not people, and some of those searches come from automated agents.
What would change the result: newer files, and a different set of funds. The funds our tools read from SEC Form N-PORT filings have no pair pages and are not among the 1,431.
Reproduce it
reproduce.py downloads the 54 files as the site serves them (each with its issuer’s source and date on its first line), measures every pair, then rereads VOO and VGT straight from Vanguard. We ran it on October 27, 2026: every figure matched, and Vanguard’s own file gives VOO and VGT 39.7% and 89.0%, within 0.2 points of our copy, because the script divides by the stock lines only while our weights count all net assets.
Show the code
# Reproduces https://portfolio-terminal.com/blog/how-to-check-etf-overlap
# pip install requests
# Reads the 54 funds' holdings as the site serves them (each a dated copy of the issuer's full file,
# source on line 1), measures every pair, then rereads VOO and VGT from Vanguard to check the copy.
import csv, statistics, requests

UA = {"User-Agent": "Mozilla/5.0 (Macintosh; Intel Mac OS X 10_15_7) AppleWebKit/537.36 Chrome/128.0.0.0 Safari/537.36"}
# In the site's order, so a pair reads as its page does (voo-vs-schd).
FUNDS = ("VOO SPY QQQ VTI IVV SCHD QQQM VIG JEPI VUG VGT VYM VTV DIA IWM XLK SMH SOXX ARKK VEA VWO EFA EEM VNQ "
         "XLF XLE XLV XLI XLY XLP VXUS VT JEPQ RSP VOOG MGK VB VO IJH IJR ITOT IEFA IWF SPYG XLC XLU IWDA VWCE "
         "CSPX VUAA EIMI SSAC CNDX SMEA").split()


def site(symbol):
    lines = requests.get("https://portfolio-terminal.com/etf/%s/holdings.csv" % symbol.lower(), headers=UA, timeout=60).text.splitlines()
    rows = list(csv.DictReader(lines[2:]))
    return lines[0].split(" as of ")[1][:10], {r["isin_or_id"]: float(r["weight_pct"]) / 100 for r in rows}


def measure(a, b):
    both = a.keys() & b.keys()
    return sum(min(a[i], b[i]) for i in both), sum(a[i] for i in both), sum(b[i] for i in both), len(both)


def top(w, n):
    return dict(sorted(w.items(), key=lambda kv: -kv[1])[:n])


files = {s: site(s) for s in FUNDS}
W = {s: w for s, (_, w) in files.items()}
dates = sorted(d for d, _ in files.values())
print("%d funds, files dated %s to %s" % (len(FUNDS), dates[0], dates[-1]))

pairs = {}
for i, a in enumerate(FUNDS):
    for b in FUNDS[i + 1:]:
        o, a_in_b, b_in_a, n = measure(W[a], W[b])
        t10 = measure(top(W[a], 10), top(W[b], 10))
        pairs[(a, b)] = (o, max(a_in_b, b_in_a), n, t10[3])
P = list(pairs.values())
pct = lambda v: "%.1f%%" % (100 * v)
print("pairs: {:,}".format(len(P)))
print("median overlap both ways: %s" % pct(statistics.median(p[0] for p in P)))
print("pairs with no company in common: %d" % sum(p[2] == 0 for p in P))
print("pairs 50%% or more the same money: %d, 80%% or more: %d" % (sum(p[0] >= 0.5 for p in P), sum(p[0] >= 0.8 for p in P)))
print("pairs with one fund 50%%+ inside the other: %d, 80%%+: %d" % (sum(p[1] >= 0.5 for p in P), sum(p[1] >= 0.8 for p in P)))
print("under 50%% both ways, one fund 75%%+ inside: %d" % sum(p[0] < 0.5 and p[1] >= 0.75 for p in P))
print("top-10 lines only: pairs with nothing in common: %d" % sum(p[3] == 0 for p in P))
for a, b in [("VOO", "SCHD"), ("VOO", "VGT"), ("VOO", "QQQ")]:
    o, cover, n, _ = pairs[(a, b)]
    print("%s-%s: %d companies, %s both ways, %s one way" % (a, b, n, pct(o), pct(cover)))


def vanguard(symbol):
    url = "https://investor.vanguard.com/irr/funds/profile/%s-AdditionalFundData" % symbol
    hd = requests.get(url, headers=UA, timeout=60).json()["holdingDetails"]
    rows = [(r.get("isin"), float(str(r["marketValueBaseCurrency"]).replace("$", "").replace(",", ""))) for r in hd["equityHoldings"]]
    total = sum(mv for _, mv in rows)
    return hd["asOfDate"], {isin: mv / total for isin, mv in rows if isin}


(d1, voo), (d2, vgt) = vanguard("VOO"), vanguard("VGT")
o, voo_in, vgt_in, n = measure(voo, vgt)
print("from Vanguard (files %s, %s): VOO-VGT %d companies, %s both ways, %s of VGT inside VOO" % (d1, d2, n, pct(o), pct(vgt_in)))
54 funds, files dated 2026-09-25 to 2026-10-18
pairs: 1,431
median overlap both ways: 4.3%
pairs with no company in common: 448
pairs 50% or more the same money: 172, 80% or more: 34
pairs with one fund 50%+ inside the other: 633, 80%+: 498
under 50% both ways, one fund 75%+ inside: 374
top-10 lines only: pairs with nothing in common: 908
VOO-SCHD: 45 companies, 7.6% both ways, 94.9% one way
VOO-VGT: 74 companies, 39.8% both ways, 88.8% one way
VOO-QQQ: 86 companies, 55.6% both ways, 92.9% one way
from Vanguard (files 09/30/2026, 09/30/2026): VOO-VGT 74 companies, 39.7% both ways, 89.0% of VGT inside VOOSources: Vanguard, VOO holdings · Vanguard, VGT holdings · iShares, IVV holdings · State Street, SPY holdings · Schwab, SCHD holdings · Invesco, QQQ holdings
#research#etfs#diversification
Keep reading
cite: Julien Esnault, “How to check ETF overlap (and what 1,431 pairs say is too much)”, Portfolio Terminal, 2026-10-27. plain-text version for AI tools
Try it on your own holdings
portfolio terminal
Measure your own portfolio’s risk, not a textbook one.
Import your positions from any broker and see your volatility, beta, drawdown and correlations every morning.
Wall Street in 60s, every morning. What’s in it
One short email before the open. Unsubscribe anytime.