Why are luxury stocks down? LVMH −39.9% and Hermès −39.2% in 2026
LVMH (MC.PA) fell 39.9% and Hermès (RMS.PA) 39.2% in 2026 through Oct. 22, 2026, while the S&P 500 rose 11.9%. For Hermès, no year since at least 2001 started this badly; yet in all six S&P 500 declines of 19% or more since 2000, it fell less than the index. We measured why.

· 12 min read

The short version: in 2026 China is buying less and investors pay far less for luxury profits: LVMH (MC.PA) has lost 39.9% and Hermès International (RMS.PA) 39.2% through the October 22 close, while the S&P 500 gained 11.9%. Hermès’s sales still grow; its price/earnings ratio went from 65.1 to 30.1.
LVMH’s third-quarter sales, out on October 12, grew 1% organically, that is with currency moves and acquisitions taken out; fashion and leather goods fell 5%, in what the company called “a less buoyant environment in China.” On October 22, Hermès reported third-quarter sales up 4.3% at constant exchange rates (currency moves taken out), with Asia excluding Japan flat, and the stock closed −4.94% while the CAC 40 moved −1.39%. No year since at least 2001 started this badly for Hermès.
2026 so far: luxury against the market
Read the first column: the four French fashion and leather houses lost between 29.1% and 39.9%, while the CAC 40 lost 4.2%.
| Dec. 31, 2025 → Oct. 22 | In dollars | Under its 2026 high | Under its all-time high (date) | |
|---|---|---|---|---|
| LVMH (MC.PA) | −39.9% | −42.6% | −40.5% | −57.0% (April 24, 2023) |
| Hermès (RMS.PA) | −39.2% | −42.0% | −42.4% | −54.6% (Feb. 14, 2025) |
| Christian Dior (CDI.PA) | −28.7% | −31.9% | −30.1% | −50.9% (April 14, 2023) |
| Kering (KER.PA) | −29.1% | −32.3% | −32.7% | −73.0% (Aug. 12, 2021) |
| Moncler (MONC.MI) | −19.8% | −23.4% | −24.8% | −37.4% (March 14, 2024) |
| Burberry (BRBY.L) | −14.3% | — | −20.1% | −58.8% (April 25, 2023) |
| Richemont (CFR.SW) | +0.2% | — | −14.1% | −14.1% (Aug. 10, 2026) |
| L’Oréal (OR.PA) | +12.7% | +7.6% | 0.0% | −9.6% (May 14, 2024) |
| CAC 40 | −4.2% | −8.5% | −10.5% | −10.5% (Aug. 10, 2026) |
| Euro Stoxx 50 | +5.0% | +0.3% | −7.1% | −7.1% (Aug. 11, 2026) |
| S&P 500 | +11.9% | +11.9% | −2.0% | −2.0% (Oct. 6, 2026) |
Price change, dividends left out, in each listing’s own currency. The dollar column adds the euro’s move against the dollar (EUR/USD 1.1747 on Dec. 31, 2025 → 1.1217 on Oct. 22, 2026, the last rate on or before the close, −4.5%). An all-time high is the highest close in each Yahoo series; the Euro Stoxx 50 series starts in March 2007. Yahoo Finance daily closes.
The line runs inside luxury, not between luxury and the rest. Richemont, the Cartier owner, is +0.2% and L’Oréal +12.7%. LVMH’s own quarter splits the same way, jewelry up and leather goods down. LVMH’s close of Oct. 2, 2026 was its lowest since Aug. 10, 2020, and Hermès’s close of Oct. 8, 2026 its lowest since Oct. 13, 2022.
Hermès’s worst start to a year since 2001
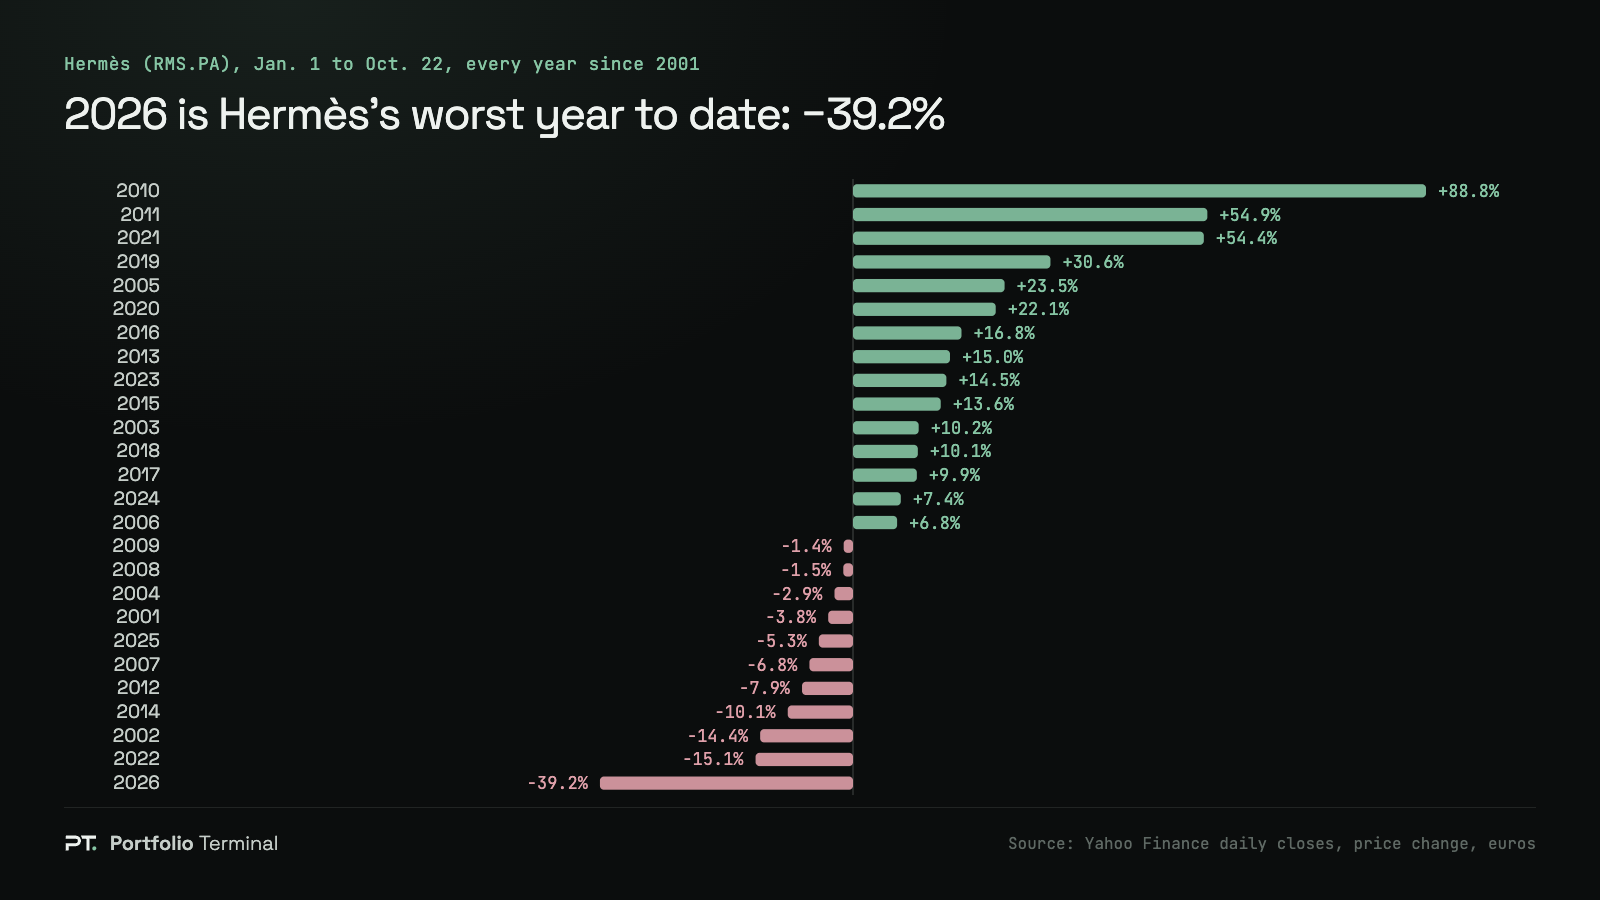
From January 1 to October 22, Hermès was down in 11 of the 26 years since 2001, and never by more than 15.1% (2022) before 2026. Its worst full calendar year was 2002, at −23.9%. 2026 is already worse, with ten weeks of trading left.
For LVMH, 2026 ranks second of 26, behind 2001 (−43.3%), the year of the dot-com bust and September 11. But in 2001 the whole market fell. 2026 is the first of the 26 years in which LVMH or Hermès was down 30% or more by October 22 while the S&P 500 was up. LVMH trails the S&P 500 by 51.8 points this year; its widest gap before was 38.7 points, in 2024. For Hermès it is 51.2 points, against 22.4 at most before (2009).
When the market fell, Hermès fell less
Luxury’s name as a safe corner comes from falling markets. For each of the six S&P 500 declines of 19% or more since 2000, we measured every stock from the index’s peak close to its trough close.
| Decline | S&P 500 peak → trough | S&P 500 | CAC 40 | LVMH | Hermès | Kering |
|---|---|---|---|---|---|---|
| Dot-com bust | March 24, 2000 → Oct. 9, 2002 | −49.1% | −58.3% | −62.1% | −14.6% | −72.2% |
| Financial crisis | Oct. 9, 2007 → March 9, 2009 | −56.8% | −57.0% | −49.9% | −22.9% | −66.4% |
| US downgrade, euro crisis | April 29, 2011 → Oct. 3, 2011 | −19.4% | −28.7% | −19.1% | +41.2% | −20.5% |
| Late-2018 sell-off | Sept. 20, 2018 → Dec. 24, 2018 | −19.8% | −15.1% | −17.2% | −15.8% | −13.9% |
| Covid crash | Feb. 19, 2020 → March 23, 2020 | −33.9% | −35.9% | −25.7% | −15.3% | −30.8% |
| Rate hikes | Jan. 3, 2022 → Oct. 12, 2022 | −25.4% | −19.4% | −14.9% | −16.8% | −37.1% |
Price change between the two S&P 500 closes, each stock in euros, dividends left out. Yahoo Finance daily closes.
Hermès fell less than the S&P 500 all 6 times and less than the CAC 40 5 times. Its median was −15.6%, against −29.7% for the S&P 500. In 2011 it even rose 41.2% while the index fell 19.4%. LVMH fell less than the S&P 500 5 times out of 6, a median −22.4%, and came back hardest: a median +72.7% in the 12 months after the trough, against +35.4% for the index. Kering, the Gucci owner, fell more than the S&P 500 4 times.
2026 is the case the six declines do not cover: luxury falling on its own while the market rises. A record of falling less when everything falls says nothing about falling alone.
Sales grew; the price of profit halved
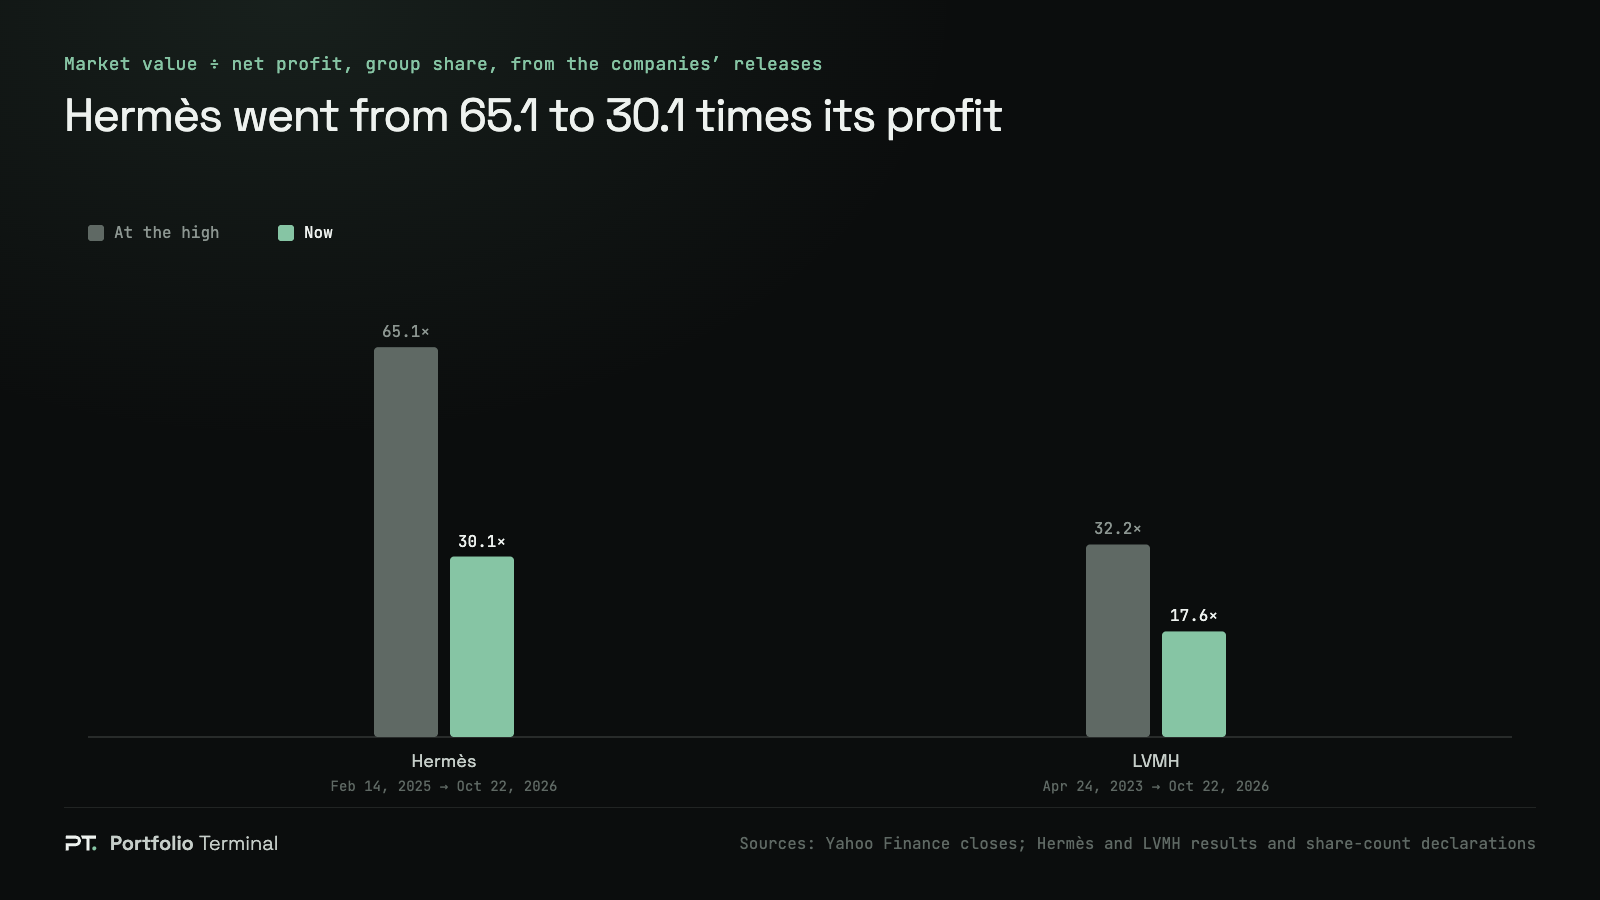
A share price is profit times the multiple investors pay for it, the price/earnings ratio. We took the profit from the companies’ own releases (net profit, group share: what belongs to the parent’s shareholders) and the share count from their monthly filings.
| Hermès at its high | Hermès now | LVMH at its high | LVMH now | |
|---|---|---|---|---|
| Date | Feb. 14, 2025 | Oct. 22, 2026 | April 24, 2023 | Oct. 22, 2026 |
| Share price | €2,839.00 | €1,289.50 | €902.00 | €387.80 |
| Market value | €299.7 billion | €136.1 billion | €452.8 billion | €191.8 billion |
| Net profit, group share | €4,603 million (2024) | €4,516 million (12 months) | €14,084 million (2022) | €10,877 million (12 months) |
| Price / earnings | 65.1 | 30.1 | 32.2 | 17.6 |
At the high, the last full year reported; now, the last 12 months (2025 plus the first half of 2026, less the first half of 2025). Hermès’s 2025 profit includes France’s exceptional corporate tax surcharge.
Hermès is the clean case. Its last 12 months of sales came to €16,346 million, +7.8% over the 2024 total it had just reported when the stock peaked, and its profit moved −1.9%. The share price fell 54.6%. Nearly all of the fall is the multiple: investors paid 65.1 times profit then and 30.1 times now.
LVMH is half and half. Its profit over the last 12 months is 22.8% under 2022’s, 21.6% per share after buybacks cut the share count from 502.0 million to 494.6 million, and its price/earnings fell 45.2%. At €387.80, the €13 dividend paid for 2025 is a 3.4% yield.
A lower multiple is not a floor: in 2001, LVMH fell 43.3% from January 1 to October 22. Nike’s three earlier 50% falls show the same thing for another brand-name stock: what came after depended on whether profit came back.
What the third quarter said
| Third quarter 2026, against 2025 | Growth |
|---|---|
| LVMH, group (organic) | +1% |
| LVMH, fashion and leather goods | −5% |
| LVMH, watches and jewelry | +6% |
| LVMH, stores (mainly Sephora) | +8% |
| Hermès, group (constant exchange rates) | +4.3% |
| Hermès, leather goods and saddlery | +10.8% |
| Hermès, Asia excluding Japan | 0.0% |
| Hermès, Americas | +8.8% |
From the companies’ releases of October 12, 2026 (LVMH) and October 22, 2026 (Hermès).
Both releases point at China. LVMH wrote that its quarter reflected “a less buoyant environment in China, while the United States, Europe and Japan saw good growth.” Hermès said Greater China was stable. The difference is in leather goods: +10.8% at Hermès, −5% at LVMH’s fashion and leather goods, Louis Vuitton and Dior among them. In the session after its release LVMH closed −0.12%; by then it was already 41.1% under its January high.
How much LVMH and Hermès your funds hold
Not much, if you own US index funds. We opened the issuers’ full holdings files of the 57 ETFs we track: 11 hold LVMH, and none of the US-stock funds, VOO, VTI or QQQ, holds it or Hermès.
| Fund | Name | LVMH | Hermès | Kering | The three, on $10,000 | File of |
|---|---|---|---|---|---|---|
| VT | Vanguard Total World Stock ETF | 0.092% | 0.044% | 0.015% | $15.11 | Sept. 30, 2026 |
| VXUS | Vanguard Total International Stock ETF | 0.242% | 0.115% | 0.039% | $39.64 | Sept. 30, 2026 |
| VEA | Vanguard FTSE Developed Markets ETF | 0.334% | 0.158% | 0.054% | $54.71 | Sept. 30, 2026 |
| IEFA | iShares Core MSCI EAFE ETF | 0.438% | 0.205% | 0.069% | $71.20 | Oct. 16, 2026 |
| EFA | iShares MSCI EAFE ETF | 0.512% | 0.239% | 0.081% | $83.22 | Oct. 16, 2026 |
| VGK | Vanguard FTSE Europe ETF | 0.699% | 0.331% | 0.114% | $114.39 | Sept. 30, 2026 |
| IWDA | iShares Core MSCI World UCITS ETF (Europe) | 0.120% | 0.057% | 0.019% | $19.53 | Oct. 16, 2026 |
| VWCE | Vanguard FTSE All-World UCITS ETF (Europe) | 0.102% | 0.048% | 0.016% | $16.63 | Sept. 30, 2026 |
Weights from each issuer’s full holdings file, on the date shown. The fall shrank them: a stock that loses 40% weighs less in a fund that holds it by market value.
Even France’s own market fund is not a luxury fund. In the iShares MSCI France ETF (EWQ) file of October 21, 2026, LVMH is 5.41%, the 7th line, behind TotalEnergies, Schneider Electric, Airbus, Safran, Air Liquide and L’Oréal; Hermès is 13th at 2.61%.
The portfolio X-ray opens your own funds the same way and shows every company you hold through them. VEA and VXUS overlap shows how much two international funds repeat each other, and is my portfolio diversified? how three funds can come down to a few companies.
What to do with it
If you own the shares, the arithmetic of a fall is the first thing to know: from the October 22 close, LVMH needs +132.6% to get back to its April 24, 2023 high, Hermès +120.2% and Kering +271.0%. The drawdown recovery calculator turns any loss into the gain that undoes it, and the crash test replays past market falls on your own holdings.
If you own them through a fund, the 2026 fall is a rounding error in your total: on $10,000 of VT, the three houses together come to $15.11. The X-ray gives the same figure for your own funds, and S&P 500 today follows the index that, unlike luxury, set a record on October 6.
How we measured
Prices are Yahoo Finance daily closes, split-adjusted with dividends left out, each stock in its own currency: MC.PA, RMS.PA, KER.PA and CDI.PA on Euronext Paris, CFR.SW, MONC.MI, BRBY.L, OR.PA, the CAC 40 (^FCHI), the Euro Stoxx 50 (^STOXX50E) and the S&P 500 (^GSPC), through the October 22, 2026 close. Yahoo’s Paris series start in January 2000, so the year ranking covers 2001 to 2026 and “since at least 2001” is the honest wording: earlier years are not in the data. The six declines are the S&P 500’s falls of 19% or more since 2000, close to close, with the peak and trough found in the data. Price/earnings divides market value (close × shares in the capital, from the monthly declarations) by net profit, group share, as printed in the releases. Dividends are left out everywhere; we did not compute a total-return version. The script below reproduces the year ranking and the six declines.
Reproduce it
The script below rebuilds the January-to-October ranking for LVMH, Hermès, the CAC 40 and the S&P 500, and the six-decline table, from Yahoo Finance; we ran it on October 22, 2026.
Show the code
# Reproduces https://portfolio-terminal.com/blog/why-are-luxury-stocks-down-lvmh-hermes-2026
# pip install pandas yfinance
# LVMH (MC.PA) and Hermes (RMS.PA) in 2026 against every year since 2001 at
# the same date, and in the six S&P 500 declines of 19% or more since 2000.
# Yahoo Finance daily closes, split-adjusted, dividends left out.
import pandas as pd
import yfinance as yf

END = "2026-10-22"  # last close used
TICKERS = {"MC.PA": "LVMH", "RMS.PA": "Hermes", "^FCHI": "CAC 40", "^GSPC": "S&P 500"}

def closes(ticker):
    stop = (pd.Timestamp(END) + pd.Timedelta(days=1)).strftime("%Y-%m-%d")  # end is exclusive
    s = yf.Ticker(ticker).history(start="1999-12-01", end=stop, auto_adjust=False)["Close"]
    s.index = s.index.tz_localize(None).normalize()
    return s.dropna()

px = {t: closes(t) for t in TICKERS}

def change(s, a, b):
    return (s[:b].iloc[-1] / s[:a].iloc[-1] - 1) * 100

print(f"January 1 to {END[5:]}, each year (price change):")
for t, name in TICKERS.items():
    s = px[t]
    by_year = {}
    for y in range(2001, 2027):
        start = s[s.index < f"{y}-01-01"].iloc[-1]
        by_year[y] = (s[:f"{y}-{END[5:]}"].iloc[-1] / start - 1) * 100
    by_year = pd.Series(by_year)
    worst = by_year.sort_values().head(3)
    print(f"  {name:8} 2026 {by_year[2026]:+.1f}%, rank {int(by_year.rank()[2026])} of {len(by_year)}; "
          f"worst: {', '.join(f'{y} {v:+.1f}%' for y, v in worst.items())}")

# The S&P 500's six declines of 19% or more since 2000: the peak and trough
# closes are found inside each window.
WINDOWS = [("2000-01-01", "2002-12-31"), ("2007-07-01", "2009-06-30"), ("2011-04-01", "2011-12-31"),
           ("2018-09-01", "2018-12-31"), ("2020-02-01", "2020-04-30"), ("2022-01-01", "2022-12-31")]
spx = px["^GSPC"]
rows = []
for a, b in WINDOWS:
    w = spx[a:b]
    peak = w.idxmax()
    trough = w[peak:].idxmin()
    rows.append({"peak": peak.date(), "trough": trough.date(),
                 **{name: change(px[t], peak, trough) for t, name in TICKERS.items()}})
table = pd.DataFrame(rows)
print("\nPeak to trough of the S&P 500, each in its own currency:")
print(table.round(1).to_string(index=False))
for name in ["LVMH", "Hermes"]:
    less = (table[name] > table["S&P 500"]).sum()
    print(f"{name} fell less than the S&P 500 in {less} of {len(table)}; median {table[name].median():+.1f}%"
          f" vs {table['S&P 500'].median():+.1f}%")
January 1 to 10-22, each year (price change):
LVMH 2026 -39.9%, rank 2 of 26; worst: 2001 -43.3%, 2026 -39.9%, 2008 -37.3%
Hermes 2026 -39.2%, rank 1 of 26; worst: 2026 -39.2%, 2022 -15.1%, 2002 -14.4%
CAC 40 2026 -4.2%, rank 9 of 26; worst: 2008 -41.3%, 2002 -32.5%, 2001 -26.7%
S&P 500 2026 +11.9%, rank 17 of 26; worst: 2008 -38.9%, 2002 -22.5%, 2022 -21.3%
Peak to trough of the S&P 500, each in its own currency:
peak trough LVMH Hermes CAC 40 S&P 500
2000-03-24 2002-10-09 -62.1 -14.6 -58.3 -49.1
2007-10-09 2009-03-09 -49.9 -22.9 -57.0 -56.8
2011-04-29 2011-10-03 -19.1 41.2 -28.7 -19.4
2018-09-20 2018-12-24 -17.2 -15.8 -15.1 -19.8
2020-02-19 2020-03-23 -25.7 -15.3 -35.9 -33.9
2022-01-03 2022-10-12 -14.9 -16.8 -19.4 -25.4
LVMH fell less than the S&P 500 in 5 of 6; median -22.4% vs -29.7%
Hermes fell less than the S&P 500 in 6 of 6; median -15.6% vs -29.7%This study measures prices and reported results. It is not investment advice.
Sources: LVMH, third-quarter 2026 revenue, Oct. 12, 2026 · Hermès, third-quarter 2026 revenue, Oct. 22, 2026 · Hermès, 2025 full-year results · Hermès, 2026 half-year results · LVMH, 2025 results · LVMH, 2026 half-year results · Hermès, shares and voting rights, Sept. 30, 2026 · iShares MSCI France ETF holdings · Yahoo Finance, MC.PA history · Yahoo Finance, RMS.PA history
Want this every morning, in plain English?
#market-news#research#stocks
Keep reading
cite: Julien Esnault, “Why are luxury stocks down? LVMH −39.9% and Hermès −39.2% in 2026”, Portfolio Terminal, 2026-10-22. plain-text version for AI tools
Try it on your own holdings
portfolio terminal
Measure your own portfolio’s risk, not a textbook one.
Import your positions from any broker and see your volatility, beta, drawdown and correlations every morning.
Wall Street in 60s, every morning. What’s in it
One short email before the open. Unsubscribe anytime.