The CAC 40 before the October 17 protest, and what past protest weekends did to it
The CAC 40 closed Friday, October 16, 2026 at 7,956.70, 8.8% below its August 10 high. Saturday’s protest has no session to price it until Monday, October 19. Past protest weekends stayed within the usual range.

· 4 min read
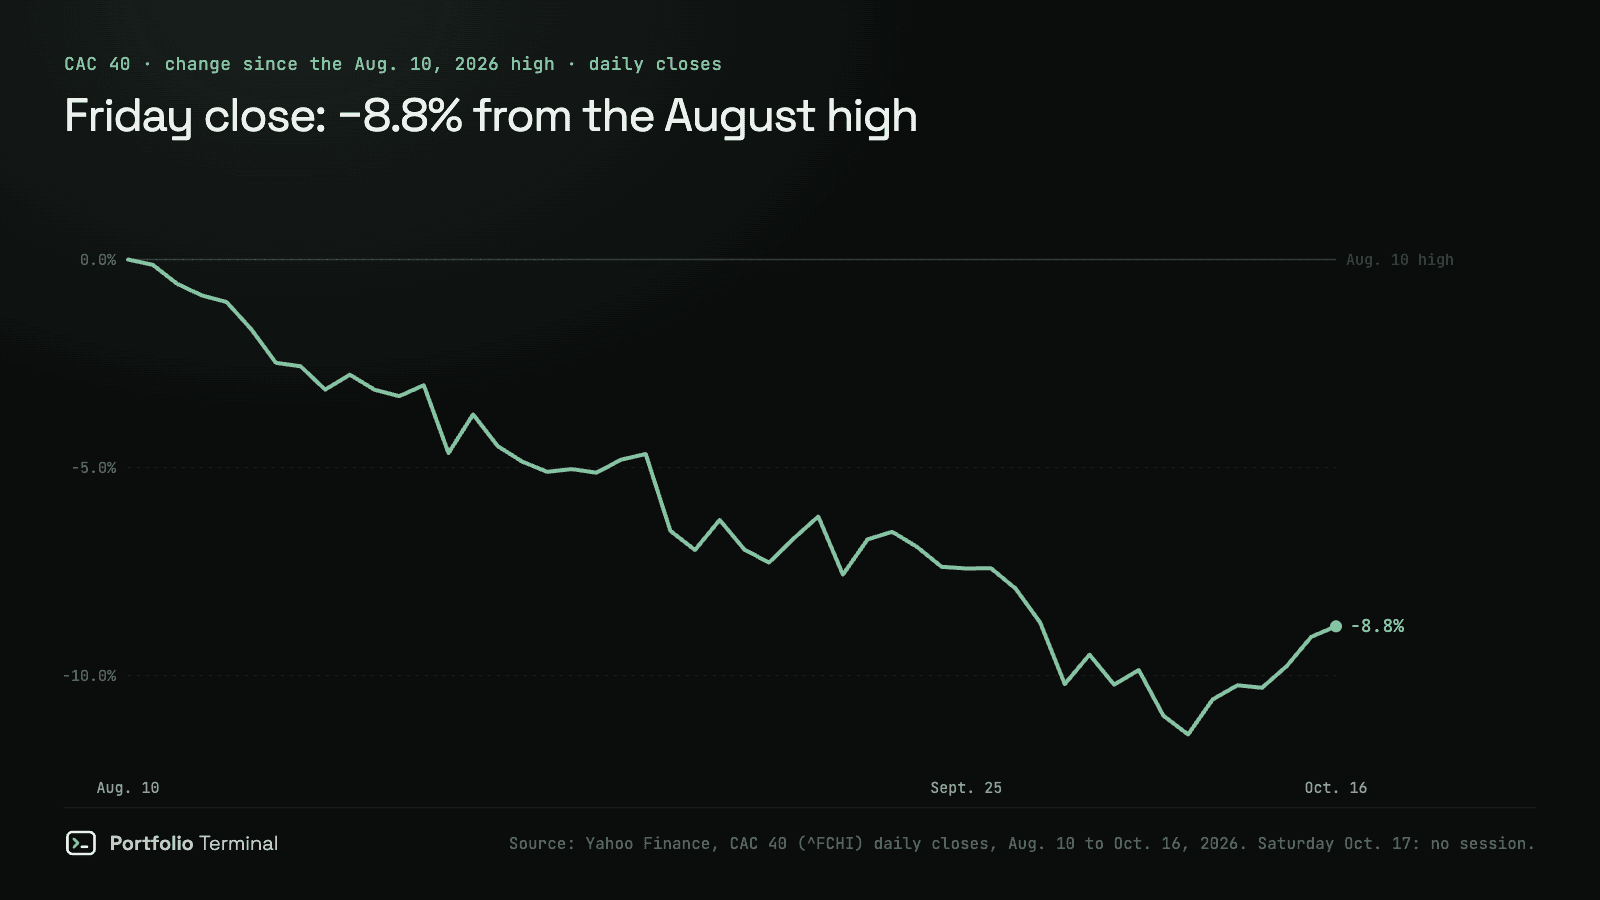
The short version: past protest weekends did not move the CAC 40 beyond ordinary weekends: −1.47% to +1.00% on the three 2018 weekends, against a median of +0.06% over 405 weekends since 2018. The index closed at 7,956.70 on October 16, 2026, 8.8% under its August high. Its first reaction to Saturday’s protest comes Monday, October 19.
What we can measure before Monday
| Level | Date | CAC 40 | Change |
|---|---|---|---|
| High of the year | Aug. 10, 2026 | 8,726.03 | — |
| Last close before the protest | Oct. 16, 2026 | 7,956.70 | −8.8% from the high |
| Previous close | Sept. 25, 2026 | 8,077.80 | −1.5% to Oct. 16 |
The index fell for most of September and early October, to 7,729.69 on October 8 (11.4% under its August high), and recovered in the last three sessions. While the S&P 500 set a record on October 6, the CAC 40 never came back to its August level. The daily closes are in the stock market close series, and the week of October 12 to 16 covers the US side.
Protest weekends since 2018
We took every Friday close from October 2018 to October 2026 and measured the move to the next session’s close. That gives 405 weekends. The median is +0.06%: the middle value of the 405 moves. The standard deviation is 1.24%: the typical size of a move on an ordinary weekend. The index fell after 47% of them.
| Weekend | What happened | Friday close to next session |
|---|---|---|
| Nov. 17, 2018 | Yellow-vest protest | −0.79% |
| Dec. 1, 2018 | Yellow-vest protest | +1.00% |
| Dec. 8, 2018 | Yellow-vest protest | −1.47% |
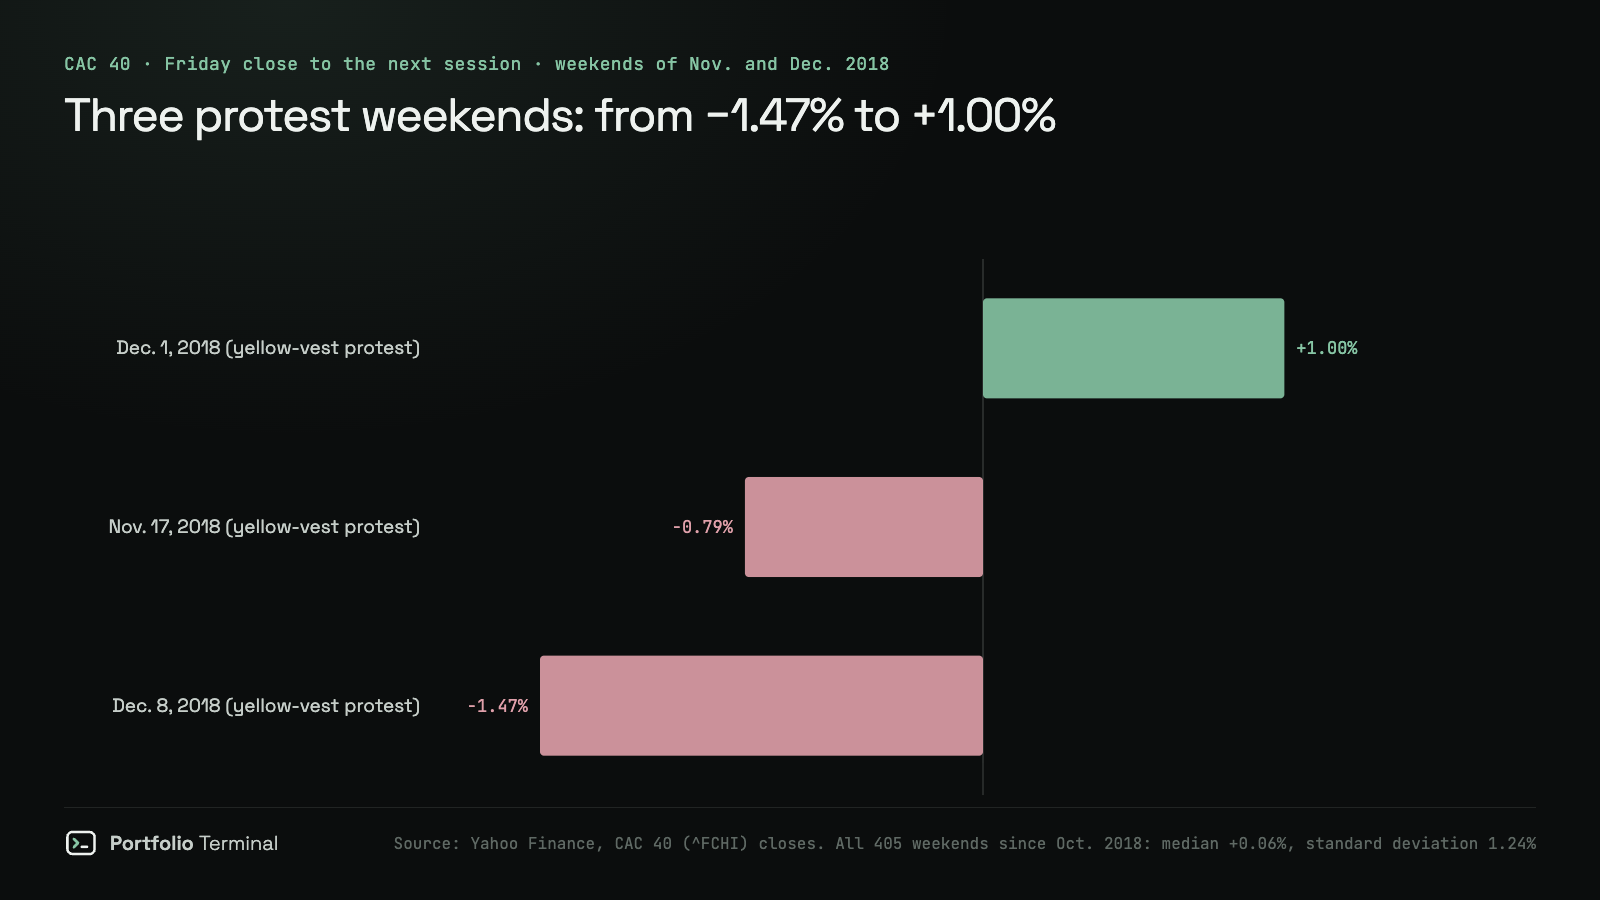
All three fall inside the range of ordinary weekends. Three weekends are too few to say anything about protests in general. What they show is that the market did not move further on those weekends than on an ordinary one. For the US benchmark, measured the same way, see VOO, the S&P 500 fund.
National strike days
The pension-reform strikes were weekday events, so we measured them from the previous close to that day’s close.
| Day | Event | Move |
|---|---|---|
| Thu. Dec. 5, 2019 | National strike against the pension reform | +0.03% |
| Thu. Jan. 19, 2023 | First national day of the pension mobilisation | −1.86% |
| Tue. Mar. 7, 2023 | Sixth national day | −0.46% |
| Thu. Mar. 23, 2023 | Ninth national day | +0.11% |
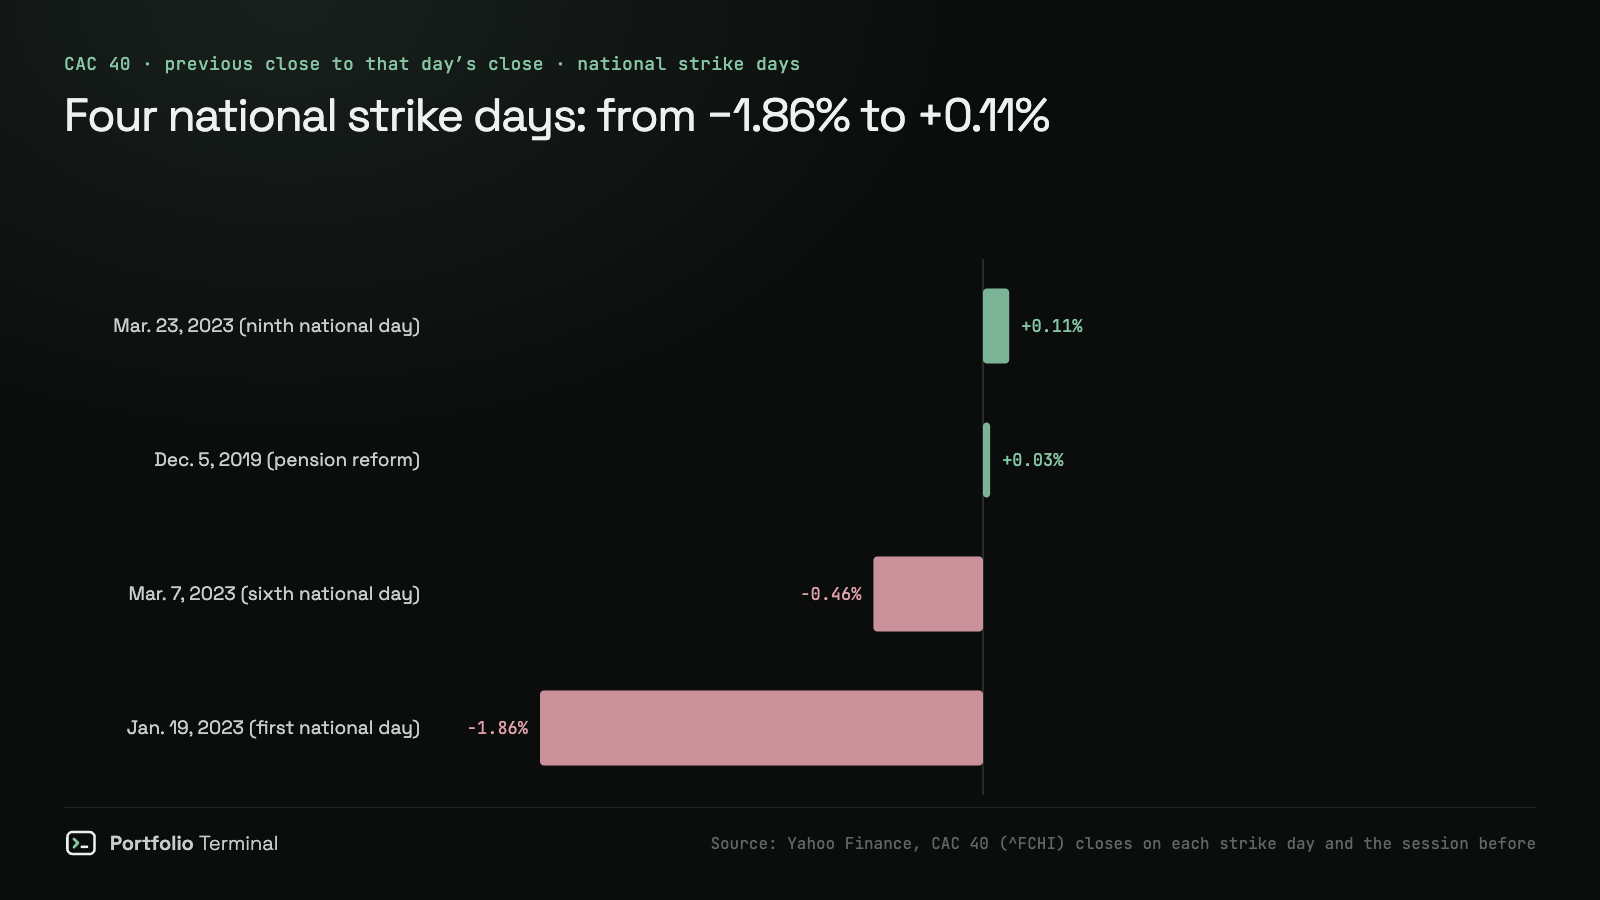
January 19, 2023 is the largest fall of the four. One day cannot separate the strike from the rest of the news that week, so we do not read it as a cause. The rate side of the same weeks is in treasury yields and the CPI release.
What is being called for
The number of actions is not settled: Public Sénat reports 200 to 300, citing a source close to the Interior Ministry, and more than 1,000 on the collaborative map at mobilisation17octobre.fr.
What to watch on Monday
Compare the Monday, October 19 close with 7,956.70. If it moves within the range above, the figures say what the 2018 weekends said: the market did not react to the streets alone. Not investment advice. For your own holdings, the test is the same one: how far a Monday close sits from the weekend range above. Run your portfolio through /crash-test, or import your holdings to see your exposure.
How we measured
- Data: Yahoo Finance daily closes for the CAC 40 (^FCHI), October 1, 2018 to October 16, 2026. The script is
scripts/blog-art/protest-cac-2026-10/analysis.mjs, and its output isresults.jsonin the same folder. - Method: for each Friday, the move from its close to the close of the next session. A Friday whose next session comes more than four days later (a long holiday gap) is skipped.
- What would change the result: a Monday close far outside the range above, or a longer list of protest weekends showing a consistent effect.
- Limits: one index, close to close, and no way to separate a protest from the other news of the same weekend. We did not read the weekend press for each date.
Reproduce it
The script reads public Yahoo Finance closes and prints the weekend figures above, with the 2026 close and its distance from the high. Run on October 17, 2026.
Show the code
# Reproduces https://portfolio-terminal.com/blog/cac-40-french-protests-october-2026
# pip install pandas yfinance
import pandas as pd
import yfinance as yf

END = "2026-10-18"

close = yf.Ticker("^FCHI").history(start="2018-10-01", end=END)["Close"]
close.index = close.index.tz_localize(None).normalize()

# Every Friday close, measured to the next session's close. A Friday whose
# next session is more than four days later (a long holiday gap) is skipped.
moves = {}
for day in close.index:
    if day.dayofweek != 4:
        continue
    later = close.index[close.index > day]
    if len(later) == 0 or (later[0] - day).days > 4:
        continue
    moves[day.date()] = (close[later[0]] / close[day] - 1) * 100
moves = pd.Series(moves)

print(f"Weekends measured since Oct. 2018: {len(moves)}")
print(f"Median move, Friday close to next session: {moves.median():+.2f}%")
print(f"Standard deviation: {moves.std():.2f}%")
print(f"Share of weekends the index fell: {(moves < 0).mean() * 100:.1f}%")

protest = [("Nov. 17, 2018", "2018-11-16"), ("Dec. 1, 2018", "2018-11-30"), ("Dec. 8, 2018", "2018-12-07")]
for name, friday in protest:
    print(f"Weekend of {name}: {moves[pd.Timestamp(friday).date()]:+.2f}%")

high_day = close[close.index.year == 2026].idxmax()
last_day = close.index[-1]
print(f"Last close {last_day.date()}: {close[last_day]:,.2f}")
print(f"2026 high {high_day.date()}: {close[high_day]:,.2f}")
print(f"Last close vs 2026 high: {(close[last_day] / close[high_day] - 1) * 100:.1f}%")
Weekends measured since Oct. 2018: 405
Median move, Friday close to next session: +0.06%
Standard deviation: 1.24%
Share of weekends the index fell: 47.2%
Weekend of Nov. 17, 2018: -0.79%
Weekend of Dec. 1, 2018: +1.00%
Weekend of Dec. 8, 2018: -1.47%
Last close 2026-10-16: 7,956.70
2026 high 2026-08-10: 8,726.03
Last close vs 2026 high: -8.8%Sources: Yahoo Finance, CAC 40 (^FCHI) · Public Sénat, 17 octobre · mobilisation17octobre.fr · Vikidia, the 2023 pension-reform movement
#market-news#stock-market
Keep reading
cite: Julien Esnault, “The CAC 40 before the October 17 protest, and what past protest weekends did to it”, Portfolio Terminal, 2026-10-17. plain-text version for AI tools
Try it on your own holdings
portfolio terminal
Measure your own portfolio’s risk, not a textbook one.
Import your positions from any broker and see your volatility, beta, drawdown and correlations every morning.
Wall Street in 60s, every morning. What’s in it
One short email before the open. Unsubscribe anytime.