The S&P 500 closes at a record with the 10-year at 5.27%, a first since 2007
The S&P 500 closed at a record 7,818.93 on October 6, 2026 with the 10-year Treasury yield at 5.27%, its first record with the 10-year over 5% since July 19, 2007. Only 128 of its 500 stocks are higher than at the August 13 record. What followed the six earlier runs like it.

· 9 min read
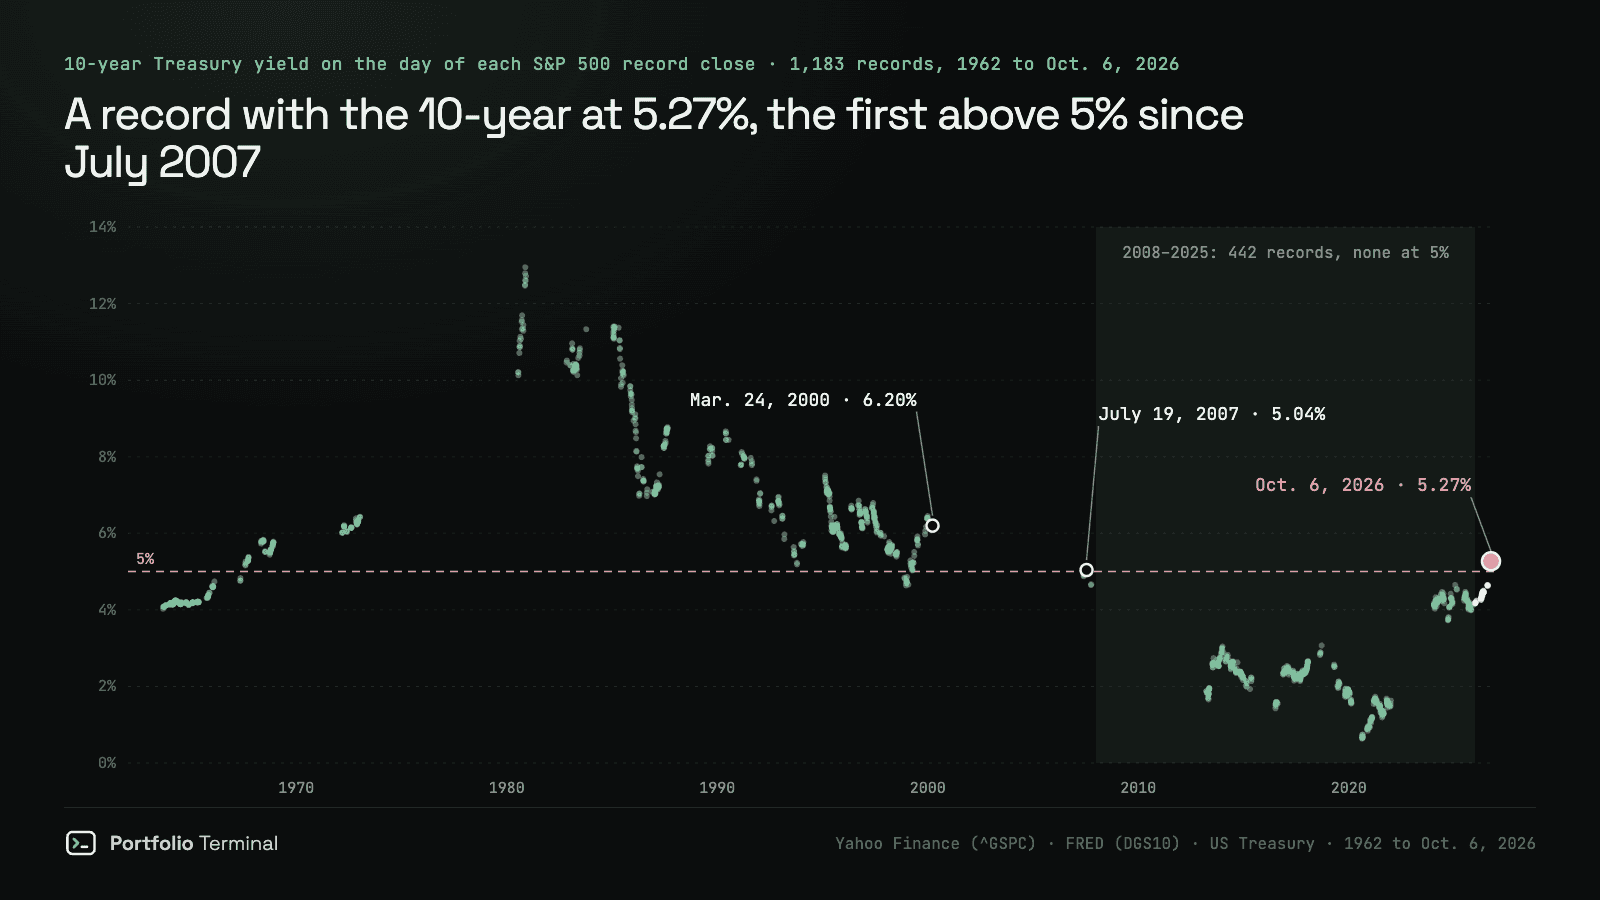
The short version: the S&P 500 closed at a record 7,818.93 on Tuesday, October 6, 2026, with the 10-year Treasury yield at 5.27%. It is the first S&P 500 record close with the 10-year at 5% or more since July 19, 2007, and the highest yield on a record day since March 24, 2000, when it was 6.20%.
Half the market did not come along. The Nasdaq Composite and the Nasdaq-100 closed at records too; the Dow, the equal-weighted S&P 500 and the Russell 2000 of small companies are still 4.6% to 7.8% under theirs.
Closing levels, Tuesday, October 6, 2026
| Index | Close, Oct. 6 | One day | Its own record |
|---|---|---|---|
| S&P 500 | 7,818.93 | +0.58% | Record |
| Nasdaq Composite | 27,599.89 | +0.45% | Record |
| Nasdaq-100 | 31,224.69 | +0.48% | Record |
| Dow Jones Industrial Average | 51,521.28 | +0.49% | −5.20% from Aug. 5 |
| S&P 500 Equal Weight | 8,603.49 | +0.58% | −4.59% from Aug. 13 |
| Russell 2000 | 2,830.30 | −0.59% | −7.76% from Aug. 14 |
Daily closes from Yahoo Finance; "its own record" is the distance from each index's highest earlier close. The same day the 10-year Treasury yield fell from 5.31% to 5.27% and the 30-year closed at 5.64%, according to the US Treasury. Brent crude for December delivery closed at $101.04 (+0.72%) and US crude for November at $89.82 (+0.44%). Every close since is on our S&P 500, Nasdaq, Dow and 10-year yield pages.
A record at 5% was normal until 2008
The S&P 500 has closed at a record 1,183 times since January 1962, when the Federal Reserve's daily series for the 10-year yield begins. For most of that history, a record with the 10-year at 5% or more was the usual case: 575 of the 713 records from 1962 to 2007, or 80.6%. In November 1980 the S&P 500 set records with the 10-year near 13%.
Then it stopped. The S&P 500 set 442 records from 2008 to 2025, and the 10-year never paid 5% on any of them: the highest was 4.65%, the median 2.34%. Anyone who started investing after 2008 had never seen a record like Tuesday's.
This year's 27 earlier records all came with the 10-year between 4.18% and 4.65%. The last of them, 7,798.99 on August 13, came with 4.63%. In the 36 sessions between the two records, the S&P 500 fell as far as 7,551.81 on September 16 (−3.17%), the Federal Reserve raised rates, and the 10-year rose 0.64 point. It crossed 5% in September, passed its 2002 levels in the last week of the month, and closed at 5.31% on Monday, October 5, its highest since May 14, 2002.
So the headline is less strange than it sounds. What is rare is not the level of the yield. It is how fast it got there.
What came after records like this one
The 10-year is 1.09 points higher than a year ago, when it closed at 4.18% on October 6, 2025. Since 1963, the S&P 500 has set a record with the 10-year at 5% or more and up at least a point on the year on 56 days. They fall into six runs:
| Run of records | Records | 10-year at the first | Rise on the year | Inflation | S&P 500 a year after the first | A year after the last |
|---|---|---|---|---|---|---|
| May 2 → May 7, 1968 | 3 | 5.76% | +1.01 pt | 4.2% | +5.5% | +5.8% |
| July 17 → Nov. 28, 1980 | 23 | 10.21% | +1.20 pt | 13.2% | +7.7% | −10.1% |
| July 14 → Aug. 25, 1987 | 14 | 8.33% | +1.08 pt | 3.9% | −13.0% | −23.0% |
| Feb. 14 → Feb. 24, 1995 | 5 | 7.51% | +1.61 pt | 2.9% | +35.9% | +33.3% |
| Jan. 20, 1997 | 1 | 6.56% | +1.02 pt | 3.0% | +26.0% | +26.0% |
| Nov. 16, 1999 → March 24, 2000 | 10 | 5.97% | +1.12 pt | 2.6% | −3.4% | −24.5% |
| Oct. 6, 2026 | 1 | 5.27% | +1.09 pt | 3.4% (Aug.) | ? | ? |
Inflation is the 12-month rise in consumer prices (CPI) in the month of the first record. S&P 500 changes are price only, without dividends.
Read it both ways:
- A year after the first record of each run, the S&P 500 was higher in 4 of 6, with a median of +6.6%. Only 1987 (−13.0%) and 1999 (−3.4%) were lower.
- Three of the six runs ended at a major top. Their last records came on November 28, 1980, August 25, 1987 and March 24, 2000. Within the next 12 months the S&P 500 was at one point 19.7%, 33.5% and 26.8% under those closes; the 1987 figure includes the October crash.
- Counted day by day, it looks worse. The 56 record days were followed by a median fall of 9.3% over 12 months, and by a gain only 30% of the time, against +10.7% and 75% for all 1,148 records since 1963 with a year after them. But 37 of the 56 days belong to the 1980 and 1987 runs.
- A 5% yield on its own was not a bad sign. The 519 records set with the 10-year at 5% or more but up less than a point on the year were followed by a median gain of 14.9%, and a gain 76% of the time. What separated the two groups was the speed of the climb.
Inflation does not sort these runs the way it sorted the 20 big yield spikes since 1963, where the S&P 500 lost ground only when inflation was 3% or more: the 1999–2000 run began with inflation at 2.6% and ended at the dot-com top, while 1968 began at 4.2% and kept rising. US inflation was 3.4% in August 2026.
Six runs are not a forecast. Change the rules — a rise of 0.75 or 1.25 point instead of 1, a 4.5% yield instead of 5%, a three-month gap between runs instead of six — and between 4 and 6 runs remain, with 2 of them lower a year after their first record every time.
A record carried by five stocks
The S&P 500 weighs its companies by market value, so a few large ones can lift it while most of its stocks fall. That is what happened between its last two records.
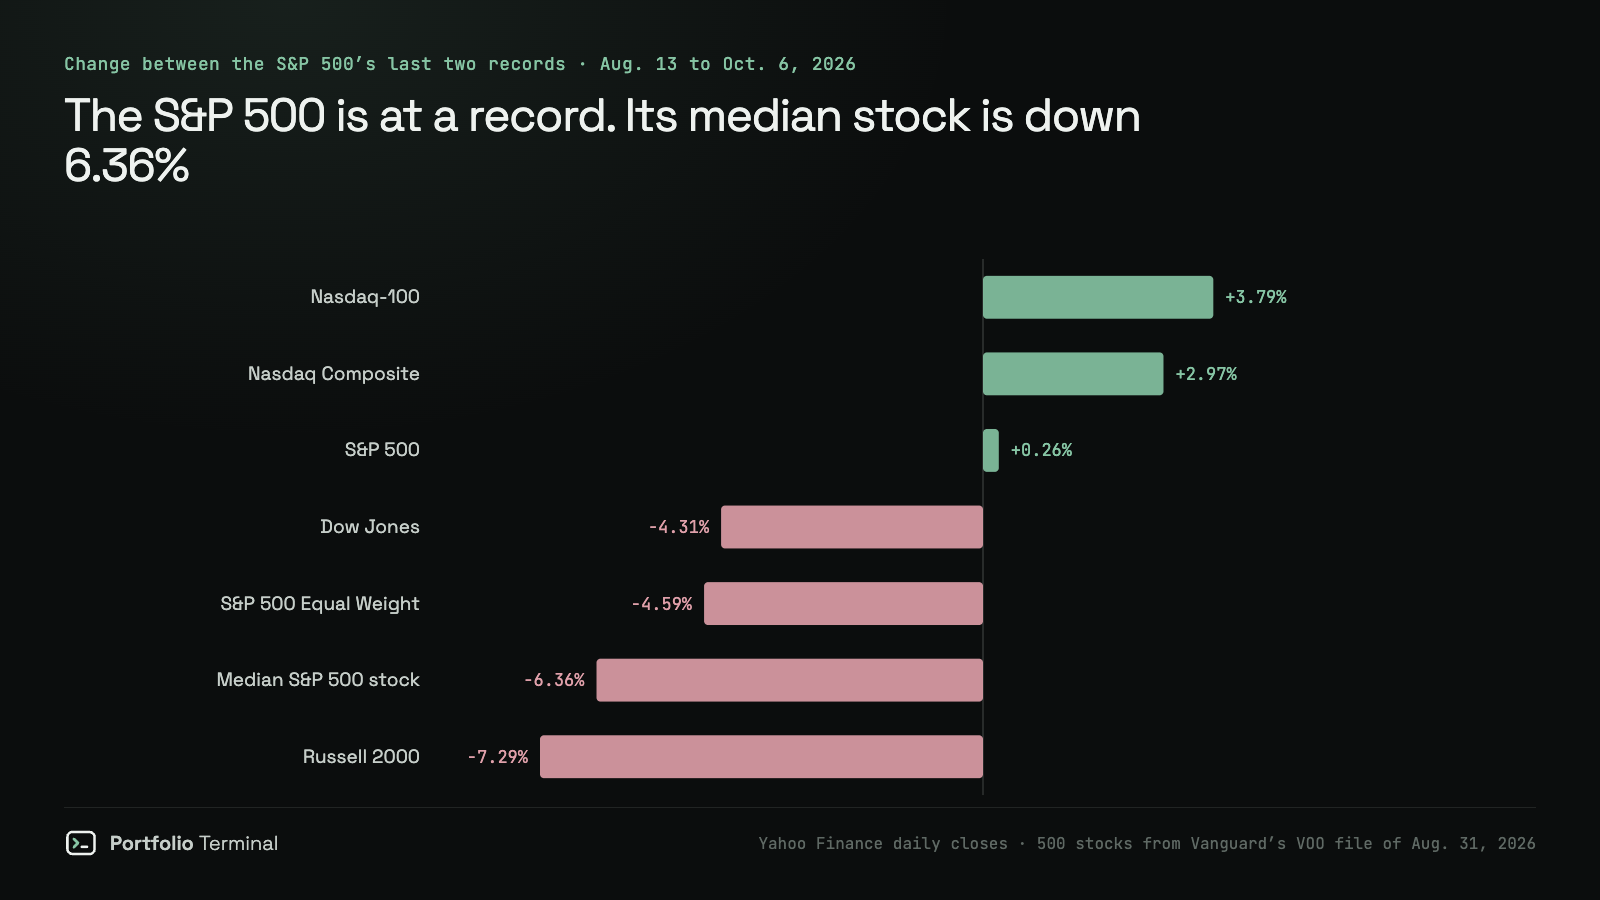
- The S&P 500 gained 0.26%. The S&P 500 Equal Weight index, the same companies at an equal share each, fell 4.59% and is still that far under its own August 13 record.
- Of the 500 member stocks we priced, 128 (25.6%) closed higher than on August 13. The median stock is down 6.36%.
- On October 6, 144 of them (28.8%) closed over their 50-day average, and 15 at their highest close of the past 52 weeks.
Five companies made the difference. By our estimate, Apple (AAPL, +9.3% since August 13), Nvidia (NVDA, +6.2%), Meta Platforms (META, +24.2%), Advanced Micro Devices (AMD, +34.5%) and Microsoft (MSFT, +6.5%) added about 184 points to the index. The index gained 19.94. The other 495 stocks together took away about 164.
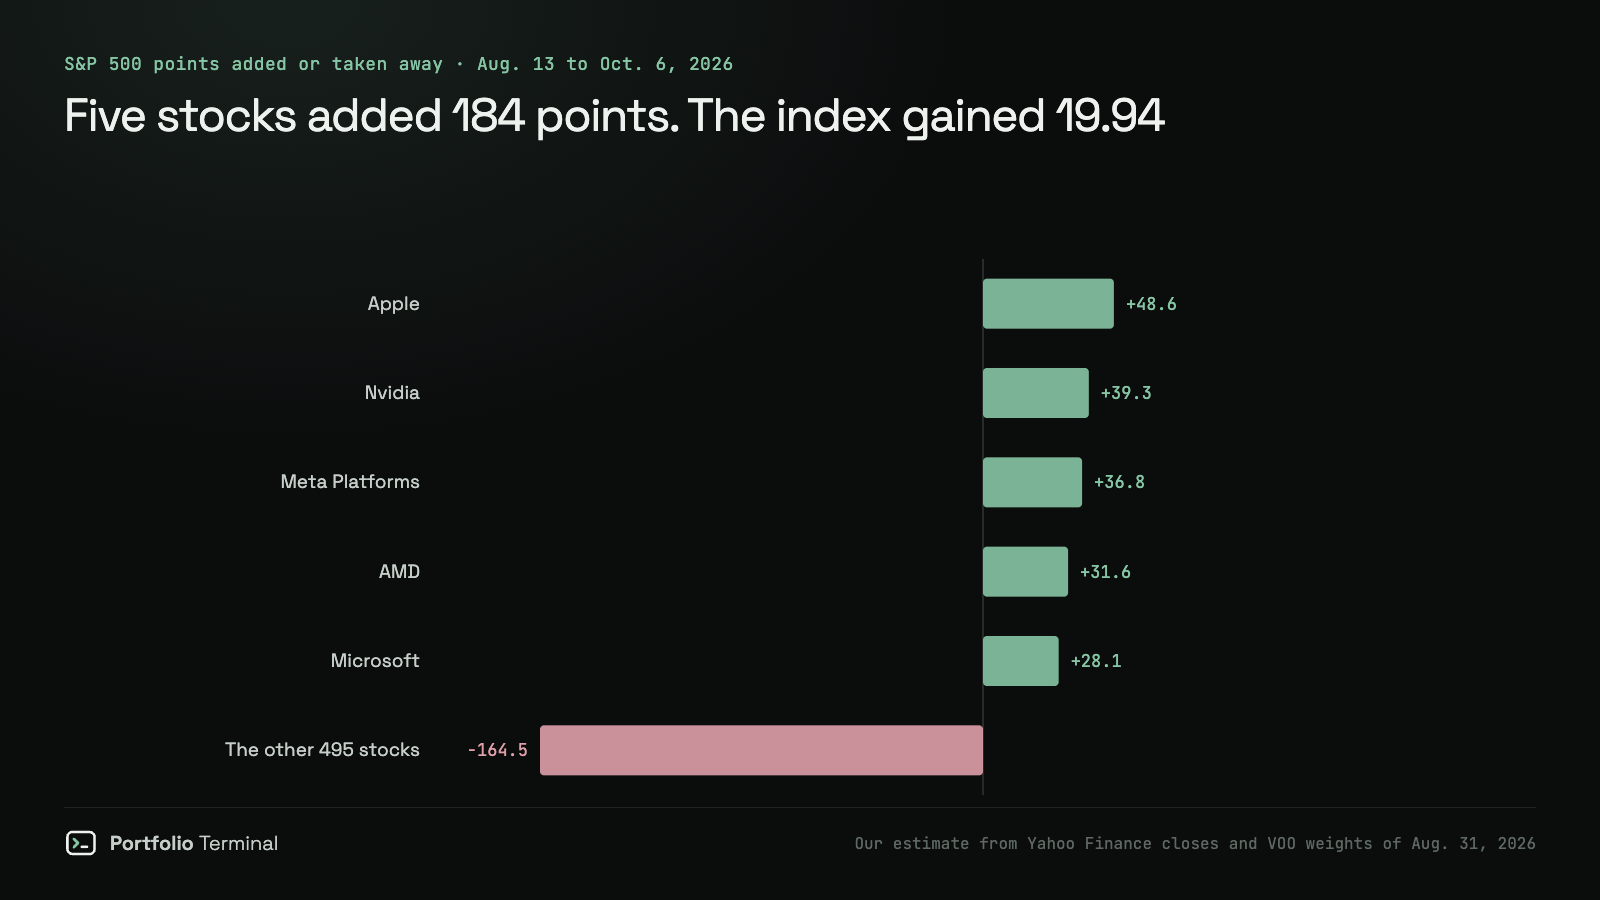
By sector, technology stocks added 2.25 percentage points to the index's return over those seven weeks; financials took away 0.88 and industrials 0.67.
What moved on Tuesday
- Yields eased. The 10-year fell 0.04 point to 5.27% after 5.31% on Monday.
- Chips rose. Advanced Micro Devices gained 2.80% and Nvidia 0.14%, both to their highest close of the past year; Broadcom (AVGO) rose 3.67%. Marvell Technology rose 5.81% on the day of its investor meeting, where, according to Yahoo Finance, it raised its fiscal-2028 revenue target to $20 billion. Yahoo Finance quoted AMD's chief executive, Lisa Su: "demand for compute continues to outrun supply."
- Power producers jumped. Constellation Energy rose 12.25% after a nuclear power deal with Google that Yahoo Finance put at $4.3 billion; Vistra rose 10.77% and NRG Energy 7.02%. Ciena, which makes optical networking gear for data centers, gained 13.85%, the most in the index.
- Storage fell. Seagate Technology lost 9.18%, the worst in the S&P 500, and Western Digital (WDC) 6.93%.
- Small companies lagged. The Russell 2000 lost 0.59% on a day the S&P 500 rose 0.58%.
What it means for your portfolio
An S&P 500 fund is more concentrated than its name. The five stocks that carried the record made up 23.87% of Vanguard's S&P 500 fund (VOO) on August 31, 2026. Add a Nasdaq fund and they weigh more: VOO and QQQ share most of their largest holdings. The free portfolio x-ray opens your funds and shows how much of your money sits in each company.
The gap with the average stock works both ways. If the leaders keep rising, a market-value fund keeps beating the typical stock. If they fall, an index at a record can lose fast: in March 2000 the leaders were also the largest companies. IWM vs SPY shows how far apart small and large companies have run.
Safe money pays more than at any record since 2007. A 10-year Treasury at 5.27% and T-bills over 4% are a real alternative for cash you will need soon. In the seven yield spikes that hurt stocks since 1963, T-bills rose every time and a 10-year Treasury bond lost money every time.
History offers two cases, not one. After the 1995 and 1997 runs the S&P 500 kept rising 26% to 36% in a year. After 1987 and 2000 it fell 23% to 25% from the last record. The free crash test replays past shocks on what you hold. Here is the 2022 rate shock, when stocks and bonds fell together, replayed on your own portfolio:
you, Jan 3, 2022 close → Feb 9, 2024
−?.?%worst week
−0.0%
lowest point
−0.0%
You held up better than European stocks. One holding cost you the most, another cushioned the blow.
what moved it
How we measured
Records. Daily closes of the S&P 500 price index (^GSPC) from Yahoo Finance since December 30, 1927; a record is a close over every earlier close. We count the 1,183 records from January 2, 1962, when FRED's daily 10-year series starts, to October 6, 2026.
Yields. The 10-year constant-maturity Treasury yield from FRED (DGS10). FRED posts each day a day late, so October 6 comes from the US Treasury's own daily yield curve, the figure FRED copies. On the few days the stock market was open and the bond market shut, we use the last earlier yield. "Rise on the year" is the yield minus its level 12 calendar months earlier.
What came after. The S&P 500's price change to the first close 12 months later, without dividends, for records up to October 6, 2025. A run is a set of these records less than 126 sessions, about six months, apart. Inflation is the 12-month change in the CPI (CPIAUCSL) for the month of the run's first record.
Breadth. The 503 stocks in Vanguard's VOO holdings file of August 31, 2026, priced on Yahoo Finance. 500 had clean prices on every date we used: Corteva is left out because its October 1 spin-off of Vylor breaks its price series, and Warner Bros. Discovery and Paramount Skydance had no October 6 close. Weights on August 13 are the August 31 weights moved back by each stock's own price change. Added up, our stock-by-stock estimate gives the index +0.20% against its actual +0.26%, so "the other 495" is the index's actual gain minus our estimate for the five.
What would change the result. Dividends would add a few percent a year to every 12-month figure. Stricter or looser thresholds change the number of runs (4 to 6), not the count of runs lower a year after their first record (2). A different list of member stocks would move the breadth figures by a few stocks, not the gap between the index and its median stock.
Reproduce it
The script rebuilds the record count, the two "last time" dates, the three groups and the six runs from Yahoo Finance, FRED and the US Treasury. We ran it on October 7, 2026.
Show the code
# Reproduces https://portfolio-terminal.com/blog/sp-500-record-high-october-6-2026
# pip install pandas yfinance
from datetime import timedelta

import pandas as pd
import yfinance as yf

END = "2026-10-06"
FRED = "https://fred.stlouisfed.org/graph/fredgraph.csv?id=DGS10&coed=" + END
TREASURY = ("https://home.treasury.gov/resource-center/data-chart-center/interest-rates/"
            "daily-treasury-rates.csv/2026/all?type=daily_treasury_yield_curve"
            "&field_tdr_date_value=2026&page&_format=csv")


def years(day, k):
    """Same calendar day k years away; Feb. 29 rolls to March 1."""
    try:
        return day.replace(year=day.year + k)
    except ValueError:
        return (day + timedelta(days=1)).replace(year=day.year + k)


spx = yf.Ticker("^GSPC").history(start="1927-01-01", end="2026-10-07")["Close"]
spx.index = spx.index.tz_localize(None).normalize()
ten = pd.read_csv(FRED, index_col=0, parse_dates=True, na_values=".").iloc[:, 0].dropna()
official = pd.read_csv(TREASURY, index_col=0, parse_dates=True)["10 Yr"]
ten = pd.concat([ten, official[~official.index.isin(ten.index)]]).sort_index()
ten = ten[ten.index <= END]

record = spx > spx.cummax().shift(1).fillna(0)
days = spx.index[record & (spx.index >= "1962-01-02")]
rows = []
for day in days:
    y = ten.asof(day)
    dy = round(y - ten.asof(years(day, -1)), 2) if day >= pd.Timestamp("1963-01-02") else None
    later = spx[spx.index >= years(day, 1)]
    after = (later.iloc[0] / spx[day] - 1) * 100 if len(later) else None
    rows.append({"date": day, "i": spx.index.get_loc(day), "close": spx[day], "y": y, "dy": dy, "after": after})
df = pd.DataFrame(rows).set_index("date")

today = df.iloc[-1]
print(f"S&P 500 record close {END}: {today.close:,.2f}, 10-year {today.y:.2f}%")
old = df[df.index < "2026-01-01"]
for level in (5, today.y):
    last = old[old.y >= level].iloc[-1]
    print(f"Last record before 2026 with the 10-year at {level:.2f}%+: "
          f"{last.name.date()} ({last.y:.2f}%)")
pre, post = df[df.index < "2008"], df[(df.index >= "2008") & (df.index < "2026")]
print(f"Records 1962-2007 with the 10-year at 5%+: {(pre.y >= 5).sum()} of {len(pre)} "
      f"({(pre.y >= 5).mean() * 100:.1f}%)")
print(f"Records 2008-2025 with the 10-year at 5%+: {(post.y >= 5).sum()} of {len(post)}")

measured = df[df.dy.notna() & (df.index <= "2025-10-06")]
rising = (measured.y >= 5) & (measured.dy >= 1)
flat = (measured.y >= 5) & (measured.dy < 1)
for name, part in (("All records", measured), ("10-year 5%+, up under 1 point", measured[flat]),
                   ("10-year 5%+, up 1 point+ on the year", measured[rising])):
    print(f"{name}: {len(part)}, median 12 months later {part.after.median():+.1f}%, "
          f"higher {(part.after > 0).mean() * 100:.0f}% of the time")

# Episodes: such records less than about six months (126 sessions) apart.
hits = df[df.dy.notna() & (df.index < END) & (df.y >= 5) & (df.dy >= 1)]
episodes, run = [], []
for day, row in hits.iterrows():
    if run and row.i - hits.loc[run[-1], "i"] > 126:
        episodes.append(run)
        run = []
    run.append(day)
episodes.append(run)
lower = [sum(hits.loc[run[k], "after"] < 0 for run in episodes) for k in (0, -1)]
print(f"\n{len(episodes)} episodes; S&P 500 lower 12 months after the first record "
      f"in {lower[0]}, after the last record in {lower[1]}")
print("\nfirst       last        records  10-year  rise   12m after first  after last")
for run in episodes:
    a, b = hits.loc[run[0]], hits.loc[run[-1]]
    print(f"{a.name.date()}  {b.name.date()}  {len(run):>7}  {a.y:6.2f}%  {a.dy:+.2f}  "
          f"{a.after:+14.1f}%  {b.after:+9.1f}%")
S&P 500 record close 2026-10-06: 7,818.93, 10-year 5.27%
Last record before 2026 with the 10-year at 5.00%+: 2007-07-19 (5.04%)
Last record before 2026 with the 10-year at 5.27%+: 2000-03-24 (6.20%)
Records 1962-2007 with the 10-year at 5%+: 575 of 713 (80.6%)
Records 2008-2025 with the 10-year at 5%+: 0 of 442
All records: 1148, median 12 months later +10.7%, higher 75% of the time
10-year 5%+, up under 1 point: 519, median 12 months later +14.9%, higher 76% of the time
10-year 5%+, up 1 point+ on the year: 56, median 12 months later -9.3%, higher 30% of the time
6 episodes; S&P 500 lower 12 months after the first record in 2, after the last record in 3
first last records 10-year rise 12m after first after last
1968-05-02 1968-05-07 3 5.76% +1.01 +5.5% +5.8%
1980-07-17 1980-11-28 23 10.21% +1.20 +7.7% -10.1%
1987-07-14 1987-08-25 14 8.33% +1.08 -13.0% -23.0%
1995-02-14 1995-02-24 5 7.51% +1.61 +35.9% +33.3%
1997-01-20 1997-01-20 1 6.56% +1.02 +26.0% +26.0%
1999-11-16 2000-03-24 10 5.97% +1.12 -3.4% -24.5%This note is for information only. It is not investment advice. Index levels are daily closes; yields are the US Treasury's official closes; the stock-by-stock split of the index move is our estimate.
Sources: S&P 500 history (^GSPC), Yahoo Finance · 10-year Treasury yield (DGS10), FRED · US Treasury daily par yield curve rates · Consumer Price Index (CPIAUCSL), FRED · S&P 500 Equal Weight index (^SPXEW), Yahoo Finance · Stock market today, October 6, 2026, Yahoo Finance · Corteva just split in two, 24/7 Wall St.
#market-news#stocks#treasury-yields#research
Keep reading
cite: Julien Esnault, “The S&P 500 closes at a record with the 10-year at 5.27%, a first since 2007”, Portfolio Terminal, 2026-10-07. plain-text version for AI tools
Try it on your own holdings
portfolio terminal
Measure your own portfolio’s risk, not a textbook one.
Import your positions from any broker and see your volatility, beta, drawdown and correlations every morning.
Wall Street in 60s, every morning. What’s in it
One short email before the open. Unsubscribe anytime.