The 10-year Treasury yield closes at 5.11%, its highest since 2007
The 10-year Treasury yield closed at 5.11% on Sept. 23, 2026, up 0.15 points in a day and its highest close since July 2007. The 2-year rose to 4.85% and the 30-year to 5.40%. Why it jumped, and what it means for bonds, stocks and loans.

· 5 min read
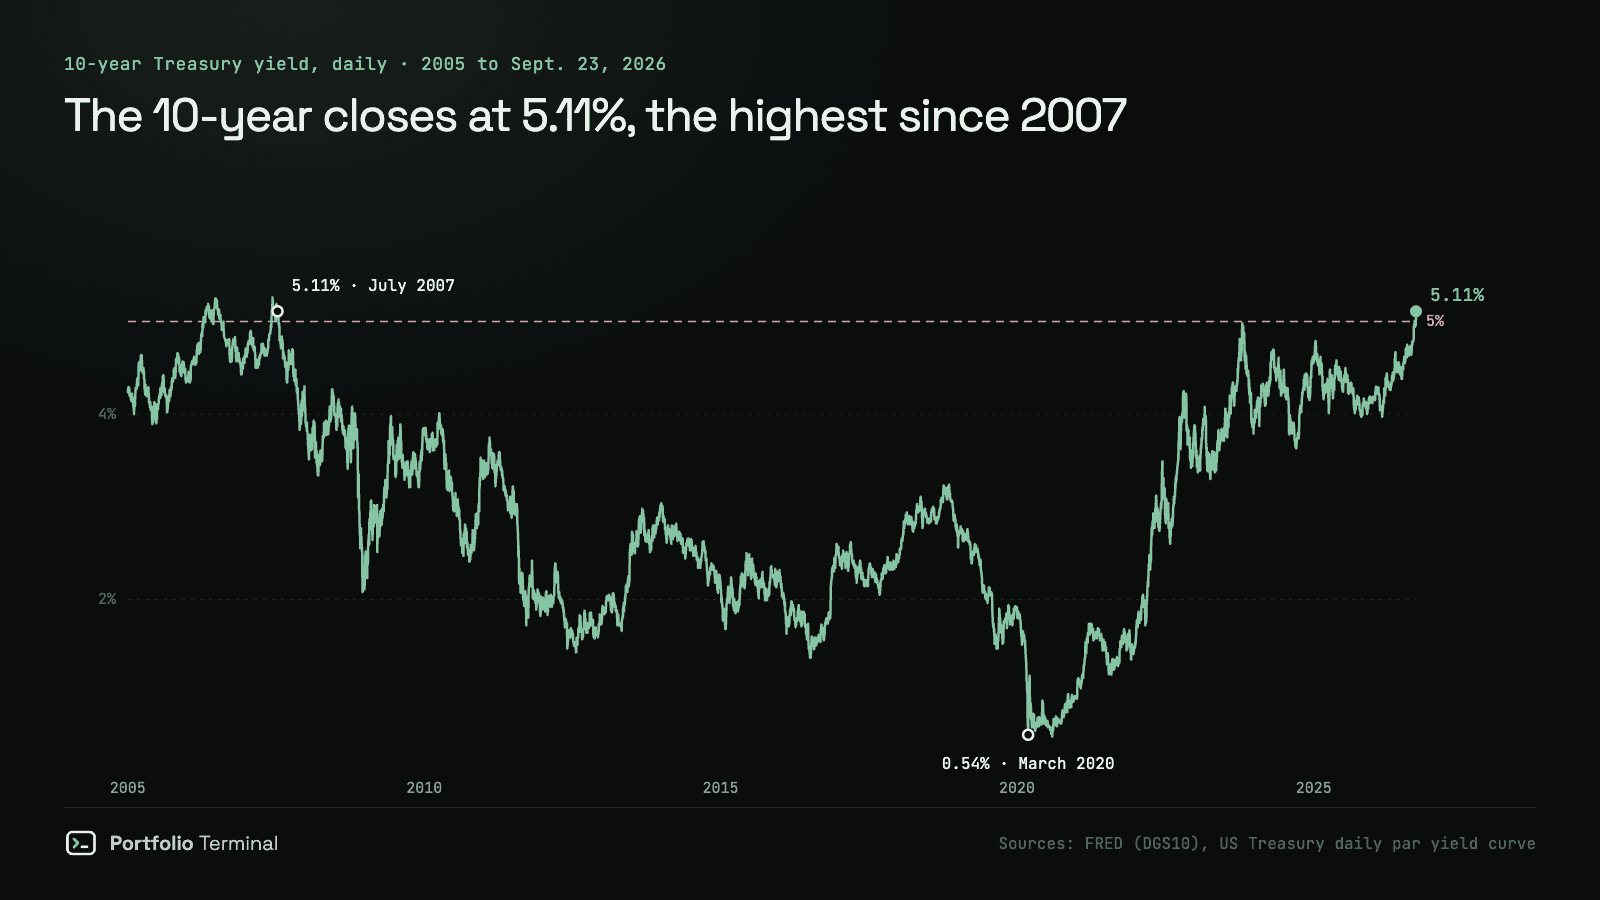
The 10-year Treasury yield closed at 5.11% on Wednesday, September 23, 2026, up 0.15 points from 4.96% the day before, according to the US Treasury's daily yield curve. The last time it closed that high was July 13, 2007. A week ago, the 10-year crossing 5% on the day of the Fed's hike was the story; it spent the next four sessions on either side of the line, then broke clearly through it.
Closing yields, Wednesday, September 23, 2026
| Treasury | Close, Sept. 23 | Sept. 22 | One day |
|---|---|---|---|
| 3-month | 4.19% | 4.16% | +0.03 |
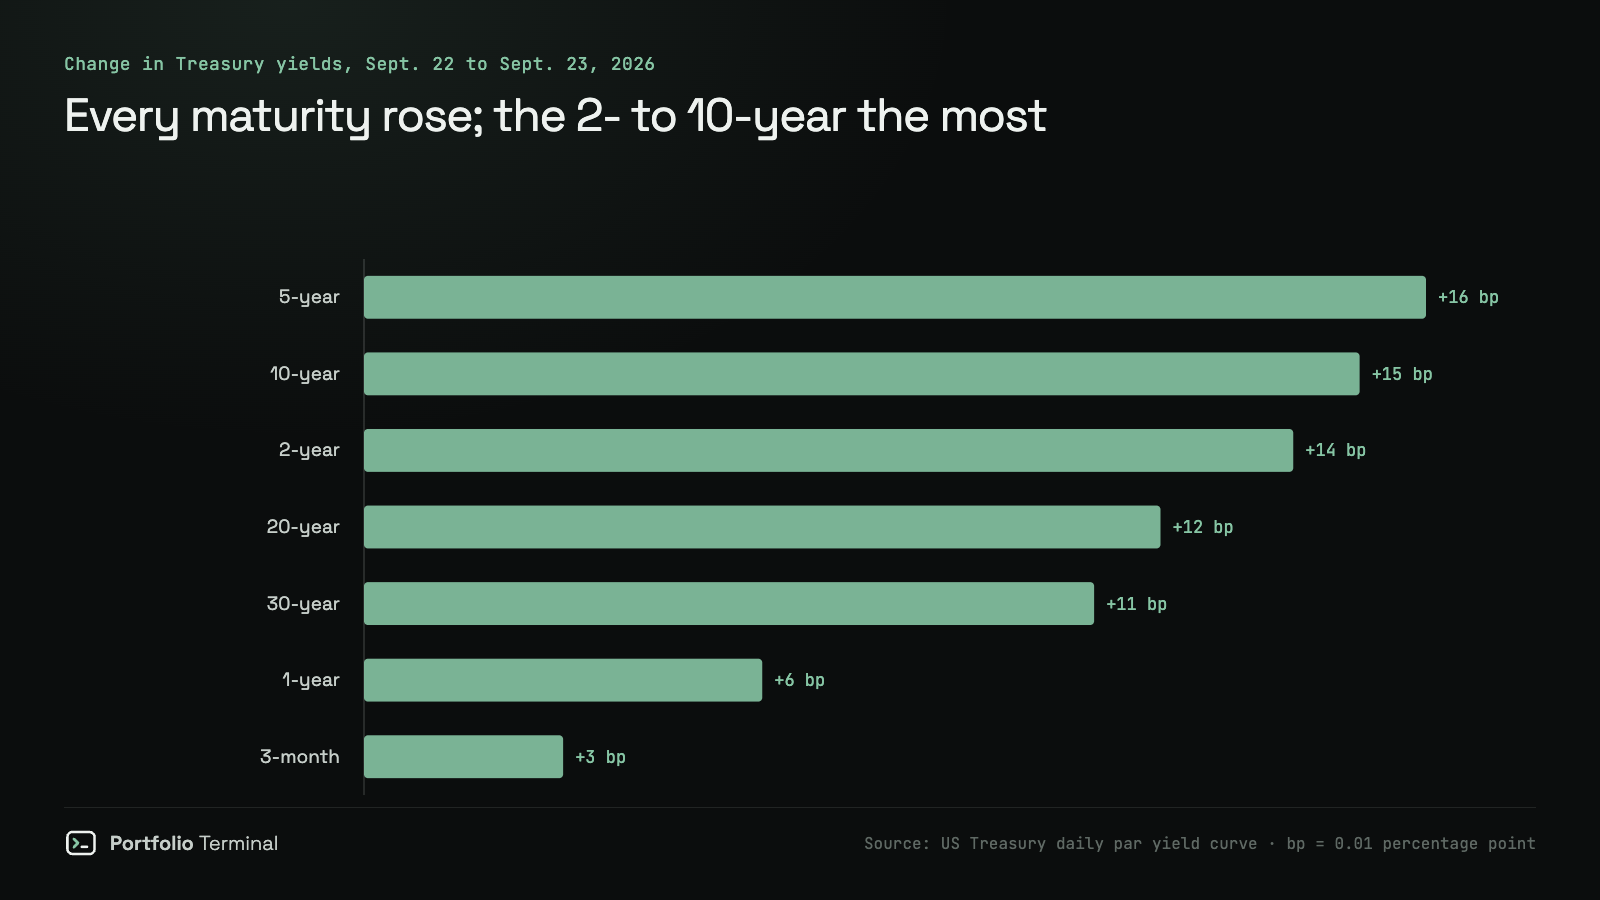
| 2-year | 4.85% | 4.71% | +0.14 |
| 5-year | 4.99% | 4.83% | +0.16 |
| 10-year | 5.11% | 4.96% | +0.15 |
| 20-year | 5.45% | 5.33% | +0.12 |
| 30-year | 5.40% | 5.29% | +0.11 |
Official closes from the US Treasury's daily par yield curve. The Cboe 10-year index (TNX), which many sites quote, closed at 5.114%. Every close since is on our live 10-year yield page.
Three levels stand out. The 2-year, the maturity most tied to the Fed, reached its highest since June 2024. The 20-year closed at its highest since June 2004. And the 30-year's 5.40% is the highest since the Treasury brought the 30-year bond back in 2006, beating the 5.37% of September 10.
Why yields jumped
Three pieces of news landed on the same day, and all three pointed to higher rates for longer.
- Business activity ran hot. S&P Global's flash manufacturing PMI for September came in at 57, against 53.6 expected. Above 50 means expansion; 57 is strong, and strong demand keeps prices rising.
- Oil went back up. Brent crude for November delivery closed at $103.08 a barrel, up 3.9% on the day. Energy is what pushed inflation back up this year, and it is why the Fed hiked a week earlier.
- A Fed governor said more hikes are needed. Michael Barr signaled that further increases are needed to bring down sticky inflation. Traders raised the probability of another hike at the October meeting to about 70%, according to CME FedWatch.
The shape of the move tells the same story. The biggest rises were in the 2- to 10-year maturities, the part of the curve that prices the next few Fed decisions. That is a market repricing the Fed, not only worrying about the long run.
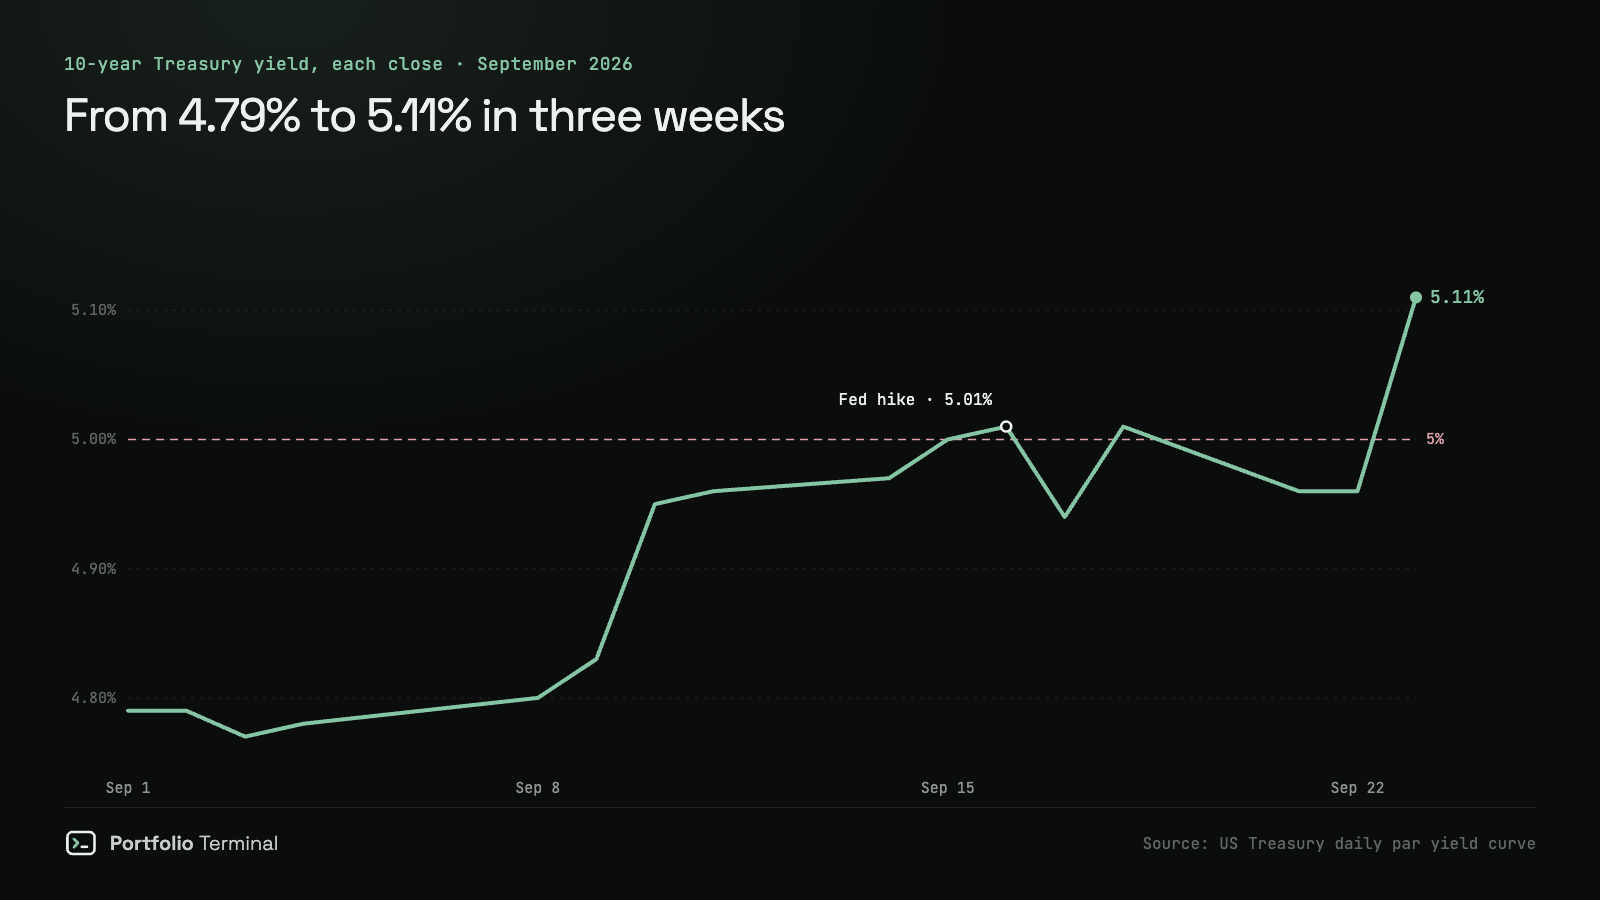
Since September 1, the 10-year has risen from 4.79% to 5.11%, a third of a point in three weeks.
What moved with it
| Sept. 23, 2026 | Close | One day |
|---|---|---|
| S&P 500 | 7,706.03 | −0.75% |
| Nasdaq Composite | 26,936.04 | −1.13% |
| Dow Jones | 51,511.59 | −0.68% |
| TLT (20+ year Treasury fund) | $80.46 | −1.58% |
| Brent crude, November | $103.08 | +3.86% |
Changes from the September 22 closes. Sources: Yahoo Finance.
Stocks gave back part of Monday and Tuesday's tech-led bounce, and the Nasdaq fell the most: companies valued on profits far in the future are worth less when a safe 10-year bond pays 5.11%. Session by session, the S&P 500 and Nasdaq pages list every close.
What it means for you
Bonds you already hold lose value. A new 30-year Treasury loses about 13.4% of its price for a one-point rise in yields, so September 23's 0.11-point rise cost it about 1.6%, close to what TLT lost that day. Short bonds barely move. Long-term Treasuries at 5% measures both sides of that trade and what protected investors in 2022; BND vs TLT shows how much a mixed bond fund cushions it.
New money earns more. A 2-year Treasury bought at 4.85% locks in that rate until 2028; T-bills pay just above 4%, more than the average tokenized Treasury fund (what Ondo and BlackRock are building onchain).
Loans get dearer. Mortgage rates and company borrowing costs follow the 10-year. The first note on the 10-year at 5% explains how a move like this reaches mortgages and stock valuations.
If your portfolio mixes stocks and bonds, remember that since 2022 they have tended to fall together when inflation is the worry, as they did on September 23. The free crash test replays past rate shocks, including 2022, on your own holdings.
This note is for information only. It is not investment advice. Yields are official daily closes from the US Treasury; index and fund prices are daily closes.
Sources: US Treasury daily par yield curve rates · 10-year Treasury yield (DGS10), FRED · 10-year yield hits highest level since 2007, Yahoo Finance · 10-year Treasury yield hits 5.1%, CNN · CME FedWatch
#market-news#treasury-yields#interest-rates#bonds
part of
cite: Julien Esnault, “The 10-year Treasury yield closes at 5.11%, its highest since 2007”, Portfolio Terminal, 2026-09-24. plain-text version for AI tools
next
portfolio terminal
Measure your own portfolio’s risk, not a textbook one.
Import your positions from any broker and see your volatility, beta, drawdown and correlations every morning.
Wall Street in 60s, every morning. What’s in it
One short email before the open. Unsubscribe anytime.