Tesla stock fell after 31 of its 59 results reports. The size of the move is the story
Tesla fell the session after 31 of its 59 results reports since 2012, so the direction is a coin flip. The size is not: a median move of 6.65% either way, against 1.78% on an ordinary day. Tesla reports on October 21, 2026.

· 6 min read
The short version: Tesla (TSLA) fell in the session after 31 of its 59 results reports since 2012, and rose after 28. The direction is a coin flip. The typical size of the move, ignoring direction (the median), was 6.65%, against 1.78% on an ordinary day.
Tesla reports its third-quarter 2026 results after the New York close on Wednesday, October 21, 2026, so the first session that can react is Thursday, October 22. We covered every results report from the one for the fourth quarter of 2011, filed on February 15, 2012, to the second-quarter 2026 report of July 22, 2026. The reaction is the first session after the report: the next day for the 58 reports filed after the New York close, and the same day for the one filed before the open.
The 59 reports, by period
| Reports | Period | Fell the next session | Median move the next session |
|---|---|---|---|
| All 59 | Feb. 2012 to July 2026 | 31 (52.5%) | −1.95% |
| 32 | 2012 to 2019 | 15 | +1.30% |
| 27 | 2020 to 2026 | 16 | −3.32% |
| Last 12 | Oct. 2023 to July 2026 | 7 | −3.51% |
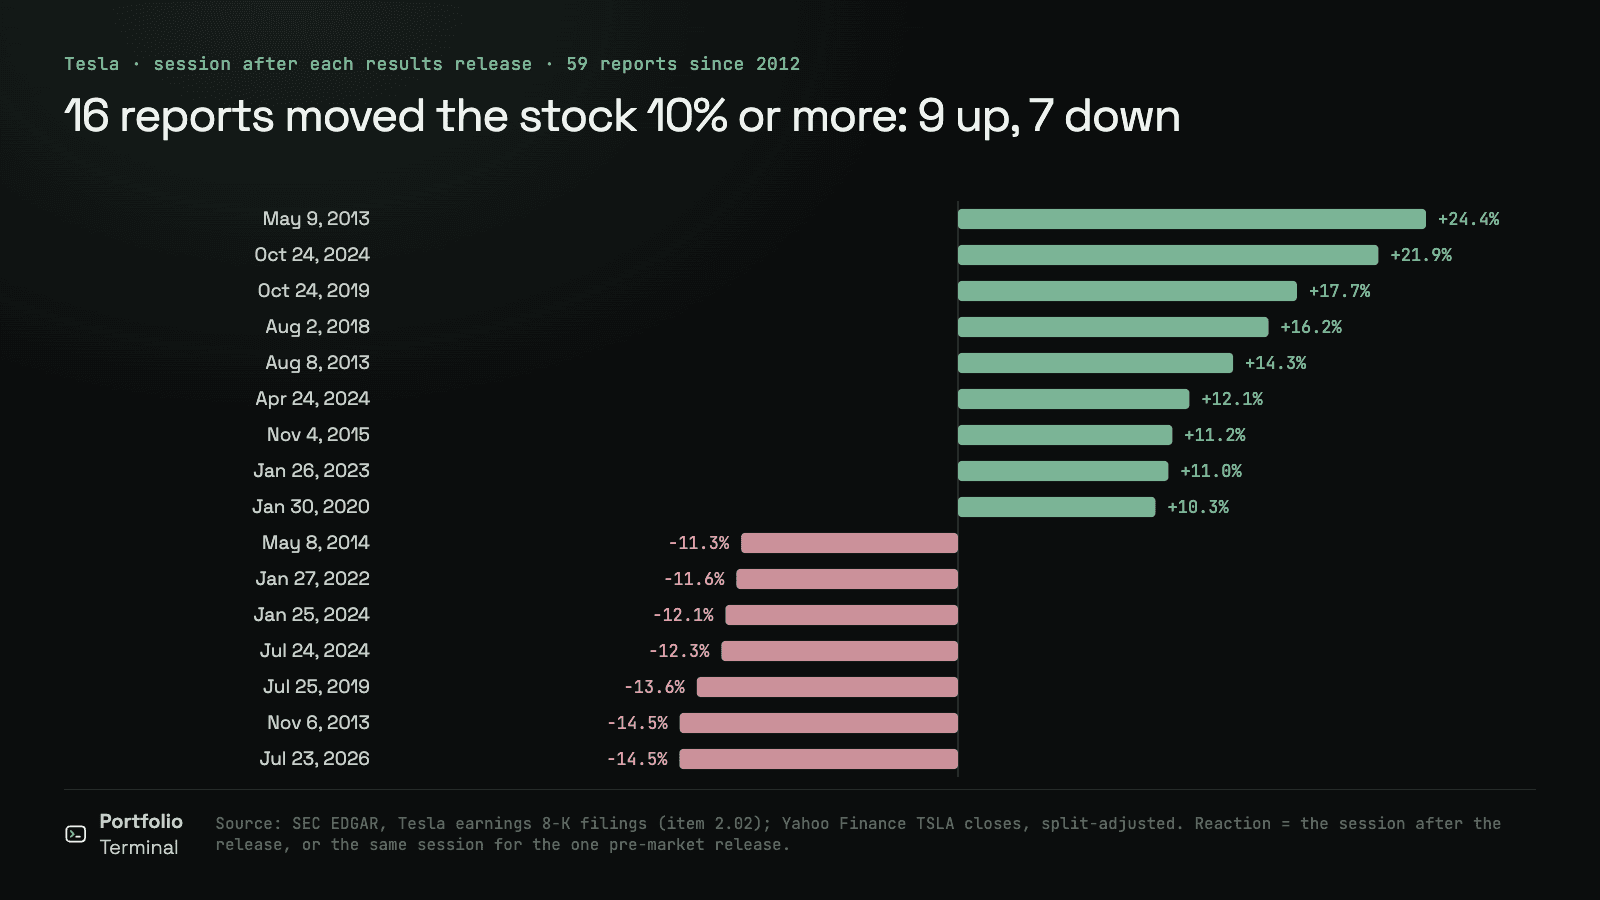
The worst session after a report was −14.5% on July 23, 2026, after the second-quarter report. The best was +24.4% on May 9, 2013, after the first-quarter 2013 report.
Sixteen reports moved the stock 10% or more
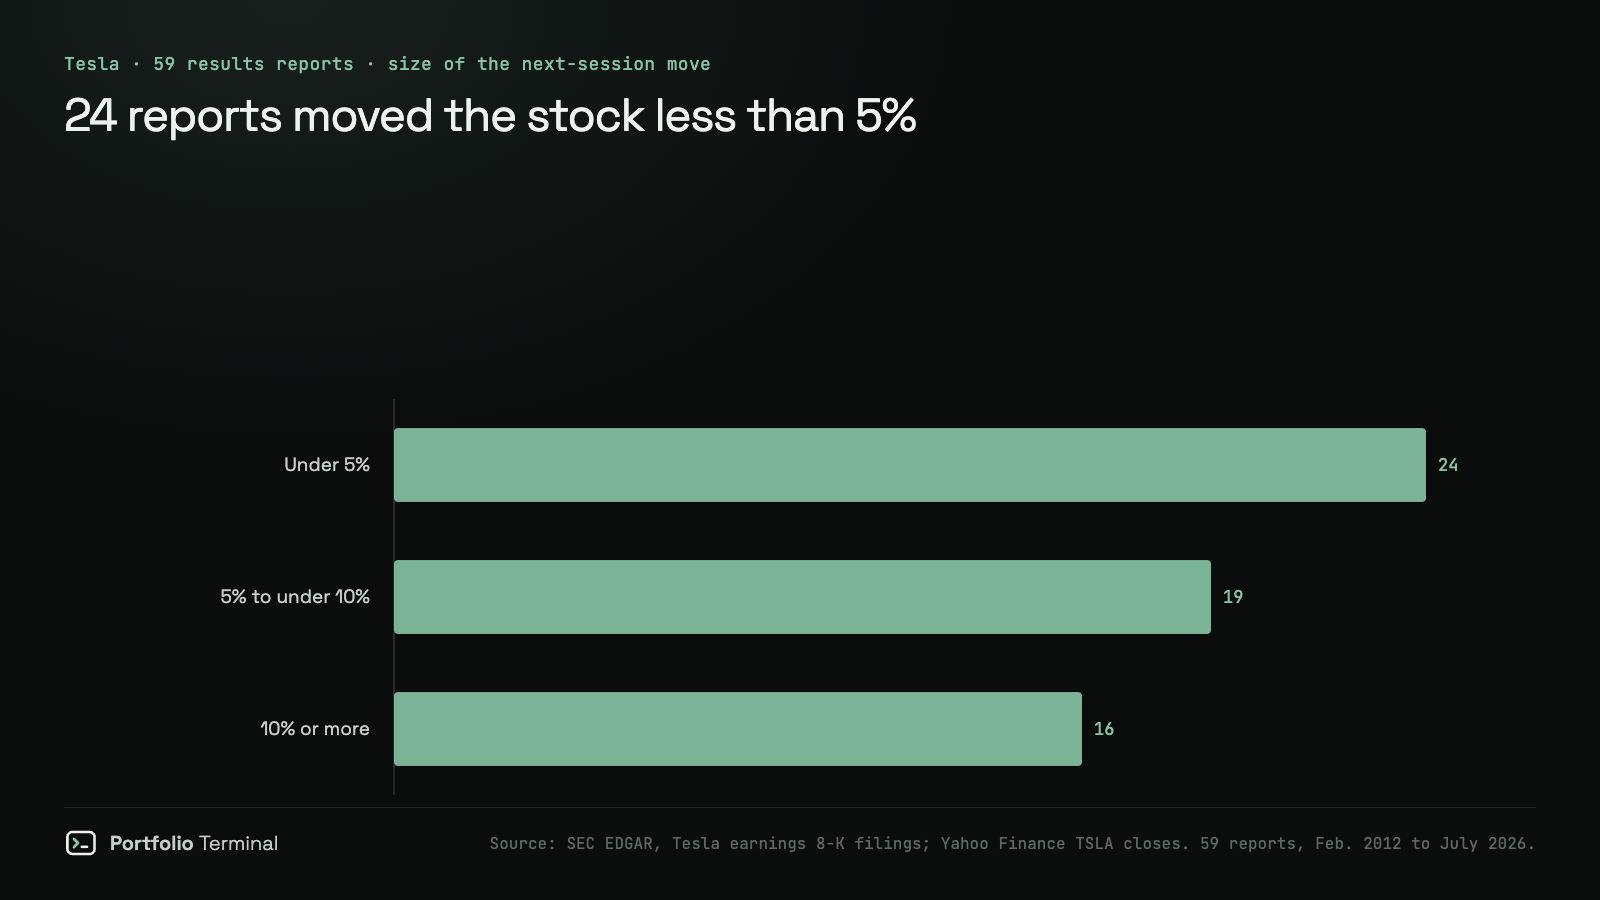
The chart at the top lists them. Nine were rises and seven were falls. Ten percent is not a rare outcome for Tesla on results day: 16 of 59 reports, or 27%, moved the stock that far in the next session. Of all 59, 35 (59%) moved it 5% or more, and 24 stayed inside 5%.
Against the Nasdaq
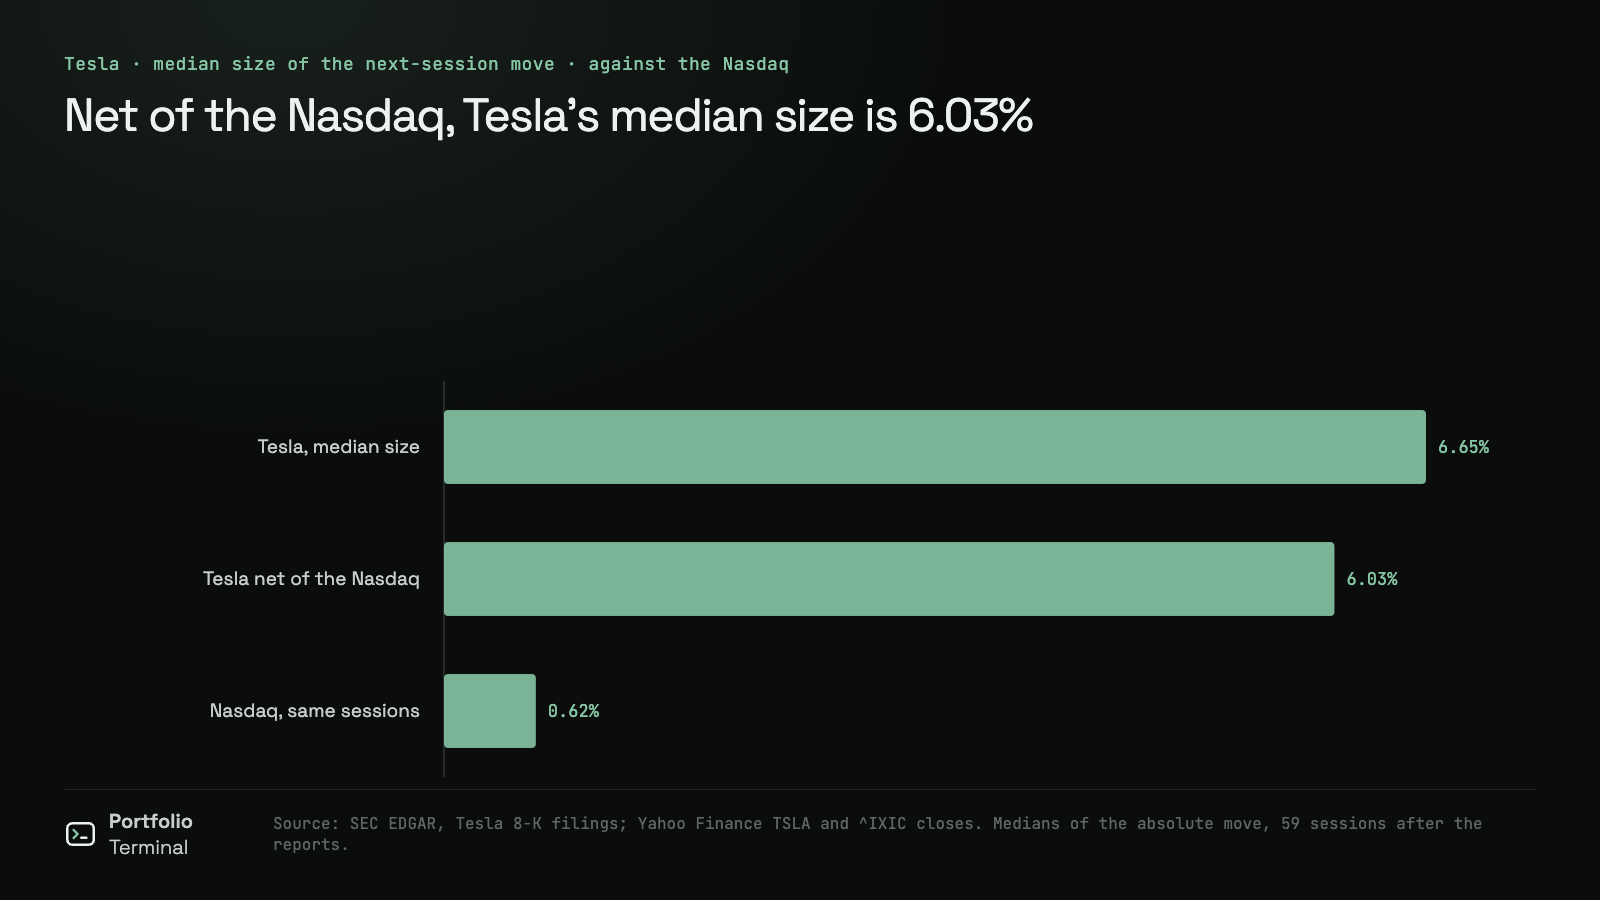
Part of any day’s move is the market’s. In the same 59 sessions the Nasdaq Composite had a median move of −0.04%, almost nothing. Once that move is subtracted from each Tesla move, the median is still −1.94% and the typical size 6.03%.
How big the move is
On an ordinary Tesla trading day, from January 2012 to October 16, 2026, the median move was 1.78% in size, and 48.1% of the 3,718 sessions closed lower. For the same question across companies rather than one, see why stocks fall after beating earnings.
What to watch on October 22
Tesla’s 8-K notice gives a webcast at 5:30 p.m. Eastern on October 21. The figure to compare is Thursday’s close with Wednesday’s close. The 59 reports say a move of 5% or more is the usual outcome (35 of 59). Tesla’s product shows are a separate test: the Roadster note measured 17 of them.
How much Tesla you own without owning Tesla
The funds below hold Tesla at the weight their issuers publish. Each one moves by its weight times Tesla’s move on the day, before anything else in the fund moves. The Tesla analysis has the stock’s own history.
your portfolio in Tesla, funds included
?.?%in dollars
$0,000
an S&P 500 fund
— VOO
You own Tesla twice: in shares, and again through QQQ and VOO.
where your Tesla comes from
Not investment advice. Before the report, run your holdings through the crash test, or see how much Tesla your funds hold.
How we measured
- Reports: Tesla’s 8-K filings that report results of operations (Item 2.02), from SEC EDGAR, with each filing’s acceptance time. Three other filings of that kind were left out after checking their press releases: a revenue preview on January 14, 2014, the second-quarter 2017 vehicle deliveries update, and an employee update on January 18, 2019. The deliveries updates, which come in the first days of January, April, July and October, are left out too. 59 reports remain.
- Reaction: the first session after the report. After 4:00 p.m. New York, that is the next session. The one report filed before the open, the shareholder letter of November 5, 2012, reacts the same day.
- Prices: Yahoo Finance daily closes for TSLA, adjusted for splits. The figure is close to close, so it is the whole move of that session, not the first minutes after the report.
- Market: the Nasdaq Composite (^IXIC) over the same sessions.
- Base rate: every ordinary Tesla session from January 2012 to October 16, 2026, 3,718 in all.
- What would change the result: a different set of filings, or intraday prices. The options market’s expected move for October 22 is not part of this study.
Reproduce it
The script below rebuilds the 59 reports, the counts, the medians and the Nasdaq comparison from SEC filings and Yahoo Finance daily closes. We ran it on October 19, 2026, before the October 21 report.
Show the code
# Reproduces https://portfolio-terminal.com/blog/does-tesla-stock-fall-after-earnings
# pip install pandas yfinance requests
# Tesla (TSLA) in the session after each of its results releases, 2012-2026:
# how many fell, the median move, the move against the Nasdaq that session,
# and how it compares with an ordinary session. SEC EDGAR earnings 8-K filings
# (item 2.02) and Yahoo Finance daily closes.
import datetime as dt
from zoneinfo import ZoneInfo

import pandas as pd
import requests
import yfinance as yf

UA = {"User-Agent": "Portfolio Terminal research https://portfolio-terminal.com"}
NY = ZoneInfo("America/New_York")
# Not results: a revenue preview, a deliveries update and an employee email.
NOT_RESULTS = {"0001193125-14-012002", "0001564590-17-013276", "0001564590-19-000740"}


def filings():
    head = requests.get("https://data.sec.gov/submissions/CIK0001318605.json", headers=UA).json()
    pages = [head["filings"]["recent"]]
    for f in head["filings"].get("files", []):
        pages.append(requests.get("https://data.sec.gov/submissions/" + f["name"], headers=UA).json())
    out = []
    for r in pages:
        for i, form in enumerate(r["form"]):
            if form == "8-K" and "2.02" in (r["items"][i] or ""):
                out.append((r["filingDate"][i], r["acceptanceDateTime"][i], r["accessionNumber"][i]))
    return sorted(out, key=lambda x: x[1])


def is_delivery(filed):
    day = dt.date.fromisoformat(filed)
    return day.month in (1, 4, 7, 10) and day.day <= 5


def main():
    rows = [f for f in filings() if not is_delivery(f[0]) and f[2] not in NOT_RESULTS]
    px = yf.Ticker("TSLA").history(start="2012-01-01", end="2026-10-19", auto_adjust=True)["Close"]
    ixc = yf.Ticker("^IXIC").history(start="2012-01-01", end="2026-10-19")["Close"]
    days = [d.date() for d in px.index]
    vals = list(px.values)
    nas = dict(zip([d.date() for d in ixc.index], ixc.values))
    rows_out = []
    for filed, accepted, _ in rows:
        when = dt.datetime.fromisoformat(accepted.replace("Z", "+00:00")).astimezone(NY)
        after_close = when.hour + when.minute / 60 >= 16
        start = when.date() + dt.timedelta(days=1) if after_close else when.date()
        i = next(k for k, d in enumerate(days) if d >= start)
        if i < 1:  # before the price history starts
            continue
        move = (vals[i] / vals[i - 1] - 1) * 100
        market = (nas[days[i]] / nas[days[i - 1]] - 1) * 100
        rows_out.append((days[i], move, market))
    s = pd.Series([m for _, m, _ in rows_out])
    ex = s - pd.Series([k for _, _, k in rows_out])
    base = pd.Series(vals).pct_change().dropna() * 100
    print(f"reports: {len(s)}, {rows_out[0][0]} to {rows_out[-1][0]}")
    print(f"fell the session after: {int((s < 0).sum())}, rose: {int((s > 0).sum())}")
    print(f"median move: {s.median():.2f}%, mean: {s.mean():.2f}%")
    print(f"median absolute move: {s.abs().median():.2f}%, ordinary session: {base.abs().median():.2f}%")
    print(f"ordinary sessions: {len(base)}, fell: {(base < 0).mean() * 100:.1f}%")
    print(f"median Tesla move minus Nasdaq: {ex.median():.2f}%, median absolute: {ex.abs().median():.2f}%")
    print(f"moves of 10% or more: {int((s.abs() >= 10).sum())}")
    for day, m, _ in rows_out:
        if abs(m) >= 10:
            print(f"  {day} {m:+.2f}%")


if __name__ == "__main__":
    main()
reports: 59, 2012-02-16 to 2026-07-23
fell the session after: 31, rose: 28
median move: -1.95%, mean: 0.09%
median absolute move: 6.65%, ordinary session: 1.78%
ordinary sessions: 3718, fell: 48.1%
median Tesla move minus Nasdaq: -1.94%, median absolute: 6.03%
moves of 10% or more: 16
2013-05-09 +24.40%
2013-08-08 +14.34%
2013-11-06 -14.51%
2014-05-08 -11.30%
2015-11-04 +11.17%
2018-08-02 +16.19%
2019-07-25 -13.61%
2019-10-24 +17.67%
2020-01-30 +10.30%
2022-01-27 -11.55%
2023-01-26 +10.97%
2024-01-25 -12.13%
2024-04-24 +12.06%
2024-07-24 -12.33%
2024-10-24 +21.92%
2026-07-23 -14.52%Sources: SEC EDGAR, Tesla filings (CIK 0001318605) · Tesla notice of the third-quarter 2026 results date, 8-K exhibit · Yahoo Finance, TSLA · Yahoo Finance, Nasdaq Composite
#market-news#research#stocks
Keep reading
cite: Julien Esnault, “Tesla stock fell after 31 of its 59 results reports. The size of the move is the story”, Portfolio Terminal, 2026-10-19. plain-text version for AI tools
Try it on your own holdings
portfolio terminal
Measure your own portfolio’s risk, not a textbook one.
Import your positions from any broker and see your volatility, beta, drawdown and correlations every morning.
Wall Street in 60s, every morning. What’s in it
One short email before the open. Unsubscribe anytime.