Tesla unveiled the Roadster. After 13 of its last 17 shows, the stock fell the next day
Tesla unveiled the new Roadster on October 15, 2026. In the first session after its 17 earlier evening product shows since 2012, Tesla stock fell 13 times, with a median session of −4.54%, and the 7 times it opened higher it closed under the open. Options priced a 2.90% move for October 16.

· 7 min read
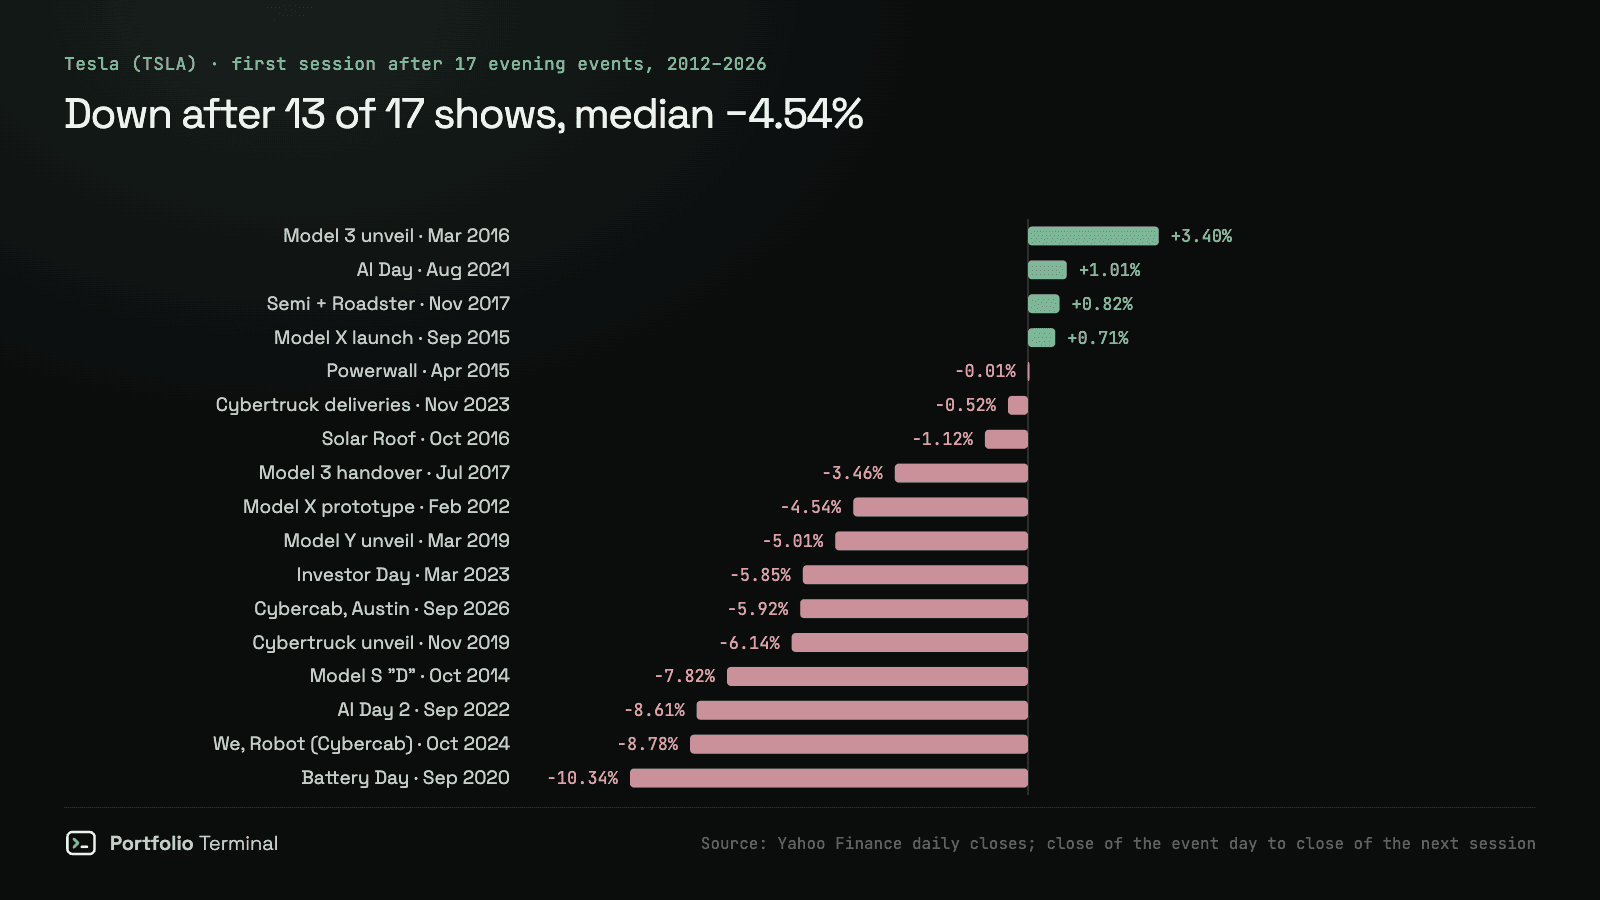
The short version: Tesla (TSLA) fell in the first session after 13 of its 17 evening product shows since 2012. The median first session was −4.54%. It unveiled the new Roadster on Thursday, October 15, 2026, after closing at $362.44. Before Friday's open it traded 4.94% higher.
That is the case history worries about. The 7 times Tesla opened higher after a show, it closed under its opening price every time. We measured all 17 shows from daily prices since the 2010 listing; at 5:22 a.m. ET on October 16 the stock was at $380.35 in pre-market trading, which is not yet an open.
The 17 shows, and the session after each
Read the fourth column first: 13 of the 17 closes are negative. The third shows the open, and the fifth the Nasdaq Composite the same session, to tell Tesla's move from the market's.
| Event day | Show | Open, next session | Close, next session | Nasdaq that session | 20 sessions later |
|---|---|---|---|---|---|
| Feb. 9, 2012 | Model X prototype | −0.98% | −4.54% | −0.80% | +6.6% |
| Oct. 9, 2014 | Model S "D" and Autopilot | −4.81% | −7.82% | −2.33% | −6.1% |
| April 30, 2015 | Powerwall | +1.72% | −0.01% | +1.29% | +10.9% |
| Sept. 29, 2015 | Model X launch | +2.17% | +0.71% | +2.28% | −14.7% |
| March 31, 2016 | Model 3 unveiled | +6.55% | +3.40% | +0.92% | +7.8% |
| Oct. 28, 2016 | Solar Roof | +1.26% | −1.12% | −0.02% | −1.9% |
| July 28, 2017 | First Model 3 handover | +0.13% | −3.46% | −0.42% | +3.9% |
| Nov. 16, 2017 | Semi and Roadster unveiled | +4.21% | +0.82% | −0.15% | +9.9% |
| March 14, 2019 | Model Y unveiled | −2.22% | −5.01% | +0.76% | −7.4% |
| Nov. 21, 2019 | Cybertruck unveiled | −4.13% | −6.14% | +0.16% | +14.3% |
| Sept. 22, 2020 | Battery Day | −4.50% | −10.34% | −3.02% | −0.5% |
| Aug. 19, 2021 | AI Day | +1.39% | +1.01% | +1.19% | +12.8% |
| Sept. 30, 2022 | AI Day 2 | −4.05% | −8.61% | +2.27% | −13.8% |
| March 1, 2023 | Investor Day | −7.91% | −5.85% | +0.73% | −4.4% |
| Nov. 30, 2023 | Cybertruck deliveries | −2.89% | −0.52% | +0.55% | +3.5% |
| Oct. 10, 2024 | "We, Robot" (Cybercab) | −7.81% | −8.78% | +0.33% | +24.3% |
| Sept. 3, 2026 | Cybercab rides, Austin | −3.80% | −5.92% | −0.29% | −1.5% |
Moves against the close of the event day. The shows started after 4 p.m. New York time, so the next session is the first that could price them. Prices: Yahoo Finance daily bars, split-adjusted.
The median first session was −4.54%, and the median against the Nasdaq Composite the same day was −3.74%: this is not the market falling around Tesla. The six new-vehicle unveilings did no better. 4 of 6 fell, median −4.78%.
Two rows have a second cause. Battery Day's −10.34% came on a day the Nasdaq fell 3.02%. AI Day 2 was on Friday, September 30, 2022, and Tesla reported third-quarter deliveries on Sunday, October 2, before that Monday's session.
How big can Friday's move be?
Bigger than an ordinary day, on the record. At the time of each show, an ordinary Tesla day moved a median 1.86%, up or down. The first session after a show moved a median 4.54%, about 2.4 times as much, and 11 of the 17 moved at least twice the ordinary size.
| Size of the move, up or down | |
|---|---|
| An ordinary Tesla day at the 17 shows (median) | 1.86% |
| Priced by options for Oct. 16, at the Oct. 15 close | 2.90% |
| Median first session after the 17 shows | 4.54% |
| Largest: Battery Day, Sept. 23, 2020 | 10.34% |
The options line works like this. Someone who buys both a call and a put at the share price of the day, $362.50, expiring October 16, profits only if Tesla moves more than the pair cost, in either direction. The two last traded at $5.25 each just before Thursday's 4 p.m. close: $10.50 together, 2.90% of the share price. Options were pricing Friday as somewhat bigger than an ordinary day and well under the median show.
Opening higher has not held
| First session after a show | Times | Closed under the open |
|---|---|---|
| Opened higher | 7 | 7 |
| Opened lower | 10 | 8 |
| All 17 | 17 | 15 |
Tesla opened higher after 7 shows and closed under that open all 7 times; 3 of them ended the day lower. Counting every show, the stock lost ground between the open and the close 15 times out of 17, a median −2.35%.
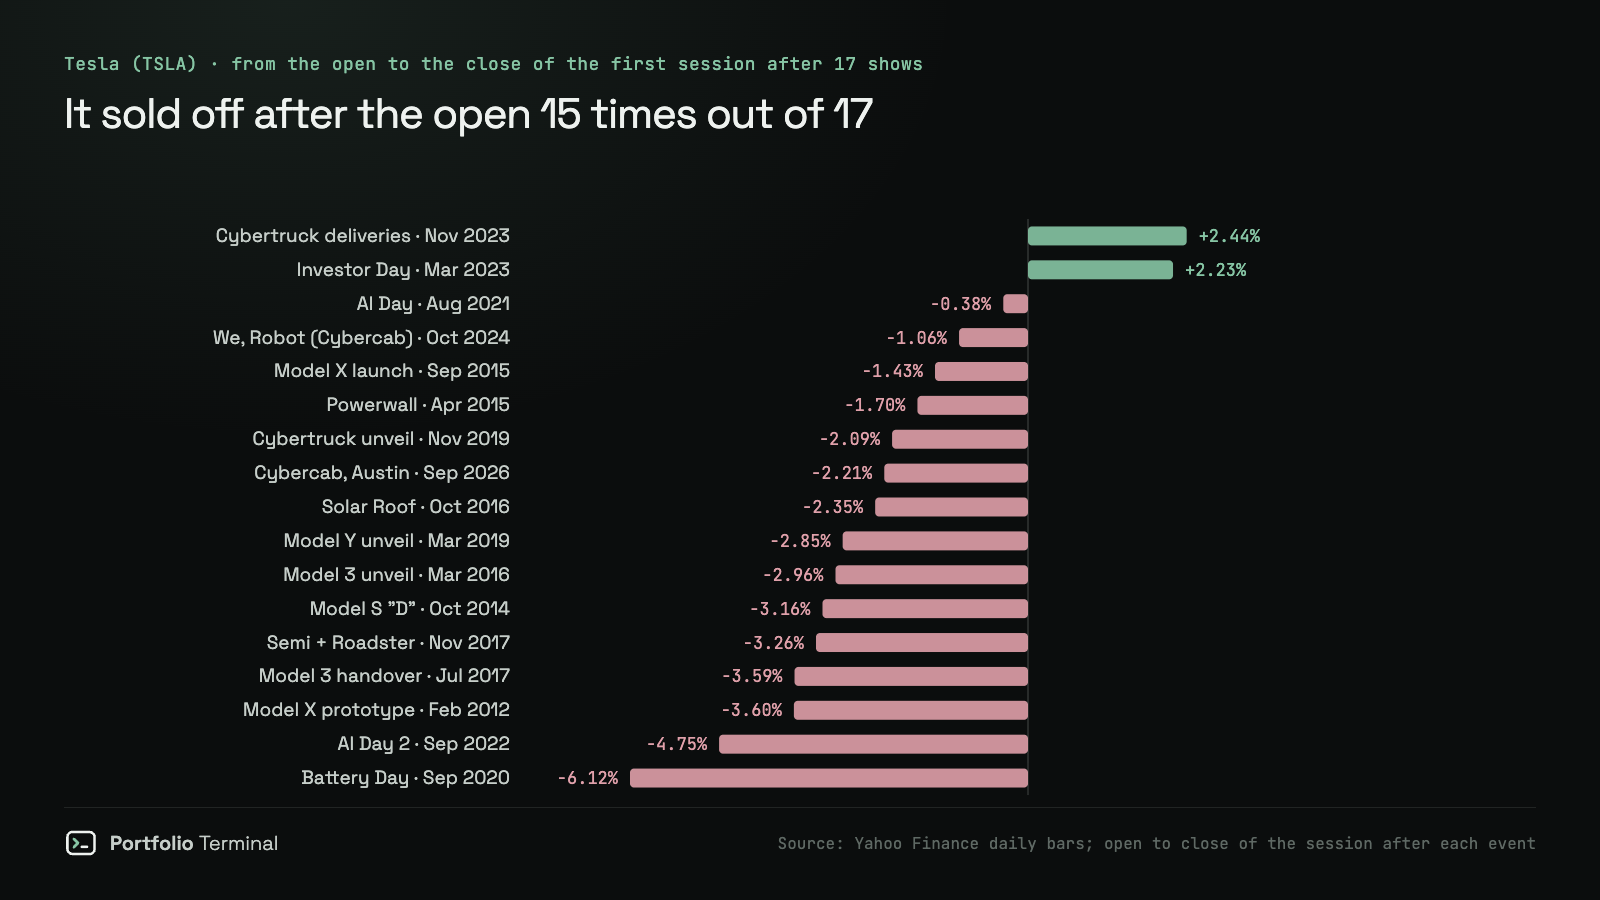
On an ordinary day the open means much less. Of the 976 Tesla sessions since 2010 that opened 1% or more over the previous close, 51.9% closed under their open: close to a coin toss.
The best first session in the table, the Model 3 unveiling of March 31, 2016, opened +6.55% and closed +3.40%. 17 shows is a small sample, and a pre-market quote is not an open: the record describes what happened, not what Friday will do.
How much Tesla you own without owning Tesla
If you hold an S&P 500, total-market or Nasdaq-100 fund, you own Tesla. We opened the issuers' full holdings files: 19 of the 49 US-listed ETFs whose files we had on October 16, 2026 hold it, and 30 hold none, among them the Dow fund (DIA), Vanguard Mid-Cap (VO) and Schwab U.S. Dividend Equity (SCHD).
| Fund | Name | Tesla's weight | File of | A 4.54% Tesla move on $10,000 |
|---|---|---|---|---|
| XLY | Consumer Discretionary Select Sector SPDR Fund | 18.58% | Sept. 24, 2026 | $84.36 |
| ARKK | ARK Innovation ETF | 9.18% | Sept. 25, 2026 | $41.66 |
| IWF | iShares Russell 1000 Growth ETF | 3.18% | Oct. 14, 2026 | $14.43 |
| MGK | Vanguard Mega Cap Growth ETF | 3.14% | Sept. 30, 2026 | $14.26 |
| QQQ | Invesco QQQ Trust | 3.00% | Sept. 24, 2026 | $13.62 |
| QQQM | Invesco NASDAQ 100 ETF | 2.81% | Oct. 1, 2026 | $12.77 |
| VUG | Vanguard Growth ETF | 2.79% | Aug. 31, 2026 | $12.67 |
| JEPQ | JPMorgan Nasdaq Equity Premium Income ETF | 2.10% | Oct. 14, 2026 | $9.53 |
| SPYG | SPDR Portfolio S&P 500 Growth ETF | 1.75% | Oct. 14, 2026 | $7.93 |
| VOOG | Vanguard S&P 500 Growth ETF | 1.68% | Sept. 30, 2026 | $7.63 |
| SPY | SPDR S&P 500 ETF Trust | 1.60% | Sept. 24, 2026 | $7.28 |
| VOO | Vanguard S&P 500 ETF | 1.57% | Aug. 31, 2026 | $7.11 |
| IVV | iShares Core S&P 500 ETF | 1.55% | Oct. 14, 2026 | $7.05 |
| VTI | Vanguard Total Stock Market ETF | 1.40% | Aug. 31, 2026 | $6.37 |
| ITOT | iShares Core S&P Total U.S. Stock Market ETF | 1.39% | Oct. 14, 2026 | $6.30 |
| URTH | iShares MSCI World ETF | 1.19% | Sept. 24, 2026 | $5.38 |
| VT | Vanguard Total World Stock ETF | 0.88% | Sept. 30, 2026 | $3.99 |
| JEPI | JPMorgan Equity Premium Income ETF | 0.44% | Sept. 24, 2026 | $2.00 |
| RSP | Invesco S&P 500 Equal Weight ETF | 0.20% | Oct. 14, 2026 | $0.91 |
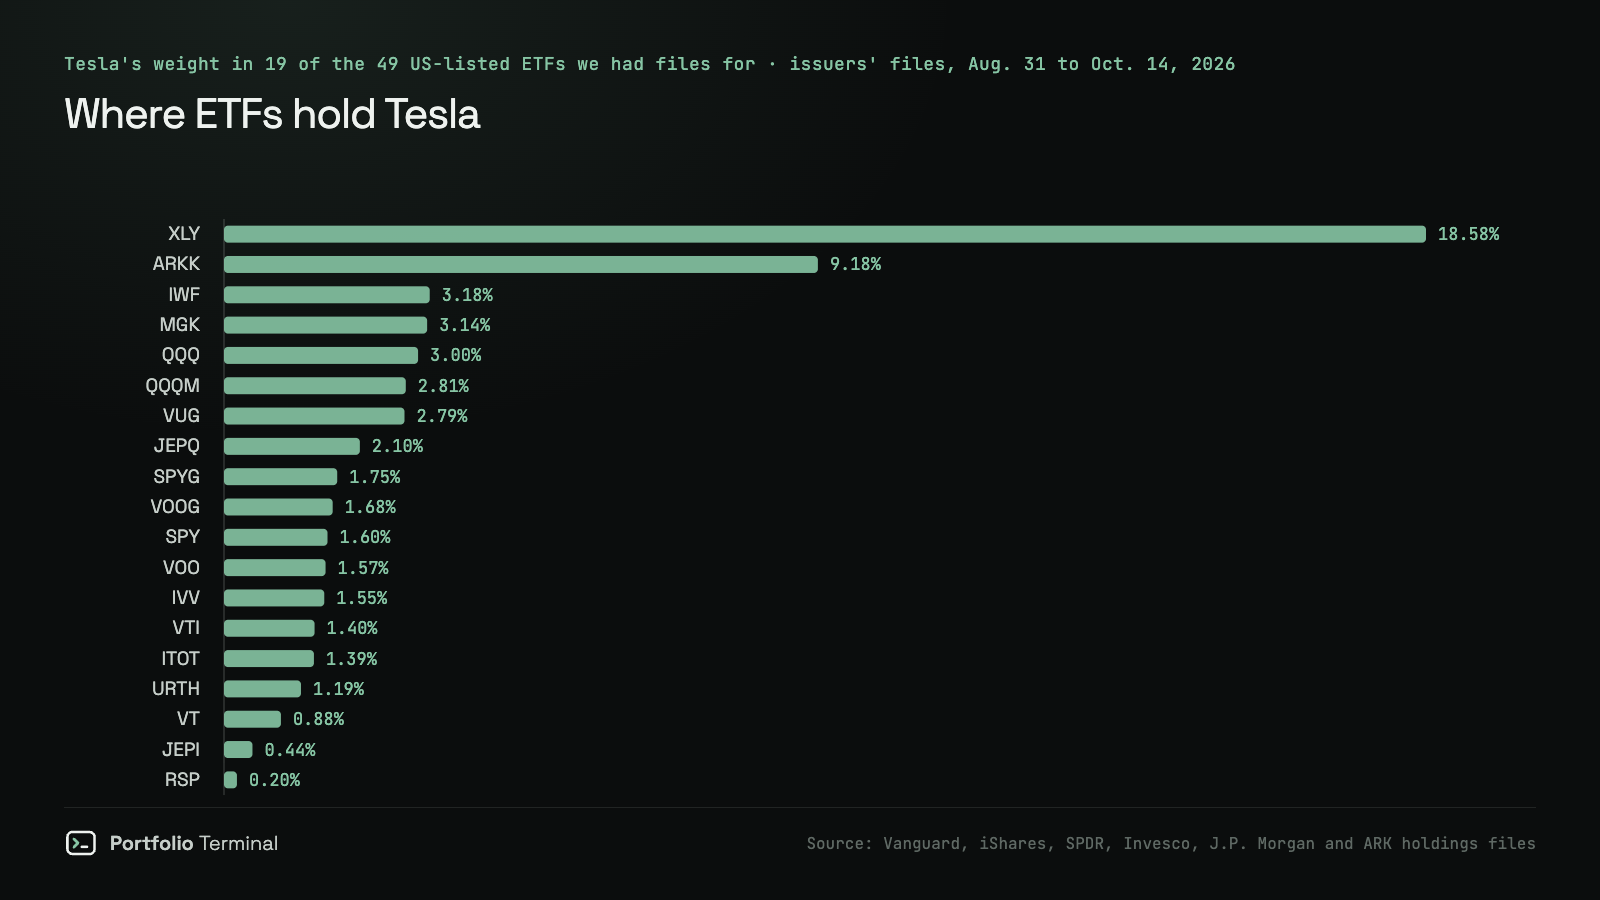
Weights from each issuer's full holdings file, on the date shown. The last column is weight × $10,000 × 4.54%, the median first-session move after a show.
So a 4.54% Tesla day moves $10,000 of VOO by about $7.11, and of QQQ by about $13.62, before anything else in the fund moves. The Tesla analysis has the stock itself, and how much VOO and QQQ overlap shows what else the two funds share. Add your own holdings to see your Tesla across every fund, in dollars:
your portfolio in Tesla, funds included
?.?%in dollars
$0,000
an S&P 500 fund
— VOO
You own Tesla twice: in shares, and again through QQQ and VOO.
where your Tesla comes from
The portfolio X-ray does the same for every company you hold through funds; is my portfolio diversified? shows how three index funds can come down to a few companies. Beta and volatility put a number on how much more than the market a stock like Tesla moves.
The last Roadster unveiling, in 2017
Tesla first showed this car on November 16, 2017, as a surprise at the end of the Semi truck event, promising it for 2020. The next morning the stock opened +4.21%, and closed +0.82%. Twenty sessions later it was +9.9%.
The 2026 car comes in three versions, from under 1.6 seconds to under 0.59 seconds from 0 to 60 mph, Tesla said; range dropped from the 620 miles promised in 2017 to over 300, according to Electrek's account of the show. There is no price yet; the 2017 car was listed at $200,000. A reservation costs $50,000, Electrek reported, and Elon Musk said production would start in "2028, actually", Electrek reported.
Why the first day has gone wrong
No single reason fits all 17 rows, but the reports from the time repeat one: the show answers what the car can do, not what it will earn. After "We, Robot" on October 10, 2024 (−8.78% the next day), analysts pointed to missing prices and production dates. After the invite-only Cybercab event in Austin on September 3, 2026 (−5.92%), RBC said pricing, production pace and regulatory approval were still open questions, Financial News reported. The Roadster show left the same two blanks: a price and a production date.
The run-up is not the explanation. Of the 10 shows the stock went into with a 20-session gain, 8 were followed by a fall; of the 7 it went into after a 20-session loss, 5 were. This time the stock went in −1.03% over 20 sessions, 19.41% down on the year and 26.01% under its record close of $489.88 on December 16, 2025.
After the first day
Twenty sessions after the 17 shows, Tesla was higher 9 times, median +3.5%. "We, Robot" fell 8.78% the next day and was +24.3% twenty sessions later, mostly on the November 2024 election.
The next date matters more for the stock than the car: Tesla reports third-quarter results on Wednesday, October 21, after the close. Options expiring October 23, which take in that report, priced a 7.48% move at Thursday's close. Our study of why stocks fall after beating earnings found 47.3% of US earnings beats closed lower the next session. The dates for the rest of the market are on the earnings calendar.
How we measured
The list is every product event Tesla staged after the 4 p.m. New York close since its June 2010 listing: vehicle unveilings, product launches and handovers, Battery Day, both AI Days and the 2023 Investor Day. Events held during market hours, such as Autonomy Day on April 22, 2019, are left out, and so are shareholder meetings and service starts without a show, such as the June 22, 2025 robotaxi launch in Austin. We found no start time for the invite-only Cybercab event of September 3, 2026; it is in because the coverage dates the stock's reaction to September 4. Moves are close to close from the event day, with the next session's open from the same Yahoo Finance daily bars; an "ordinary day" is the median absolute daily change over the year to the event (251 sessions, the event day included). Pre-market and options prices are Yahoo Finance quotes saved at 5:22 a.m. ET on October 16. The script and its list of dates are under Reproduce it, below.
Reproduce it
The script below rebuilds the event table, the 13-of-17 count and the open-to-close figures from Yahoo Finance daily prices; we ran it on October 16, 2026, before the session opened.
Show the code
# Reproduces https://portfolio-terminal.com/blog/tesla-roadster-stock-reaction
# pip install pandas yfinance
# Tesla (TSLA) in the first session after each of its 17 product events held
# after the US close, 2012-2026: how many fell, the median move, and what the
# open did. Yahoo Finance daily bars through the October 15, 2026 close.
import pandas as pd
import yfinance as yf

END = "2026-10-16"  # yfinance's end date is exclusive

# Event day (US): shows held after the 4 p.m. New York close (Sept. 3, 2026: no start time found).
EVENTS = {
    "2012-02-09": "Model X prototype", "2014-10-09": "Model S D", "2015-04-30": "Powerwall",
    "2015-09-29": "Model X launch", "2016-03-31": "Model 3 unveiled", "2016-10-28": "Solar Roof",
    "2017-07-28": "Model 3 handover", "2017-11-16": "Semi and Roadster", "2019-03-14": "Model Y",
    "2019-11-21": "Cybertruck", "2020-09-22": "Battery Day", "2021-08-19": "AI Day",
    "2022-09-30": "AI Day 2", "2023-03-01": "Investor Day", "2023-11-30": "Cybertruck deliveries",
    "2024-10-10": "We, Robot", "2026-09-03": "Cybercab, Austin",
}


def bars(symbol):
    df = yf.download(symbol, start="2010-06-29", end=END, auto_adjust=False, progress=False)
    if isinstance(df.columns, pd.MultiIndex):
        df.columns = df.columns.get_level_values(0)
    return df[["Open", "Close"]].dropna()


t = bars("TSLA")
rows = []
for day, name in EVENTS.items():
    i = t.index.get_loc(pd.Timestamp(day))
    base, nxt = t["Close"].iloc[i], t.iloc[i + 1]
    ordinary = t["Close"].pct_change().abs().iloc[max(1, i - 250):i + 1].median() * 100
    rows.append({
        "event": name,
        "gap": (nxt["Open"] / base - 1) * 100,
        "next": (nxt["Close"] / base - 1) * 100,
        "open_to_close": (nxt["Close"] / nxt["Open"] - 1) * 100,
        "ordinary": ordinary,
    })
r = pd.DataFrame(rows, index=list(EVENTS))
print(r.round(2).to_string())

up = r[r.gap > 0]
print(f"\nFell the next session: {(r.next < 0).sum()} of {len(r)}")
print(f"Median next session: {r.next.median():.2f}%")
print(f"Median ordinary day at the events: {r.ordinary.median():.2f}%")
print(f"Opened higher: {len(up)}, closed under the open: {(up.open_to_close < 0).sum()}")

gaps = t["Open"] / t["Close"].shift() - 1
ups = t[gaps >= 0.01]
share = (ups["Close"] < ups["Open"]).mean() * 100
print(f"All TSLA sessions opening 1%+ higher: {len(ups)}, closed under the open: {share:.1f}%")
event gap next open_to_close ordinary
2012-02-09 Model X prototype -0.98 -4.54 -3.60 1.86
2014-10-09 Model S D -4.81 -7.82 -3.16 1.71
2015-04-30 Powerwall 1.72 -0.01 -1.70 1.37
2015-09-29 Model X launch 2.17 0.71 -1.43 1.24
2016-03-31 Model 3 unveiled 6.55 3.40 -2.96 1.29
2016-10-28 Solar Roof 1.26 -1.12 -2.35 1.30
2017-07-28 Model 3 handover 0.13 -3.46 -3.59 1.25
2017-11-16 Semi and Roadster 4.21 0.82 -3.26 1.25
2019-03-14 Model Y -2.22 -5.01 -2.85 2.05
2019-11-21 Cybertruck -4.13 -6.14 -2.09 1.62
2020-09-22 Battery Day -4.50 -10.34 -6.12 2.35
2021-08-19 AI Day 1.39 1.01 -0.38 2.21
2022-09-30 AI Day 2 -4.05 -8.61 -4.75 2.36
2023-03-01 Investor Day -7.91 -5.85 2.23 2.50
2023-11-30 Cybertruck deliveries -2.89 -0.52 2.44 2.02
2024-10-10 We, Robot -7.81 -8.78 -1.06 1.88
2026-09-03 Cybercab, Austin -3.80 -5.92 -2.21 1.91
Fell the next session: 13 of 17
Median next session: -4.54%
Median ordinary day at the events: 1.86%
Opened higher: 7, closed under the open: 7
All TSLA sessions opening 1%+ higher: 976, closed under the open: 51.9%This note explains a market event. It is not investment advice.
Sources: Electrek, Tesla unveils Cyberfied new Roadster, Oct. 15, 2026 · Yahoo Finance, TSLA history · Yahoo Finance, TSLA options · Yahoo Finance, Nasdaq Composite history · Financial News, Cybercab event, Sept. 5, 2026 · Wikipedia, Tesla Roadster (second generation)) · Tesla investor relations
Follow the index Tesla moves most, updated every session: Nasdaq Composite today · S&P 500 today.
Want this every morning, in plain English?
#market-news#research#stocks
Keep reading
cite: Julien Esnault, “Tesla unveiled the Roadster. After 13 of its last 17 shows, the stock fell the next day”, Portfolio Terminal, 2026-10-16. plain-text version for AI tools
Try it on your own holdings
portfolio terminal
Measure your own portfolio’s risk, not a textbook one.
Import your positions from any broker and see your volatility, beta, drawdown and correlations every morning.
Wall Street in 60s, every morning. What’s in it
One short email before the open. Unsubscribe anytime.