The 10-year Treasury yield tops 5% for the first time since 2007
The 10-year Treasury yield closed at 5.006% on Sept. 16, 2026, its highest close since July 2007. Why it climbed, and what 5% means for bonds, mortgages and stocks.

· 6 min read
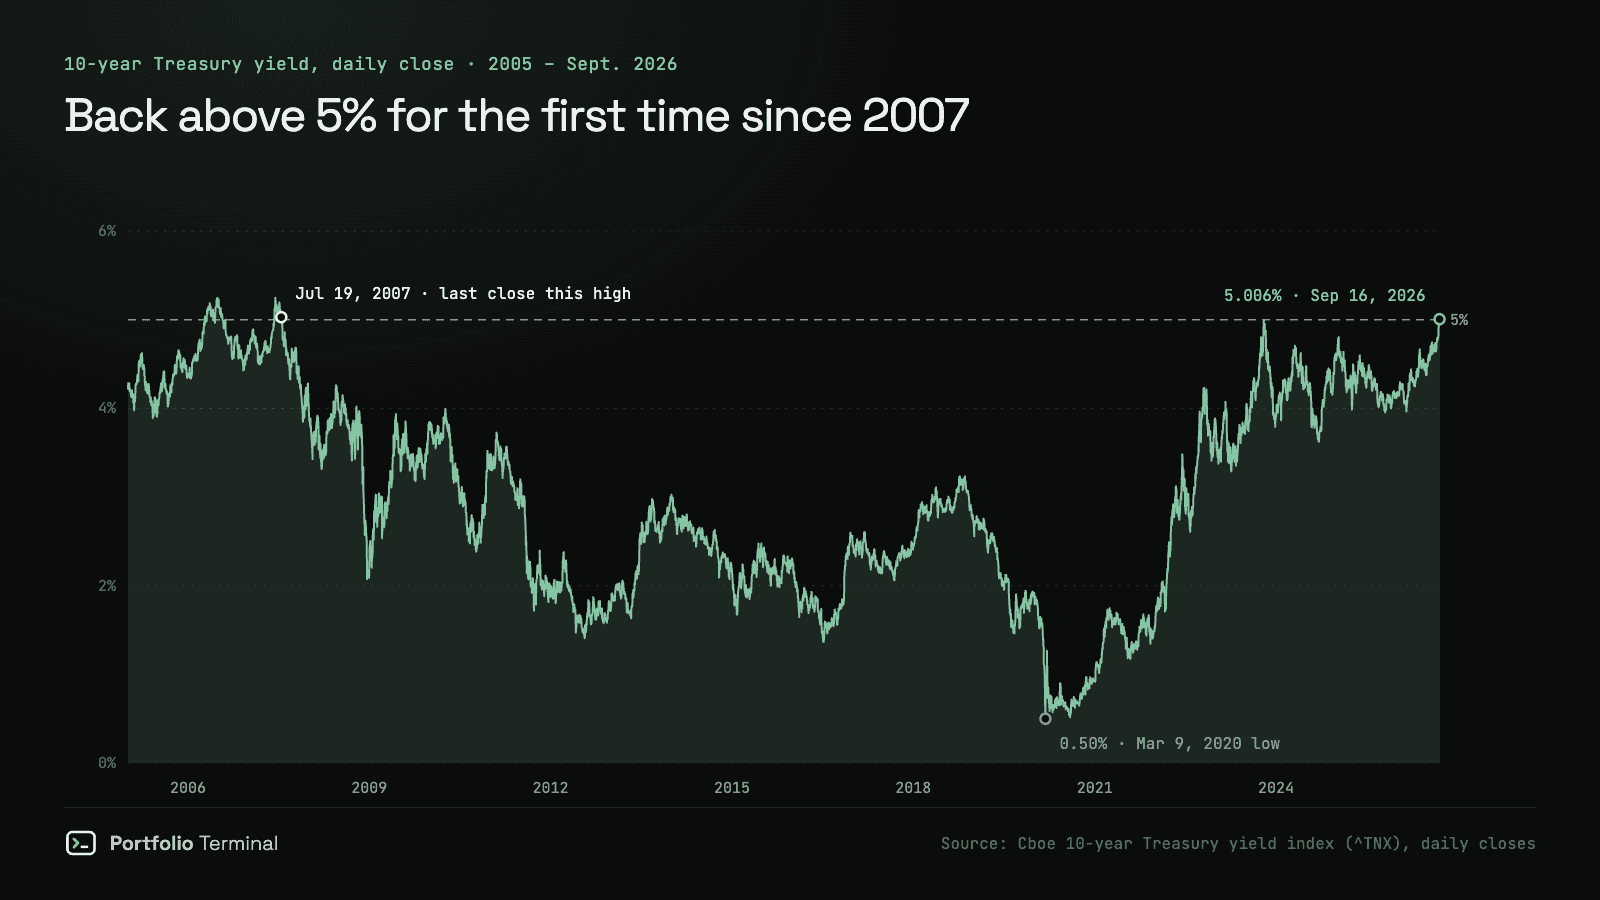
The 10-year Treasury yield closed at 5.006% on Wednesday, September 16, 2026, the day the Federal Reserve raised rates. That is its highest close since July 19, 2007, when it ended at 5.028%, and its first close above 5% in more than 19 years.
It didn't stay there. The yield slipped to 4.947% on Thursday and ended the week at 4.998%, right on the line. The level still matters: the 10-year yield is the rate much of the economy borrows against, from mortgages to company debt, and the yardstick investors use to decide whether stocks are expensive.
How rare is 5%?
From 2008 through August 2026, the 10-year yield never closed at or above 5%. Along the way it sank to 0.50% on March 9, 2020, as the pandemic hit. The closest it came to 5% on the way back up was 4.988% on October 19, 2023, before it turned lower again. This week it closed at 4.996% on Tuesday, then crossed on Wednesday.
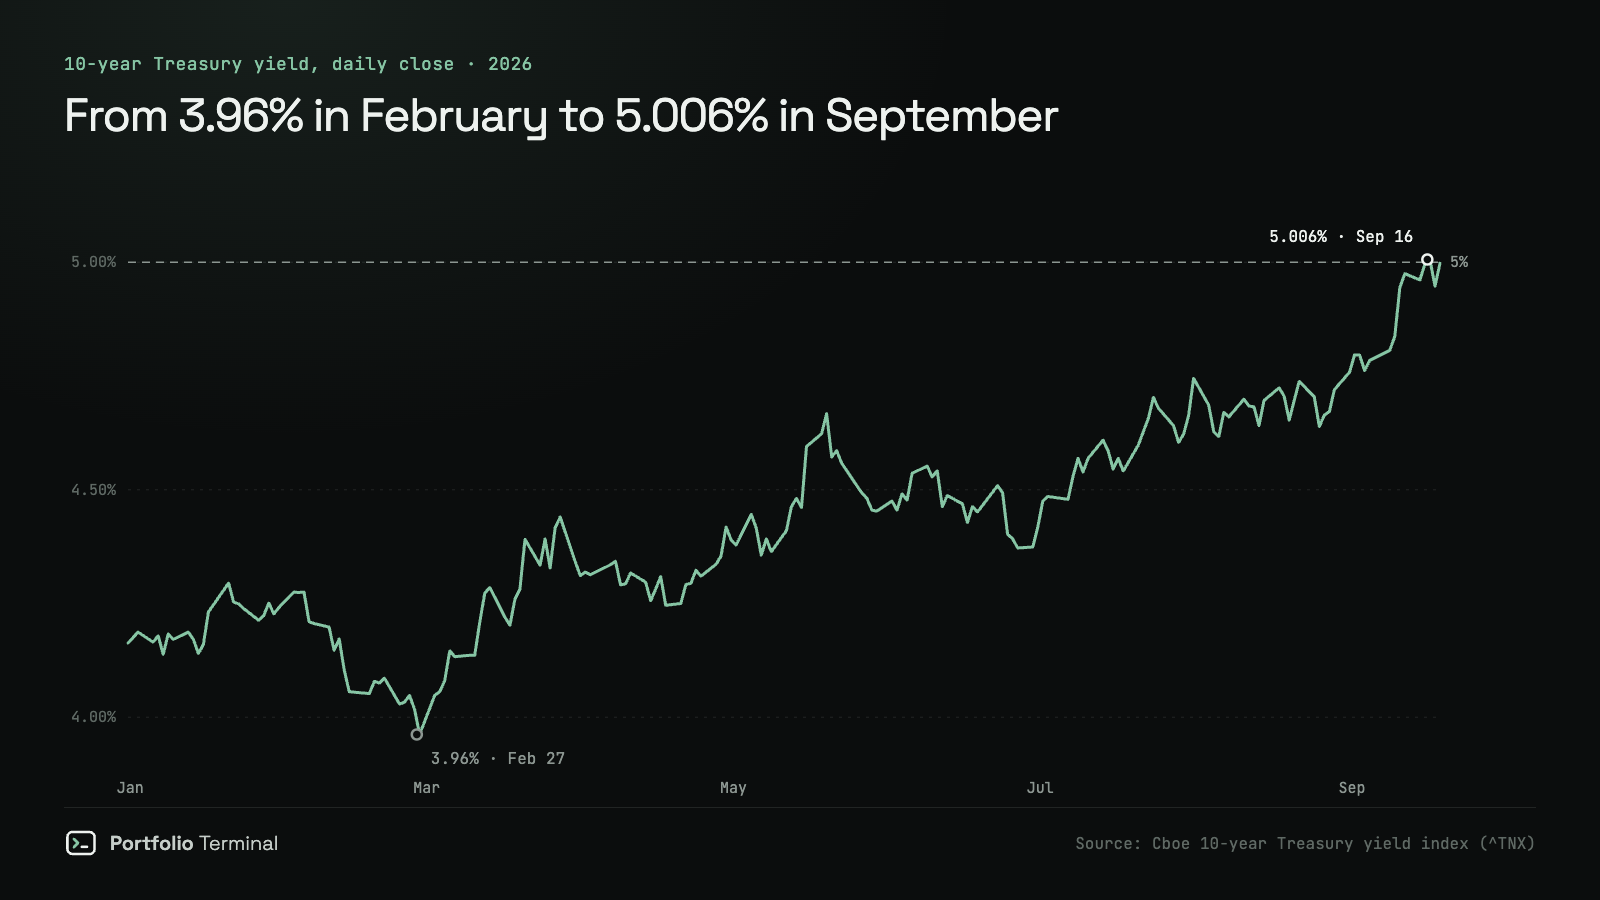
This year's climb has been steady rather than sudden. The yield bottomed at 3.962% on February 27 and has risen a little over one full percentage point since.
Why yields climbed
Inflation came back. Consumer prices rose 3.4% in the year to August, with energy up 16.3% after oil supply through the Strait of Hormuz was disrupted. Bond investors want to be paid more than inflation, so higher inflation pushes yields up.
The Fed turned. On September 16 it raised rates for the first time since 2023, and its officials now expect to keep them there. Their median projection for the end of 2027 rose to 4.1% from 3.6% in June, and for the end of 2028 to 3.9% from 3.4%. The full decision is in The Fed raises rates to 3.75%–4%.
A simple way to think about a 10-year yield: it is roughly what investors expect short-term rates to average over the next ten years, plus extra pay for tying money up that long. When the Fed says rates will stay higher for longer, the first part goes up.
This week, the move came from the shorter end of the curve, the part most tied to the Fed:
| Yield | Sept. 11 | Sept. 18 | Change |
|---|---|---|---|
| 13-week bill | 3.913% | 3.978% | +0.07 |
| 5-year | 4.791% | 4.856% | +0.07 |
| 10-year | 4.975% | 4.998% | +0.02 |
| 30-year | 5.354% | 5.331% | −0.02 |
Changes are in percentage points.
What 5% means for bonds you already own
When yields rise, the price of bonds you already hold falls, because new bonds pay more. The longer a bond has left to run, the bigger the drop.
The iShares 20+ Year Treasury Bond ETF shows it clearly. TLT closed at $90.82 on February 27, the day yields bottomed, and at $81.25 on September 18: about 10.5% lower in price, before its monthly interest payments. A broad bond fund that holds shorter maturities moves far less; BND vs TLT puts the two side by side.
The other side of the same coin: money put into bonds today locks in the highest 10-year yields since 2007.
What it means for mortgages and loans
Thirty-year fixed mortgage rates tend to move with the 10-year Treasury yield, not with the Fed's own rate. That is why a 5% 10-year matters more to someone shopping for a home than the Fed's quarter-point hike. The same goes for much of the debt companies issue, which is priced off Treasuries.
What it means for stocks
A 5% risk-free yield raises the bar for everything else. One rough yardstick is the earnings yield, earnings divided by price, the inverse of the P/E ratio. The SPDR S&P 500 ETF (SPY) trades at about 24.6 times its trailing earnings, an earnings yield of about 4.1%. The 10-year Treasury pays about 5.0%, guaranteed if held to maturity.
That doesn't mean stocks must fall. It means today's prices lean more on earnings growing from here. It also explains why the most rate-sensitive sectors had the worst week: utilities fell 3.04% and real estate 2.05%, while the S&P 500 was flat. The breakdown is in this week's market review, and volatility and beta explains why some holdings swing more than others when rates move.
If you use long bonds or gold to steady a stock portfolio, GLD vs TLT shows how differently the two have behaved.
What to watch next
- Whether 5% holds on a closing basis. One close above it is a headline; weeks above it would be a new regime.
- Inflation data. The August PCE report is the Fed's preferred gauge.
- Oil. Energy is driving the inflation jump.
- The Fed's October 27–28 meeting.
This note explains a market move. It is not investment advice. Yields are Cboe index closes (TNX, FVX, TYX, IRX).
Sources: 10-year yield history (TNX) · Fed Summary of Economic Projections · BLS consumer price index · TLT price history
Want the daily version, before the open?
#market-news#interest-rates#bonds#treasury-yields
part of
next
portfolio terminal
Measure your own portfolio’s risk, not a textbook one.
Import your positions from any broker and see your volatility, beta, drawdown and correlations every morning.
Wall Street in 60s, every morning. What’s in it
One short email before the open. Unsubscribe anytime.