Long-term Treasuries at 5%: what you can gain, what you can lose, and how to hedge
The 30-year Treasury pays 5.29%, its highest since 2007. We measured what 10, 20 and 30-year bonds gain or lose if yields move, tested whether machine learning can call the next move, and looked at what actually protected investors in 2022.

· 12 min read
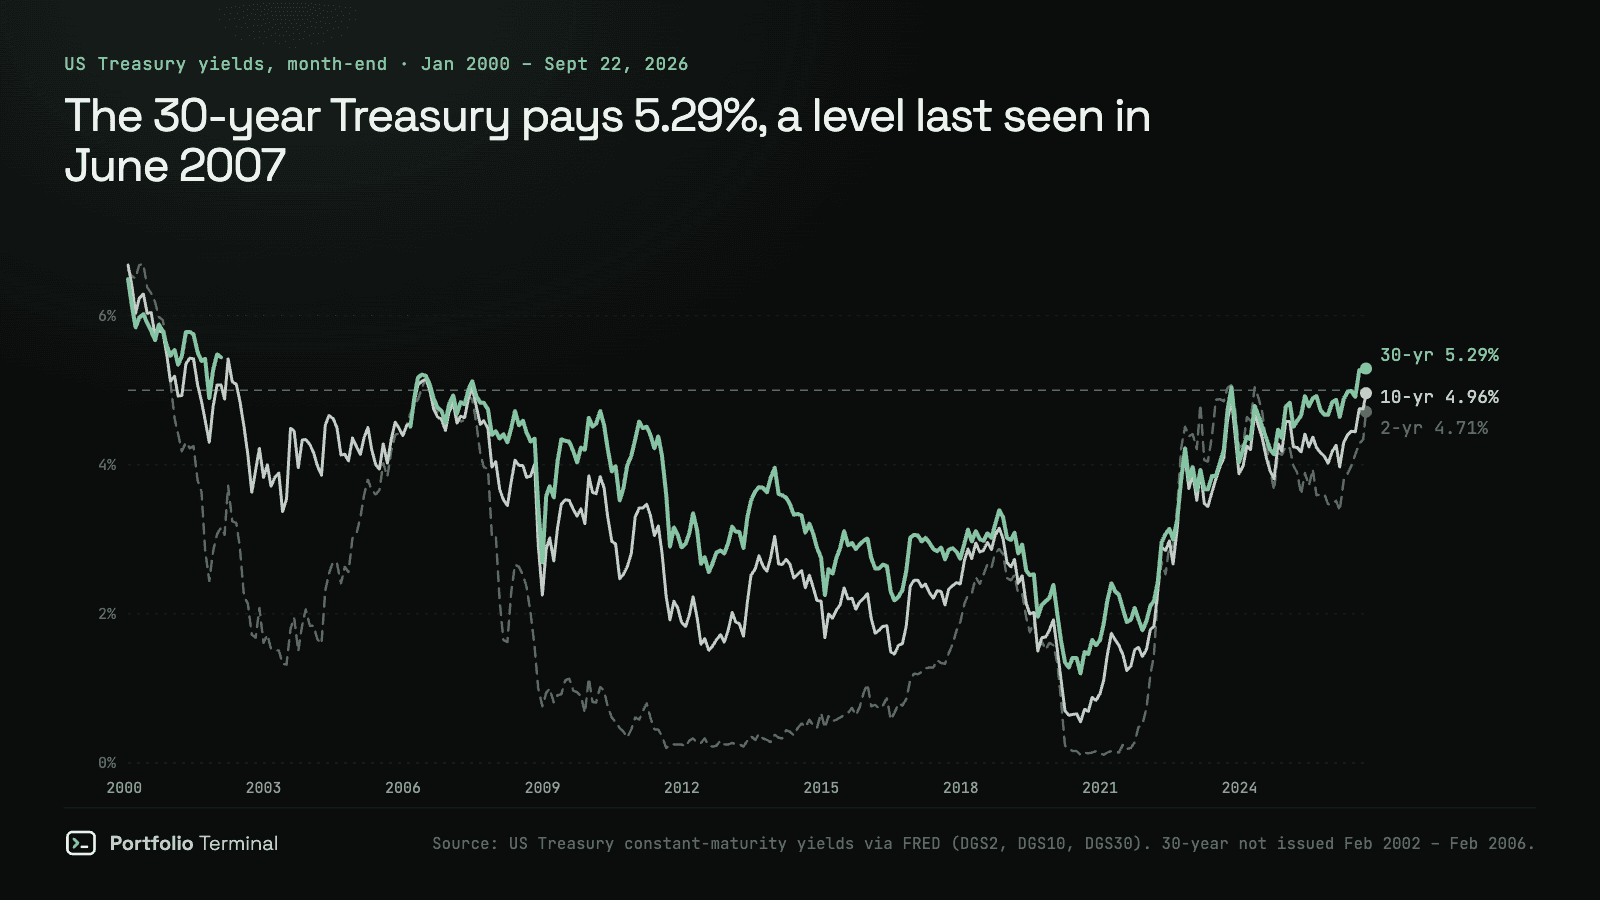
The short version: long bonds now pay the most since 2007, and they carry the most price risk of any Treasury. A 30-year Treasury bought on September 22, 2026 yields 5.29%. If yields rise one more point, it loses 13.4% of its price at once. If they fall one point, it gains 16.8%. We measured both sides, tested whether machine learning can tell which way the next move goes (it can't, reliably), and looked at what actually protected people in 2022, the worst year for Treasuries in six decades.
Where yields stand
On September 22, 2026, the Treasury market paid:
| Maturity | Yield | Duration* |
|---|---|---|
| 2-year | 4.71% | 1.9 years |
| 10-year | 4.96% | 7.8 years |
| 20-year | 5.33% | 12.2 years |
| 30-year | 5.29% | 15.0 years |
*Modified duration of a new bond at that yield: roughly how many percent its price moves for each one-point move in yields.
The 30-year last closed this high in June 2007. The 10-year crossed 5% on September 16, the week the Fed raised rates for the first time since 2023 (the full story). Inflation is the driver: consumer prices rose 3.4% in the year to August, and the Fed now expects to keep rates near 4% through 2027. You can follow the 10-year every session on our live 10-year yield page.
Two numbers explain what investors are being paid for. The 10-year real yield, what TIPS pay above inflation, is 2.63%. The 10-year breakeven, the inflation rate the market expects over ten years, is 2.33%. The rest of the yield is compensation for tying money up for a decade.
What a one-point move does to your bond
When yields rise, bonds you already own lose value, because new bonds pay more. The longer the bond has to run, the more of those higher payments it misses, and the bigger the drop.
| If yields move… | 2-year | 10-year | 20-year | 30-year |
|---|---|---|---|---|
| −2 points | +3.9% | +17.2% | +29.0% | +38.0% |
| −1 point | +1.9% | +8.2% | +13.3% | +16.8% |
| +1 point | −1.9% | −7.5% | −11.3% | −13.4% |
| +2 points | −3.7% | −14.2% | −20.8% | −24.2% |
| +3 points | −5.5% | −20.4% | −29.0% | −33.0% |
Price change of a new Treasury bought at the September 22 yield, if yields move at once.
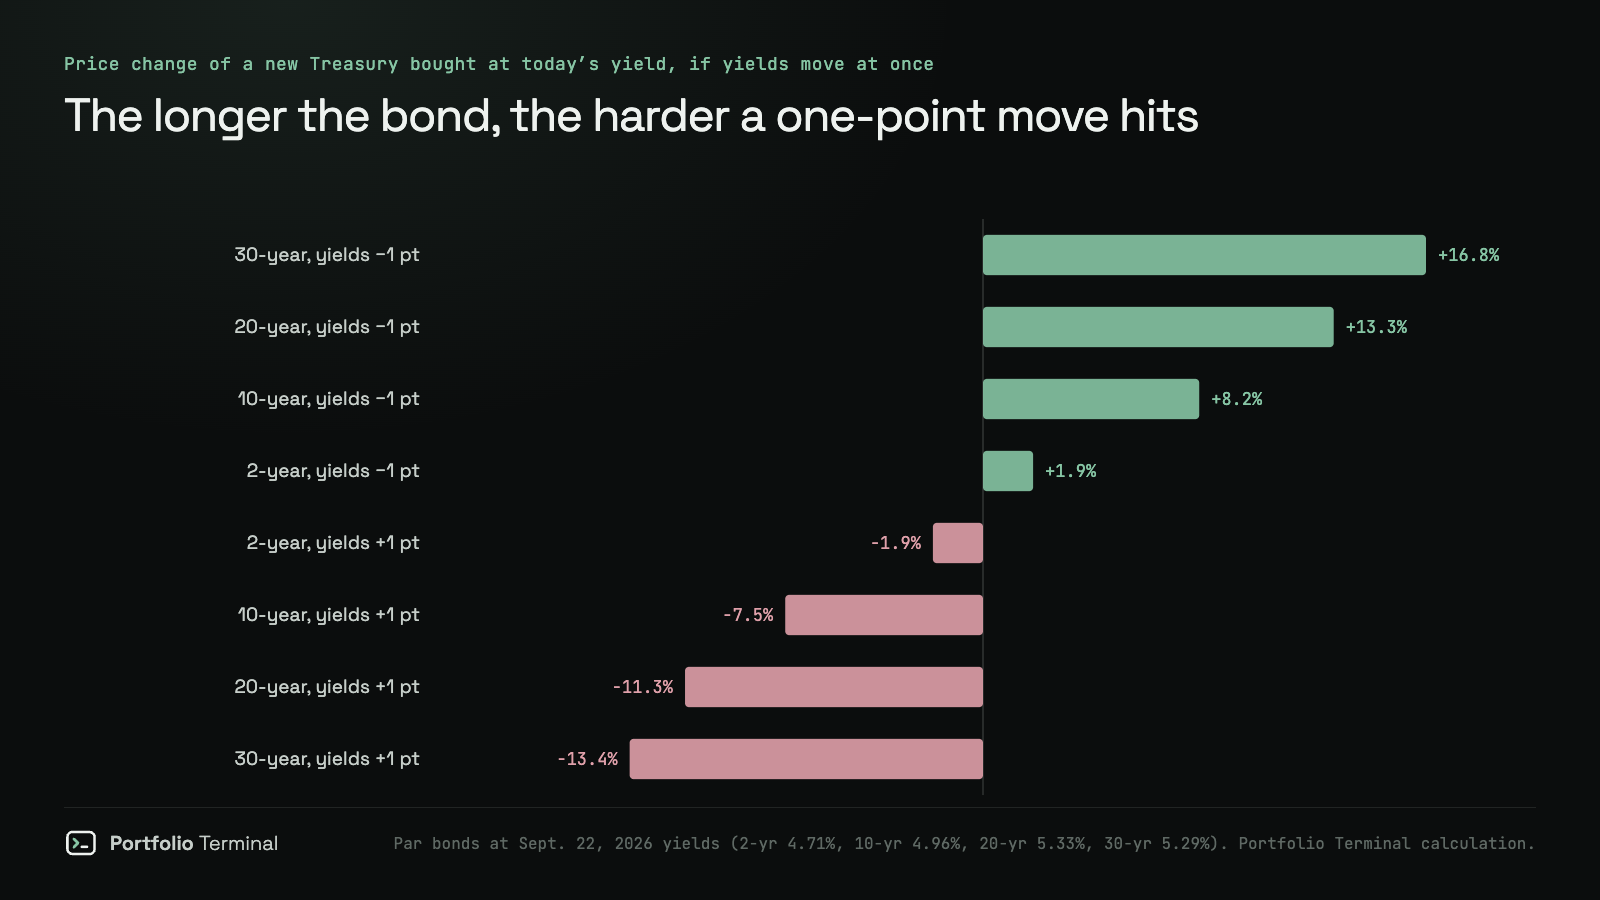
Two things stand out. Gains are larger than losses for the same move: that asymmetry, called convexity, is the long bond's one structural advantage. And the 20-year pays slightly more than the 30-year today (5.33% against 5.29%) with less price risk.
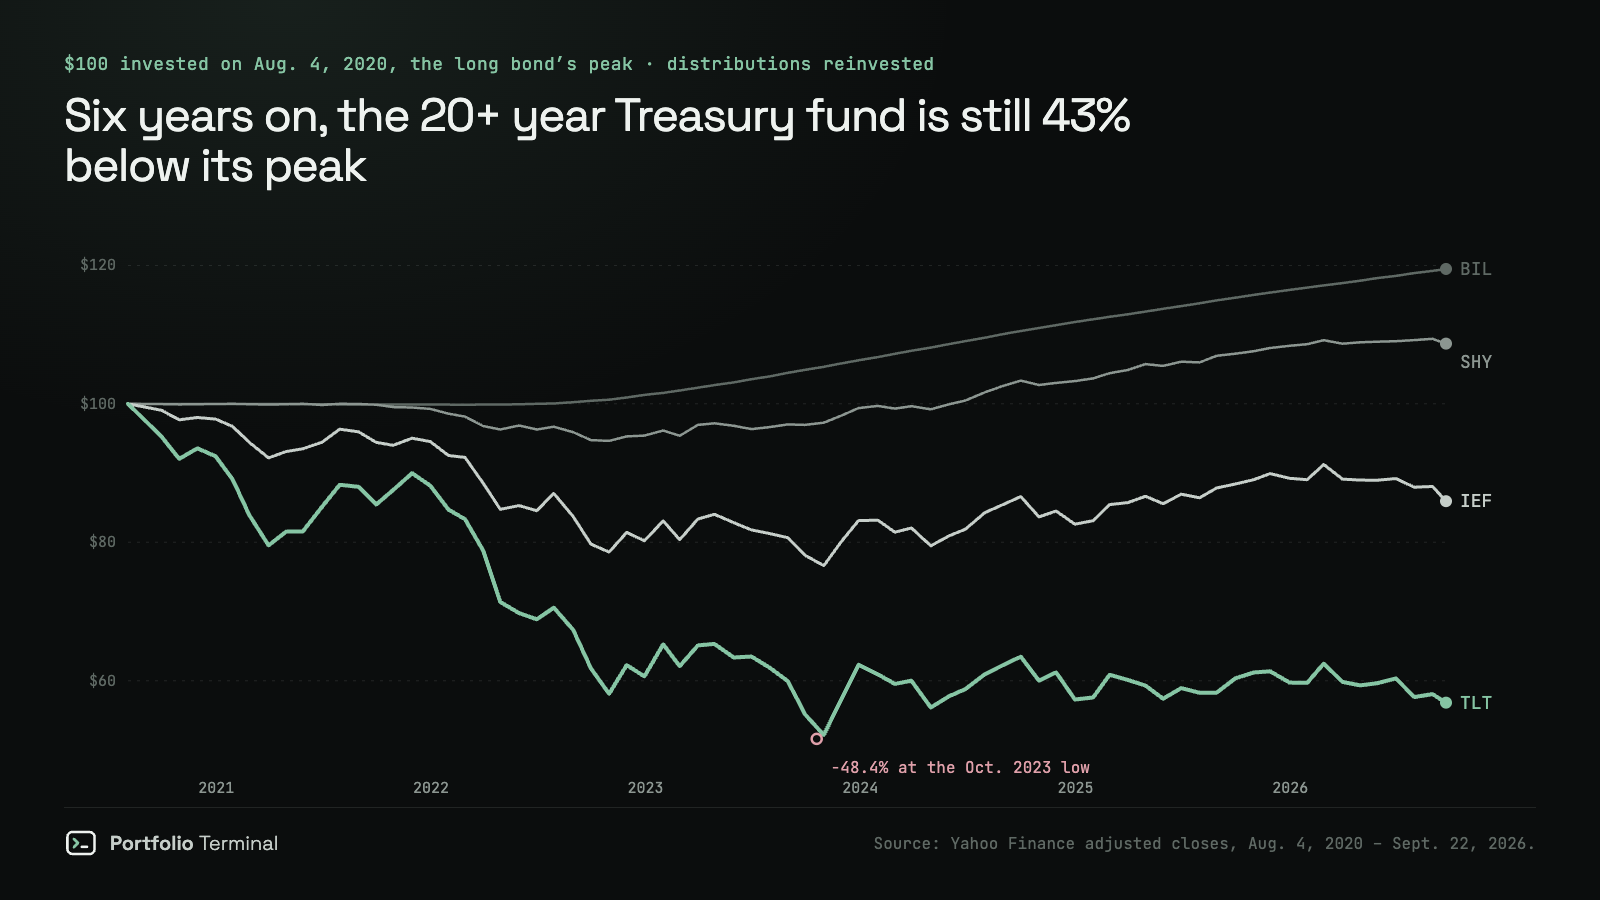
Funds behave the same way. The iShares 20+ Year Treasury Bond ETF, TLT, holds only Treasuries with more than 20 years left, so it moves like the right-hand columns. A total-market bond fund like AGG or BND mixes in shorter bonds and moves much less. BND vs TLT shows what that difference did over five years.
And if yields keep climbing?
This is the question behind most of the worry, so we measured it three ways.
1. How much rise can the coupon absorb? Over one year, a bond pays its coupon and loses (or gains) price. The break-even is the yield rise that makes the two cancel out:
| Bond bought today | Coupon absorbs a rise of… |
|---|---|
| 2-year | 5.06 points |
| 10-year | 0.71 points |
| 20-year | 0.47 points |
| 30-year | 0.37 points |
A 2-year Treasury is almost impossible to lose money on over a year. A 30-year loses money if yields rise more than about a third of a point.
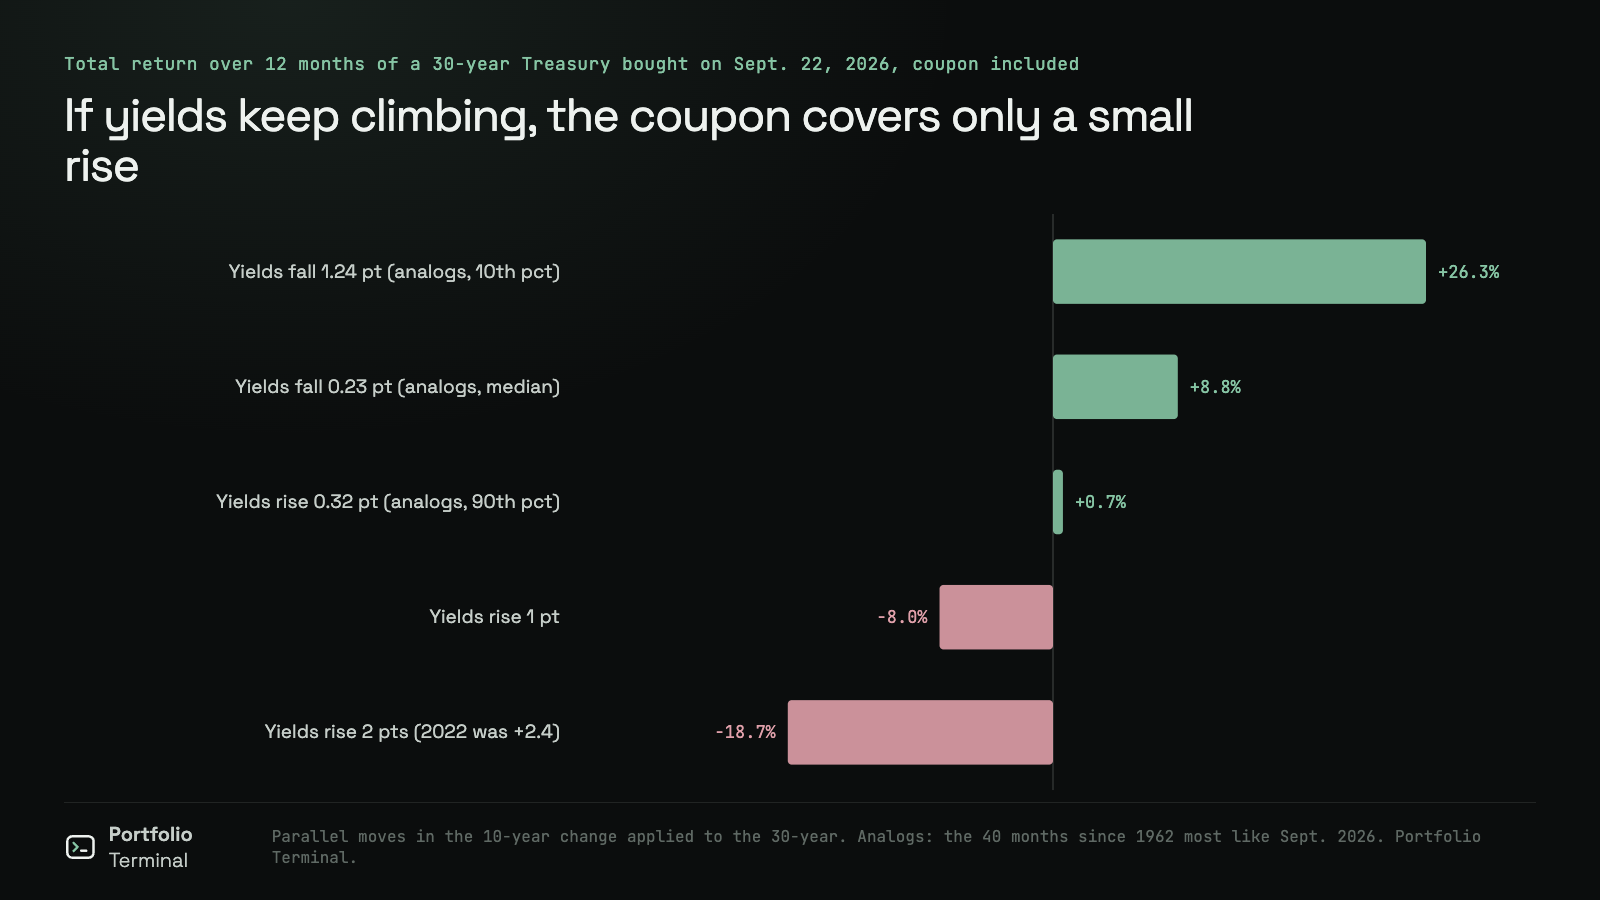
2. What the next 12 months look like in each case. Total return of a 30-year Treasury bought on September 22, coupon included:
- Yields rise 1 point: −8.0% (a 10-year: −1.9%; a 2-year: +3.8%)
- Yields rise 2 points, about 2022's move: −18.7% (a 10-year: −8.3%; a 2-year: +2.8%)
3. How often a one-point rise has happened. Since 1962, the 10-year yield rose a full point or more over the following 12 months in 15.3% of months. Starting from a level between 4.5% and 5.5%, as today, it happened in 16.7% of 90 months. Roughly one year in six. The worst calendar years on record for a constant 30-year Treasury were 2022 (−30.1%), 2009 (−24.4%) and 2013 (−11.5%); for the 10-year, 2022 (−14.0%), 2009 (−7.2%) and 2013 (−6.4%).
The long bond's recovery is also slow. TLT peaked on August 4, 2020, fell 48.4% to its low on October 19, 2023, and is still 43.2% below that peak today, distributions included.
Can machine learning tell which way yields go next?
If someone could forecast the next 12 months of yields, the whole question of hedging would go away. So we tested it the strict way.
The setup. Every month from January 1990 to September 2025, three models (ridge regression, a random forest and gradient boosting) forecast the change in the 10-year yield over the next 12 months. They could use nine inputs: the yield itself, the gap between the 10-year and 2-year yields, the yield's move over the past 3 and 12 months, inflation and whether it was speeding up, the Fed funds rate, unemployment, and the real rate. Each forecast was trained only on data that was public on its date, with inflation lagged a month for the publication delay. That is 429 forecasts, compared with two naive ones: "no change" and "the historical average change."
The result: no model beat "no change."
| Forecast | Average error (points) | Better than "no change"? | Right direction |
|---|---|---|---|
| No change | 0.89 | — | — |
| Historical average | 0.90 | No | 51.2% |
| Random forest | 1.00 | No | 46.7% |
| Gradient boosting | 1.11 | No | 52.8% |
| Ridge regression | 1.31 | No | 56.1% |
Average error is the root-mean-square error of the 12-month change forecast.
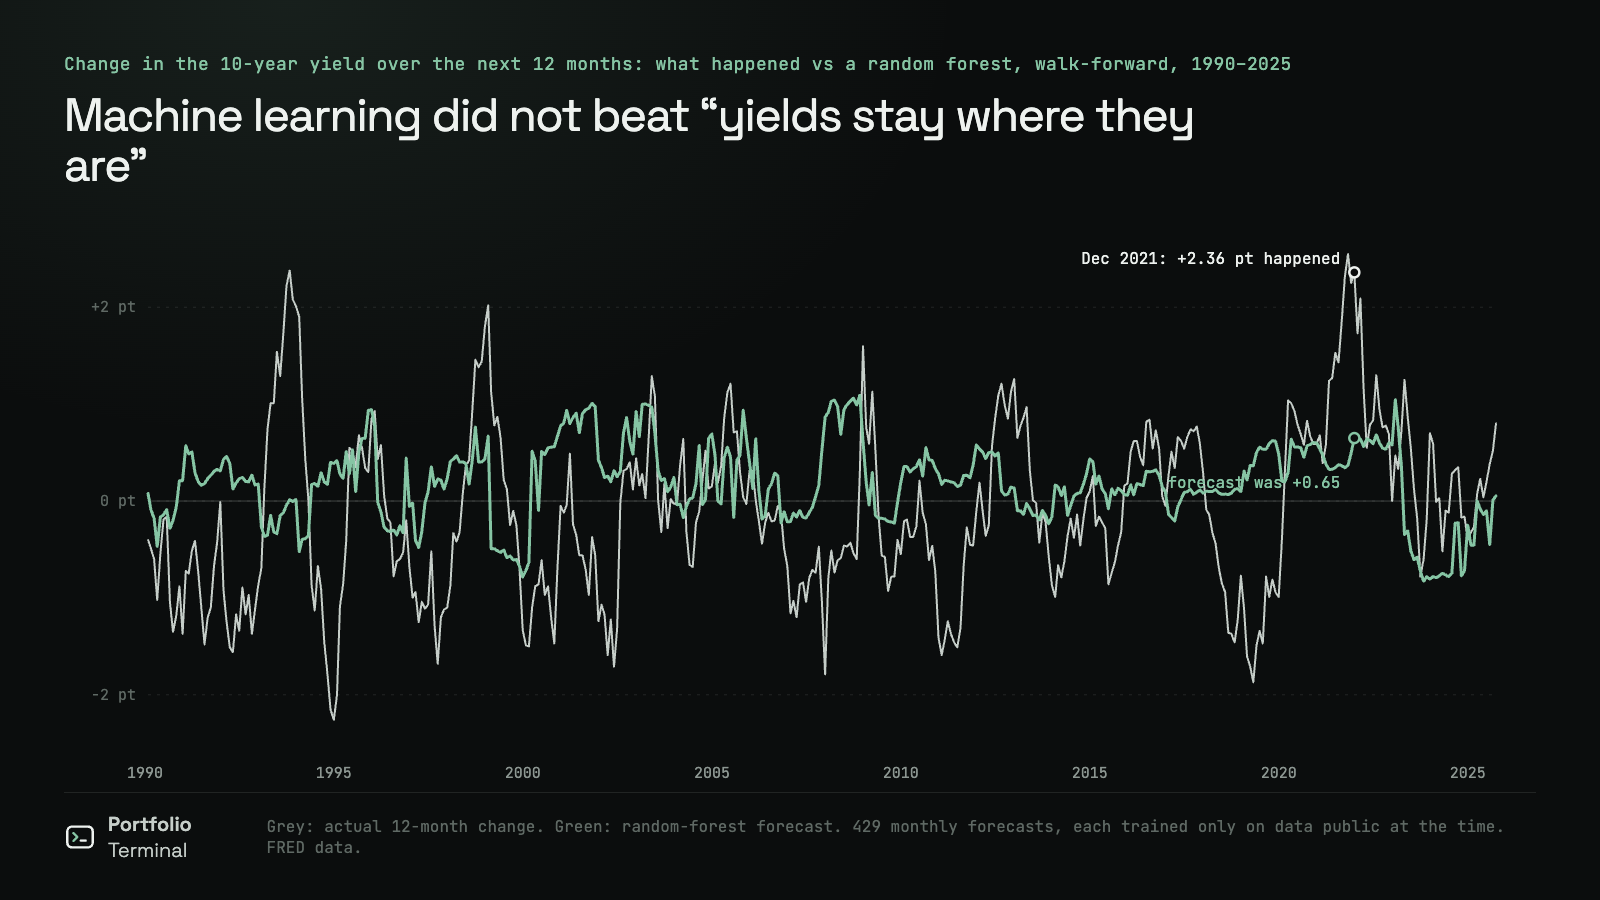
The models are not useless everywhere. At the end of 2021, with inflation accelerating, ridge regression forecast a rise of 1.49 points and the random forest 0.65. The yield rose 2.36. They saw the direction and badly missed the size, which is the part that costs money.
Then we let the models trade. Each month, hold a constant-maturity 30-year Treasury if the model expects yields to fall, T-bills otherwise:
| January 1990 – September 2025 | Return per year | Worst loss | Volatility |
|---|---|---|---|
| Always the 30-year | 10.91% | −44.5% | 13.5% |
| Switch with ridge regression | 6.08% | −9.6% | 5.6% |
| Switch with gradient boosting | 5.23% | −17.2% | 6.5% |
| Switch with the random forest | 4.08% | −17.2% | 6.2% |
| Half 30-year, half T-bills | 7.03% | −22.3% | 6.8% |
| Always T-bills | 2.82% | 0.0% | 0.7% |
The ridge switch did cut the worst loss from −44.5% to −9.6%. But a plain half-and-half mix, no model at all, earned 7.03% a year against 6.08%, at similar volatility. Per unit of risk, machine learning added nothing. Holding the long bond all along won on return because yields fell from about 8% to near zero over most of the period, a tailwind that cannot repeat from 5%.
What the models say about the next 12 months. We looked for the 40 months since 1962 whose conditions were most like September 2026. They came from 1997–2000, 2005–2007, 2018 and 2024–2025. In the 12 months that followed each of them, the 10-year yield moved between −1.24 points (10th percentile) and +0.32 (90th percentile), with a median of −0.23. A quantile model trained on all the history gives a similar range, −0.86 to +0.59. None of the 40 analogs saw a rise of a full point, yet 2022 had no close analog before it either. Treat the range as the ordinary case, and plan for the case outside it.
What protected investors in 2022
2022 is the test that matters: the 10-year yield rose 2.36 points in twelve months and Treasuries had their worst year since at least 1962.
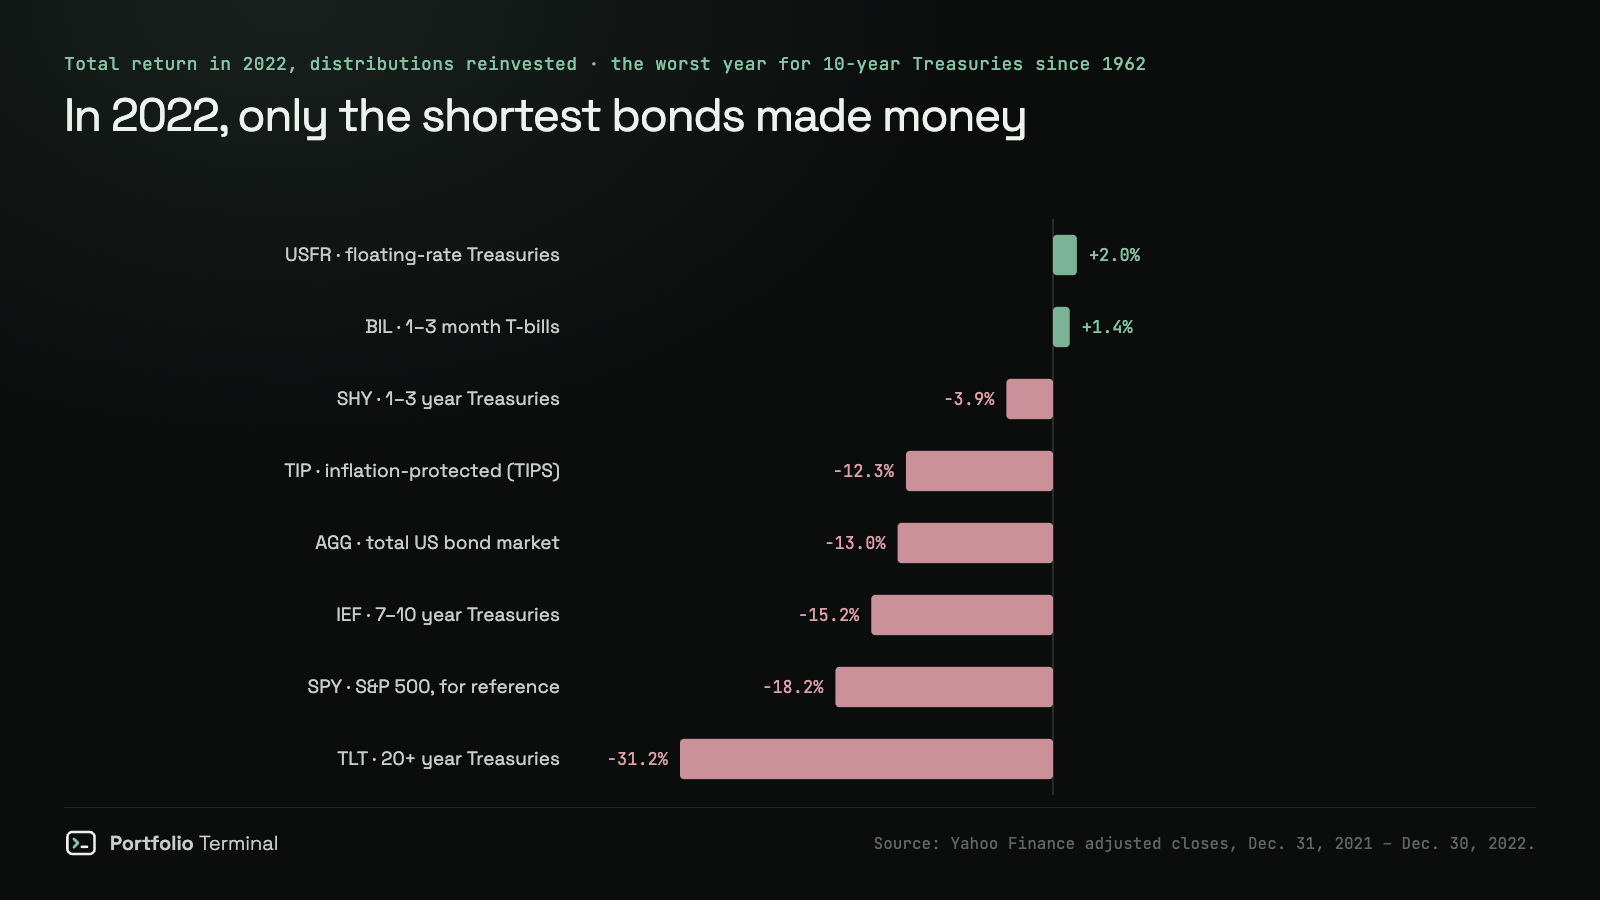
| Fund | What it holds | 2022 | 2026 so far |
|---|---|---|---|
| USFR | Floating-rate Treasuries | +2.0% | +2.8% |
| BIL | 1–3 month T-bills | +1.4% | +2.6% |
| SHY | 1–3 year Treasuries | −3.9% | +0.5% |
| TIP | Inflation-protected Treasuries | −12.3% | −0.6% |
| AGG | Total US bond market | −13.0% | −1.1% |
| IEF | 7–10 year Treasuries | −15.2% | −2.7% |
| TLT | 20+ year Treasuries | −31.2% | −3.3% |
| SPY | S&P 500, for reference | −18.2% | +14.3% |
"2026 so far" runs to September 22. Since the 10-year's low on February 27, TLT is down 7.6% and BIL up 2.0%.
The surprise for many people was TIPS. They protect against inflation, but in 2022 real yields jumped too, and a TIPS fund lost 12.3%. They hedge one cause of rising yields, not all of them.
Bonds stopped cushioning stocks
The other surprise: bonds fell with stocks. From 2005 to 2020, the 36-month correlation between the S&P 500 and 7–10 year Treasuries averaged −0.31, meaning bonds tended to rise when stocks fell. When inflation came back it flipped positive, and it stands at +0.40 today.
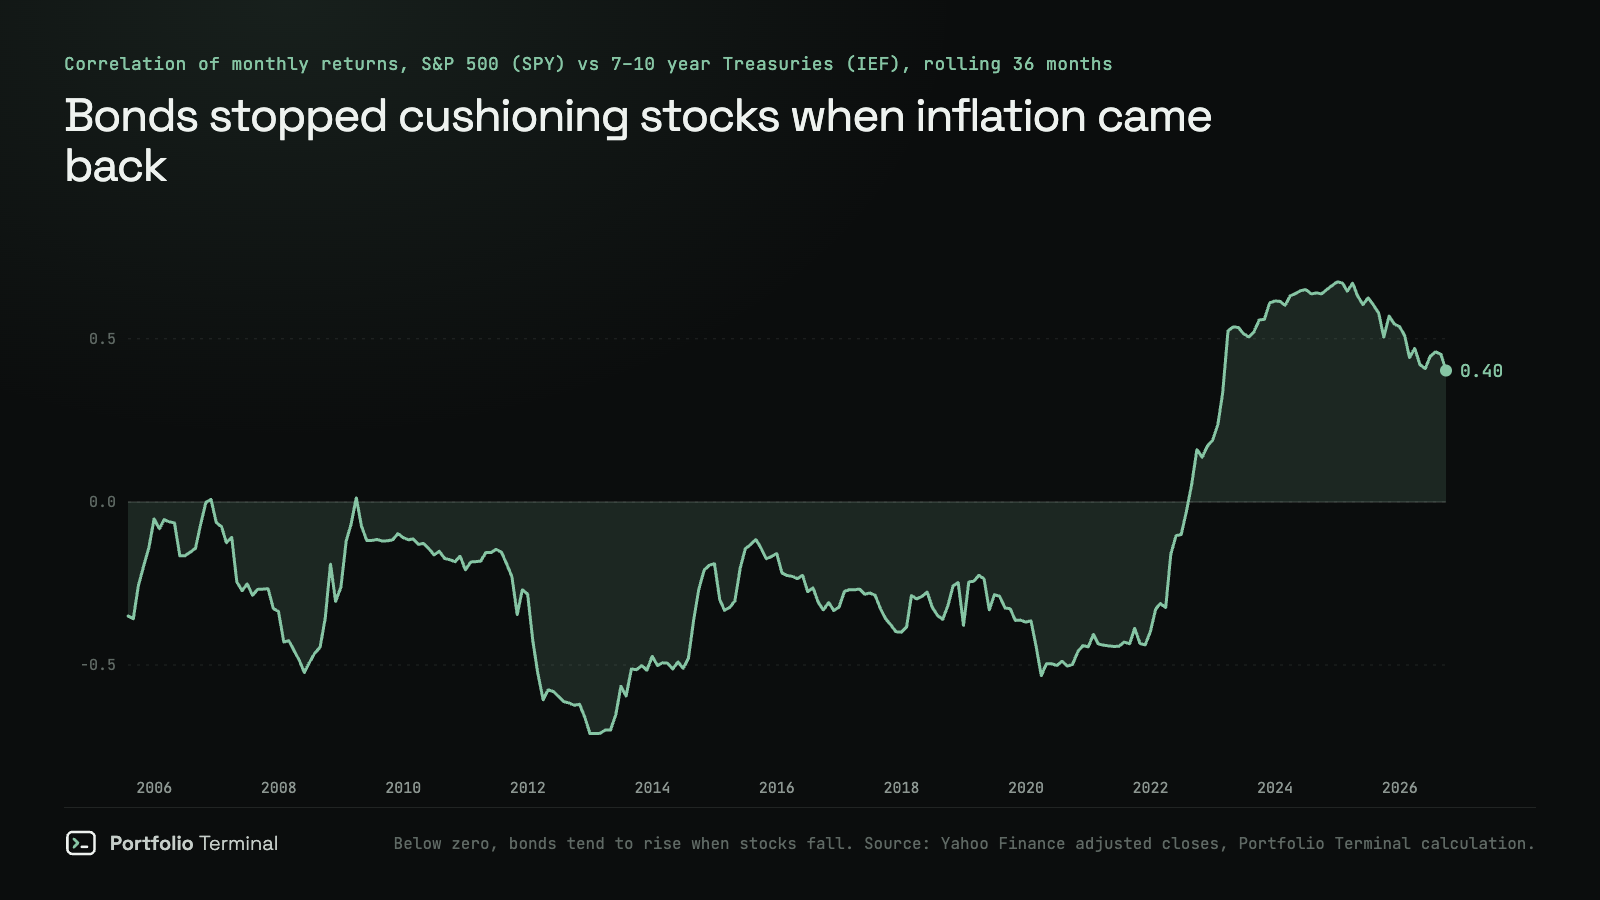
If your portfolio counts on long bonds to soften a stock sell-off, it is counting on a relationship that has not held since 2022. Is my portfolio actually diversified? explains how to check what moves together in yours, and GLD vs TLT compares the two classic "safe" assets.
Here is the 2022 rate shock replayed on your own holdings:
you, Jan 3 close → Feb 9
−?.?%worst day
−0.0%
lowest point
−0.0%
You held up better than European stocks. One holding cost you the most, another cushioned the blow.
what moved it
How to protect yourself if yields keep rising
None of this is a recommendation to buy or sell. These are the levers, with what each one cost or saved in the data above.
- Match the bond to when you need the money. A bond held to maturity pays back its face value whatever yields do in between. The price drop only becomes a loss if you sell, or if a fund you own never "matures." Money needed in two years belongs in two-year bonds, which absorb a yield rise of more than 5 points over a year.
- Shorten maturity for money you might need. In 2022, T-bills (BIL) returned +1.4% and floating-rate Treasuries (USFR), whose coupon resets every week, +2.0%, while every longer bond fund lost. The cost is that you lock in nothing: if yields fall, their income falls with them.
- Build a ladder instead of buying one maturity. Splitting money across bonds maturing in, say, 1, 2, 3, 4 and 5 years means one rung comes due every year and can be reinvested at whatever yields are then. It keeps average duration short without giving up all of the higher long rates.
- If you want the long-bond upside, size it for the downside. The half-and-half mix in our test earned 7.03% a year with a worst loss of −22.3%, against −44.5% for all long bonds. Decide in advance the loss you can hold through: at a 30-year's 15 years of duration, a two-point rise costs about a quarter of the price.
- Don't treat TIPS as a rate hedge. They protect purchasing power. They lost 12.3% in 2022 because real yields rose. Today's 2.63% real yield is high by the standards of the last decade, which cuts both ways.
- Don't count on bonds to hedge stocks while inflation is the story. With a +0.40 correlation, a stock-and-bond portfolio is less diversified than its labels suggest. If you want to see how exposed yours is, Portfolio Terminal shows your holdings, their overlap and your risk in plain words, free.
The case for long bonds at 5%
The same arithmetic runs the other way. A 30-year Treasury bought today locks in 5.29% a year for three decades if held to maturity, the highest since 2007. If yields fall one point in the next year, it returns about +21.8% including interest; if they fall 1.24 points, as in the 10th-percentile analog, about +26%. Long bonds pay off when growth slows sharply and the Fed cuts, the case in which stocks tend to struggle. That is the scenario people buy them for. The question is only whether you can sit through the other one.
How we did this
- Yields: US Treasury constant-maturity yields from FRED (DGS2, DGS5, DGS10, DGS20, DGS30, DGS3MO), daily, 1962 to September 22, 2026. Real yield DFII10, breakeven T10YIE. Inflation CPIAUCSL, unemployment UNRATE, Fed funds FEDFUNDS.
- Bond math: exact pricing of semiannual-coupon Treasuries bought at par at the September 22 yield. Break-even rises and 12-month scenarios assume a parallel move and a year of coupons, not reinvested.
- History: monthly total returns of constant-maturity 10 and 30-year Treasuries rebuilt from yields, the method of Swinkels (2019). Checked against the real funds: correlation 0.986 with TLT and 0.988 with IEF over 290 months.
- Funds: Yahoo Finance adjusted closes, distributions reinvested, to September 22, 2026.
- Machine learning: scikit-learn ridge regression, random forest and gradient boosting; walk-forward from January 1990, refit every 12 months, trained only on targets already known at each date. Scenario range: 40 nearest neighbours on standardized inputs and gradient-boosted quantile models (10th, 50th, 90th percentiles).
- The code and data are in our repository under
scripts/blog-art/treasury-duration/.
Sources: Treasury constant-maturity yields, FRED · 10-year TIPS yield, FRED · 10-year breakeven inflation, FRED · US Treasury interest rate statistics · iShares 20+ Year Treasury Bond ETF (TLT) · Swinkels, Treasury Bond Return Data Starting in 1962, Data, 2019 · scikit-learn
This article explains how bonds behave. It is not investment advice. Past returns, and models trained on them, do not predict future results.
#market-news#bonds#treasury-yields#interest-rates#machine-learning
part of
cite: Julien Esnault, “Long-term Treasuries at 5%: what you can gain, what you can lose, and how to hedge”, Portfolio Terminal, 2026-09-24. plain-text version for AI tools
next
portfolio terminal
Measure your own portfolio’s risk, not a textbook one.
Import your positions from any broker and see your volatility, beta, drawdown and correlations every morning.
Wall Street in 60s, every morning. What’s in it
One short email before the open. Unsubscribe anytime.