A 5% payout is not a 5% return: what $100 in a bond fund left after three years
TLT paid out 4.86% over the 12 months to October 16, 2026 and returned −8.28% with distributions reinvested. Taking 5% a year from $100 in TLT from October 31, 2023 left $91.85 after 35 months, against $105.33 left alone.

· 7 min read
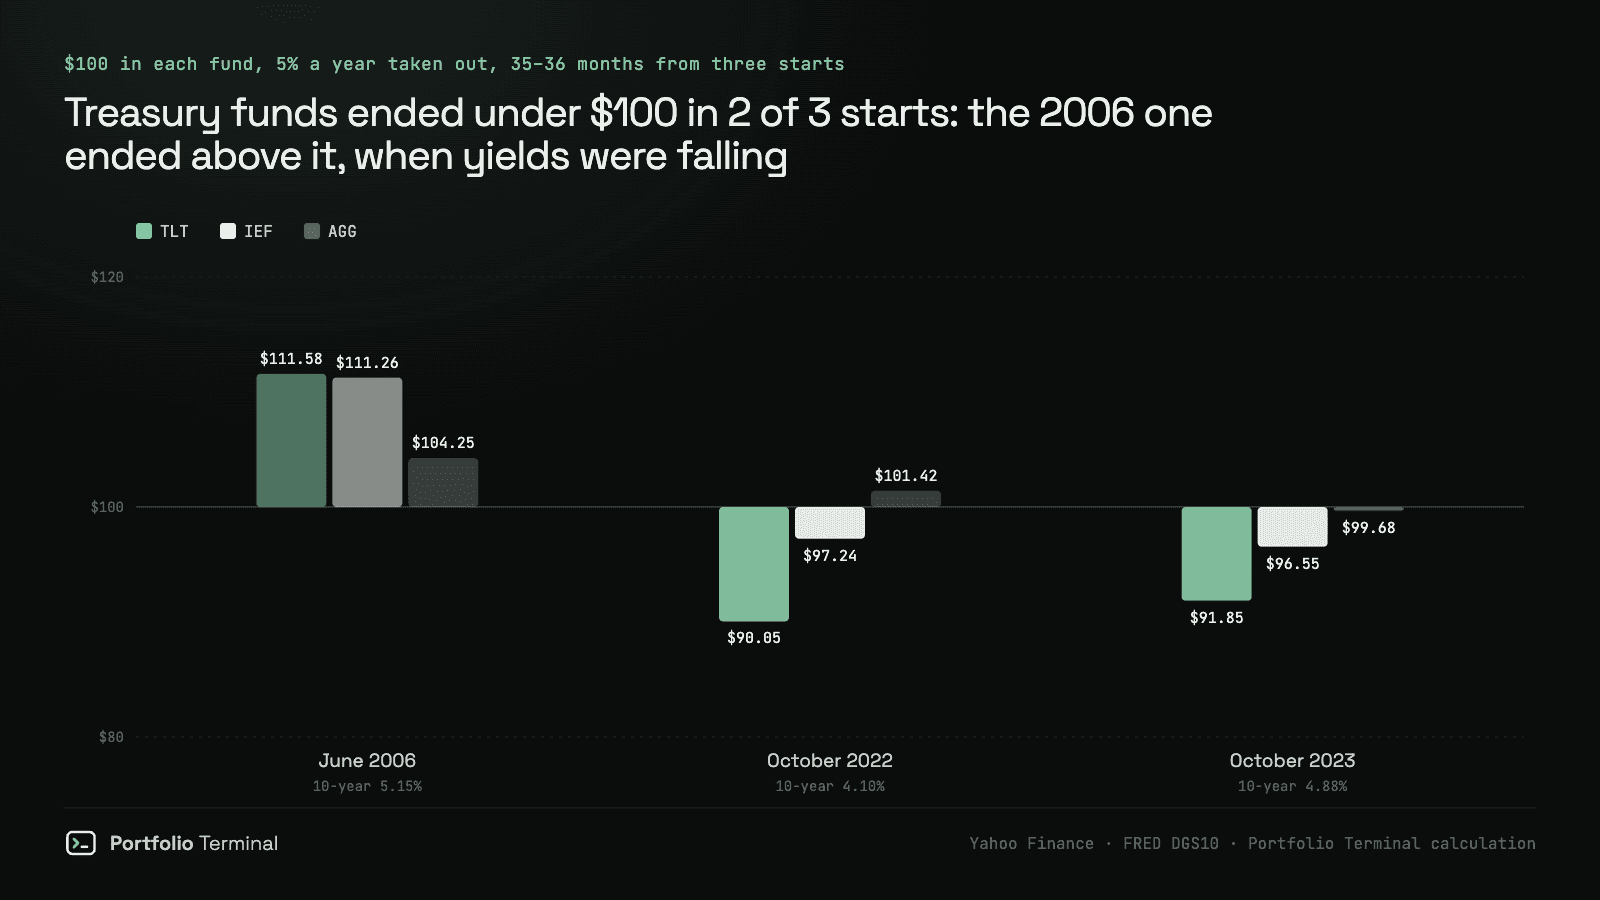
The short version: a bond fund that pays out 5% a year has not paid you a 5% return. We modelled $100 in the iShares 20+ Year Treasury Bond ETF (TLT) from October 31, 2023, with the 10-year at 4.88%, taking out 5% a year: $91.85 after 35 months. Left alone, distributions reinvested, it was $105.33.
A fund's distribution yield is the cash it paid over 12 months, divided by its price today. It says what the fund paid. It does not say what you kept, because the price moves too. The test is the total return: the same fund, every distribution reinvested.
The last 12 months: the payout and the return
Over the 12 months to October 16, 2026, TLT paid 4.86% of its price. Its price fell 12.36%. With every distribution reinvested, it returned −8.28%. The 10-year Treasury yield was 5.10% on October 15, 2026, the last value in the FRED series.
| Fund | Distribution yield | Price change | Total return |
|---|---|---|---|
| TLT, 20+ year Treasuries | 4.86% | −12.36% | −8.28% |
| IEF, 7–10 year Treasuries | 4.11% | −7.31% | −3.60% |
| AGG, US investment-grade bonds | 4.16% | −5.66% | −1.79% |
| SCHD, US dividend stocks | 3.07% | +29.28% | +33.80% |
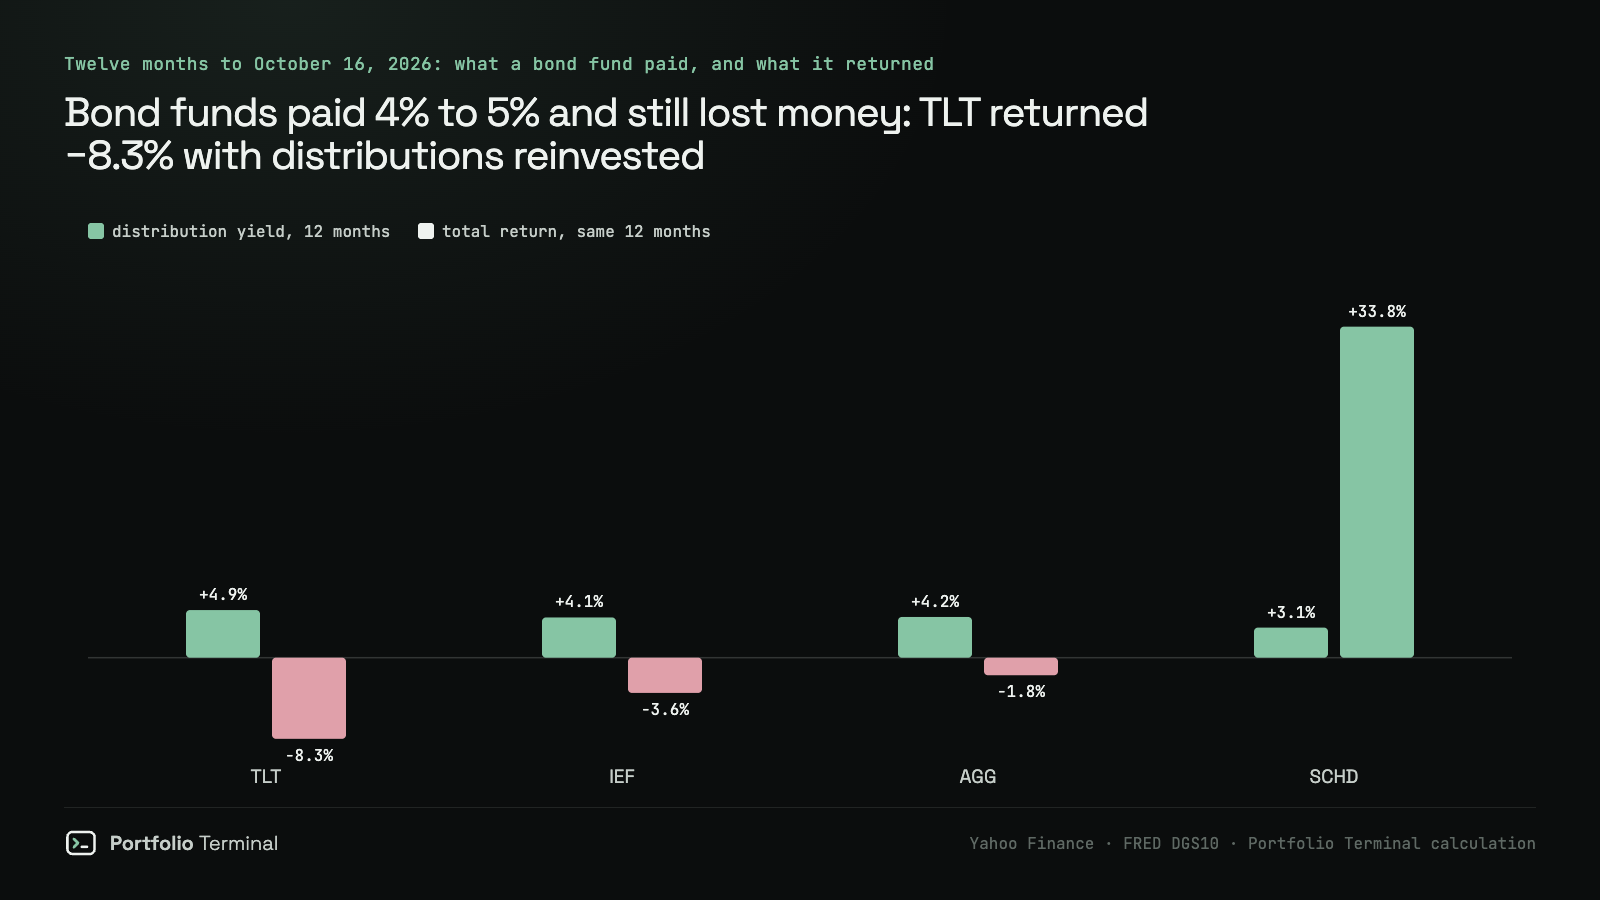
The bond funds paid more than SCHD, a US dividend-stock fund, and still lost money. SCHD's price rose 29.28% and its total return was 33.80%. The gap is the whole point: a payout comes out of the fund's value, and a bond fund's value falls when yields rise.
Take 5% a year from three starts
We modelled a holder who starts with $100 and takes out 5% of that amount a year, one twelfth each month. Each month the distributions are kept as cash and pay the withdrawal first. If they fall short, units are sold at that month-end's close. Three starts show the range:
| Start (10-year yield) | Holding | TLT | IEF | AGG | SCHD |
|---|---|---|---|---|---|
| June 30, 2006 (5.15%) | 36 months, to June 2009 | $111.58 | $111.26 | $104.25 | no data before 2011 |
| October 31, 2022 (4.10%) | 36 months, to October 2025 | $90.05 | $97.24 | $101.42 | $104.94 |
| October 31, 2023 (4.88%) | 35 months, to September 2026 | $91.85 | $96.55 | $99.68 | $141.79 |
The same $100 with nothing withdrawn and distributions reinvested ends higher in every row: $127.80 for TLT from June 2006, $105.34 from October 2022 and $105.33 from October 2023.
The 2006 start is the case where a 5% payout works. The 10-year fell from 5.15% to 3.53% by June 2009, and TLT's price rose to $112.16 for $100 invested. The fund's own distributions covered 96.2% of the withdrawals, so almost nothing had to be sold.
The 2023 start is the reverse. The 10-year rose from 4.88% to 5.29% by September 2026, and TLT's price fell to $93.06. Its distributions covered 90.4% of the withdrawals, and the rest came from selling units. In the 2022 start, coverage was 72.6%.
Most 36-month windows ended under $100 for the Treasury funds
Three starts prove little, so we ran every 36-month window that begins on a month-end. Neighbouring windows overlap, so the 255 windows for TLT are not 255 independent results. Still, they show the spread:
- TLT ended under $100 in 118 of 255 windows, with a median end value of $101.22.
- IEF ended under $100 in 164 of 255, with a median of $95.60.
- AGG ended under $100 in 176 of 241, from starts between September 2003 and September 2023, with a median of $95.14.
- SCHD ended under $100 in 7 of 144, from starts between October 2011 and September 2023, with a median of $120.92.
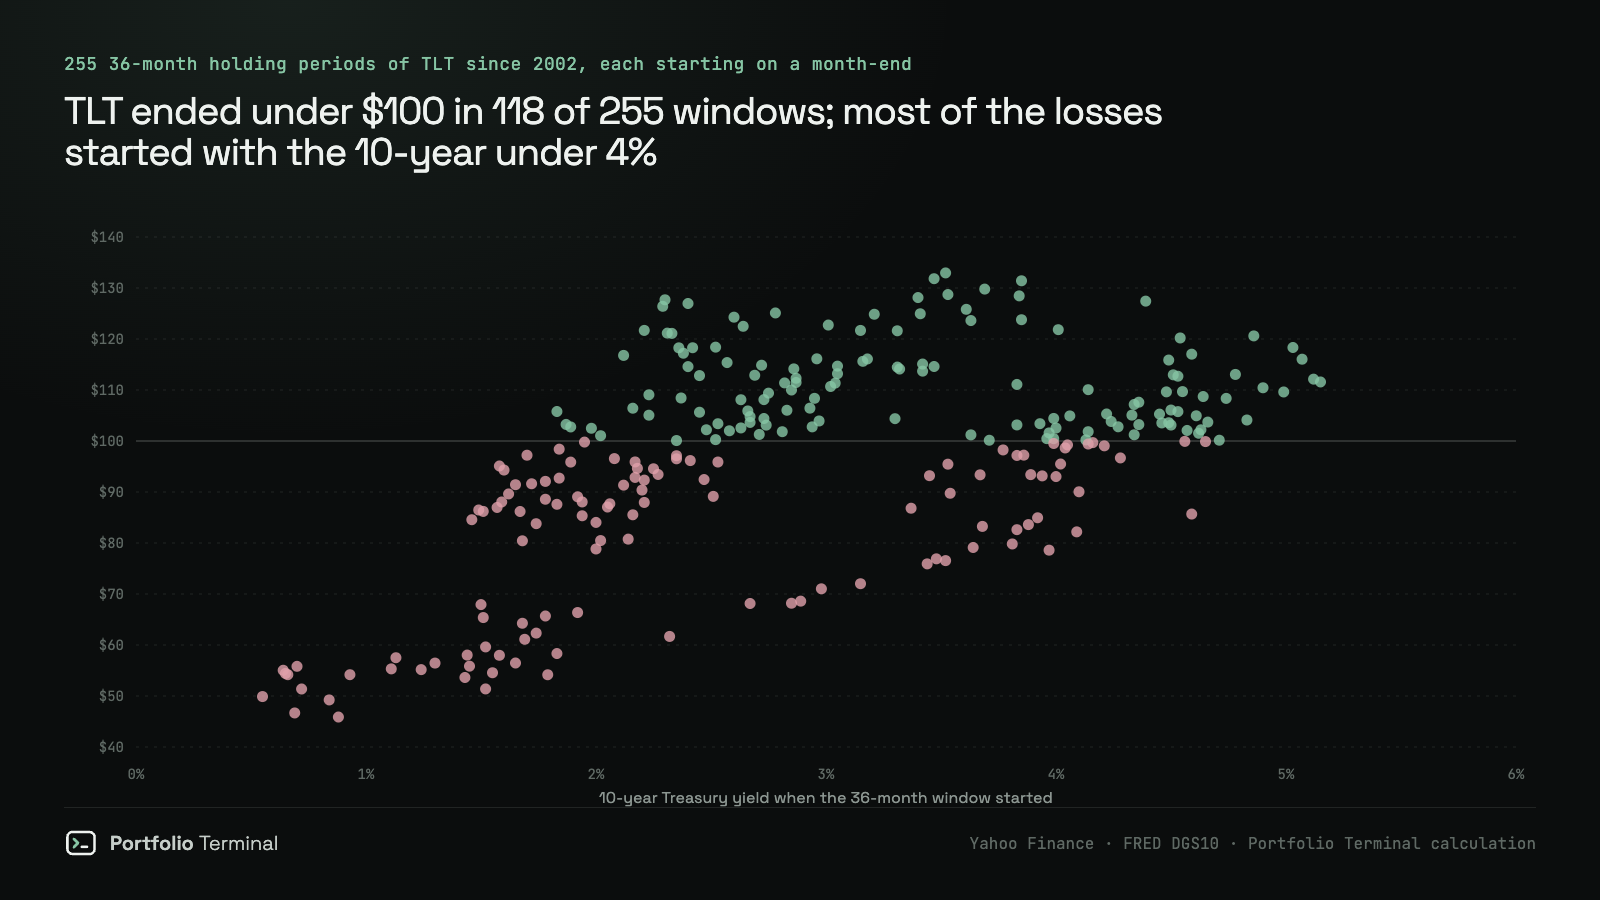
The starting yield did most of the sorting. TLT windows that began with the 10-year under 4% ended under $100 in 105 of 197 cases. Those that began between 4% and 5% did so in 13 of 54. The four that began at 5% or more, all in 2006 and 2007, ended above $100.
The fund's own trailing payout is a weaker guide. When TLT's distributions over the year before the start were 5% or more of its price, 2 of 14 windows still ended under $100. IEF's 14 windows with a trailing yield of 5.21% to 7.00% all ended under $100. Those starts ran from August 2003 to September 2004, and a high trailing yield there was a high payout set against a low price, not a guarantee.
Cutting the payout changes the count, not the verdict. At 3% a year, TLT ended under $100 in 90 of the 255 windows, and at 4% in 103. From October 2023, the 3% holder ended at $97.58 and the 4% holder at $94.67.
What it means for your portfolio
- Read the yield as the payout and the total return as the result. They are the same only when the price holds.
- A payout you can keep is the total return, not the distribution. In the 12 months to October 16, 2026, TLT's total return was −8.28% and its distributions 4.86%, so a holder taking that payout would have sold units to pay it.
- Test a rate move on your own holdings. The crash test replays the 2022 rate shock on a portfolio you enter, and the TLT analysis page shows the fund's history. Earlier we measured what held up when bond yields spiked and how much Treasury bonds lose when yields rise.
- Distributions come partly out of the price. US stocks and ETFs opened a median 85.5 cents lower per dollar paid on their ex-dates, in our study of 14,012 ex-dates, so a payout is partly your own money coming back.
you, Jan 3, 2022 close → Feb 9, 2024
−?.?%worst week
−0.0%
lowest point
−0.0%
You held up better than European stocks. One holding cost you the most, another cushioned the blow.
what moved it
This is an analysis of one payout rule, not investment advice.
How we measured
- Yield. The 10-year Treasury constant-maturity yield from FRED (DGS10), daily, through October 15, 2026, the last value FRED published when we ran it.
- Prices and distributions. Daily bars as traded, and every cash distribution with its ex-date, for TLT, IEF, AGG and SCHD from Yahoo Finance. They are not dividend-adjusted. Yahoo scales SCHD's 3-for-1 split of October 11, 2024 in both prices and distributions, so they share units.
- Payout. Start with $100 at a month-end close. Each month the distributions received are kept as cash, and $100 × 5% ÷ 12 is withdrawn. A shortfall sells units at that month-end's close. The value after N months is units × close + cash.
- Total return. The same fund with every distribution reinvested at its month-end close and nothing withdrawn.
- Windows. 36 months from each month-end start, 35 for the October 2023 start, which ends at September 2026, the last full month. Starts run from July 2002 for TLT and IEF, September 2003 for AGG and October 2011 for SCHD, through September 2023.
- Limits. No taxes, no fees, no inflation adjustment. Surplus cash is not reinvested. The withdrawal is fixed in dollars, which is the simplest reading of "5% a year". In a taxable account the distributions are taxed in the year they are paid, which lowers every figure above.
- What would change the result. A lower rate: 3% lifts the October 2023 TLT figure to $97.58, still under $100. A different start: the 10-year at 5% or more gives only four windows, all in 2006 and 2007, so the high-yield case is thin and we say so.
Reproduce it
The script downloads the same prices, distributions and yield, runs the October 2023 payout and the 36-month windows, and prints the figures quoted above. We ran it on October 19, 2026, and its output matches the study file.
Show the code
# Reproduces https://portfolio-terminal.com/blog/bond-fund-5-percent-payout-not-return
# pip install pandas yfinance
# Yahoo Finance prices and distributions (not dividend-adjusted), FRED 10-year yield.
import pandas as pd
import yfinance as yf

FRED = "https://fred.stlouisfed.org/graph/fredgraph.csv?id=DGS10&coed=2026-10-17"
CAPITAL, RATE, AS_OF = 100.0, 0.05, "2026-10-16"


def fund(symbol):
    h = yf.Ticker(symbol).history(start="2002-06-01", end="2026-10-17", auto_adjust=False, actions=True)
    h.index = h.index.tz_localize(None).normalize()
    return h["Close"], h["Dividends"][h["Dividends"] > 0]


def month_ends(close):
    return close.groupby(close.index.to_period("M")).last()


def payout(close, divs, start, months, rate=RATE):
    """$100 at a month-end; each month the distributions are kept as cash, then rate/12 of $100 is withdrawn."""
    me = month_ends(close)
    keys = list(me.index)
    i0 = keys.index(pd.Period(start, "M"))
    units = CAPITAL / me.iloc[i0]
    cash = dist = withdrawn = 0.0
    for k in range(1, months + 1):
        for amount in divs[divs.index.to_period("M") == keys[i0 + k]]:
            cash += units * amount
            dist += units * amount
        cash -= CAPITAL * rate / 12
        withdrawn += CAPITAL * rate / 12
        if cash < 0:
            units += cash / me.iloc[i0 + k]  # sell units for the shortfall
            cash = 0.0
    value = units * me.iloc[i0 + months] + cash
    return value, min(dist, withdrawn) / withdrawn


y10 = pd.read_csv(FRED, index_col=0, parse_dates=True, na_values=".").iloc[:, 0].dropna()
print(f"10-year Treasury yield on Oct. 31, 2023: {y10.loc[:'2023-10-31'].iloc[-1]:.2f}%")

for symbol in ["TLT", "IEF", "AGG", "SCHD"]:
    close, divs = fund(symbol)
    base = close.loc[:"2025-10-16"].iloc[-1]
    last = close.loc[:AS_OF].iloc[-1]
    twelve = divs.loc["2025-10-17":AS_OF].sum()
    print(f"{symbol} to {AS_OF}: distribution yield {twelve / last * 100:.2f}%, "
          f"price {(last / base - 1) * 100:.2f}%")
    end_oct23, cover = payout(close, divs, "2023-10", 35)
    print(f"{symbol} Oct. 2023, 35 months at 5%: ${end_oct23:.2f}, "
          f"distributions paid {cover * 100:.1f}% of the withdrawals")
    starts = [p for p in month_ends(close).index if pd.Period("2002-07", "M") <= p <= pd.Period("2023-09", "M")]
    values = [payout(close, divs, str(p), 36)[0] for p in starts]
    under = sum(v < CAPITAL for v in values)
    print(f"{symbol} 36-month windows at 5%: {under} of {len(values)} ended under $100")
10-year Treasury yield on Oct. 31, 2023: 4.88%
TLT to 2026-10-16: distribution yield 4.86%, price -12.36%
TLT Oct. 2023, 35 months at 5%: $91.85, distributions paid 90.4% of the withdrawals
TLT 36-month windows at 5%: 118 of 255 ended under $100
IEF to 2026-10-16: distribution yield 4.11%, price -7.31%
IEF Oct. 2023, 35 months at 5%: $96.55, distributions paid 77.1% of the withdrawals
IEF 36-month windows at 5%: 164 of 255 ended under $100
AGG to 2026-10-16: distribution yield 4.16%, price -5.66%
AGG Oct. 2023, 35 months at 5%: $99.68, distributions paid 80.4% of the withdrawals
AGG 36-month windows at 5%: 176 of 241 ended under $100
SCHD to 2026-10-16: distribution yield 3.07%, price 29.28%
SCHD Oct. 2023, 35 months at 5%: $141.79, distributions paid 91.6% of the withdrawals
SCHD 36-month windows at 5%: 7 of 144 ended under $100Sources: FRED, 10-year Treasury constant maturity rate (DGS10) · Yahoo Finance, TLT · Yahoo Finance, IEF · Yahoo Finance, AGG · Yahoo Finance, SCHD
#research#treasury-yields#portfolio#market-data
Keep reading
cite: Julien Esnault, “A 5% payout is not a 5% return: what $100 in a bond fund left after three years”, Portfolio Terminal, 2026-10-21. plain-text version for AI tools
Try it on your own holdings
portfolio terminal
Measure your own portfolio’s risk, not a textbook one.
Import your positions from any broker and see your volatility, beta, drawdown and correlations every morning.
Wall Street in 60s, every morning. What’s in it
One short email before the open. Unsubscribe anytime.