SCHD, VYM, VIG and VTV: what four dividend ETFs share, and what each adds
Hold SCHD, VYM, VIG and VTV in equal parts and 64.6% of the money sits in companies at least three of the four hold. 99.3% of SCHD is in companies VYM holds; VIG adds the most the others lack, 28.1%. Issuer files of September 30 and October 13, 2026.

· 7 min read

Short answer: in an equal mix of SCHD, VYM, VIG and VTV, 64.6% of the money sits in companies at least three of the four hold, on issuer files of September 30 and October 13, 2026. Pair by pair, VYM and VTV are the most alike, 69.4% the same money; SCHD and VIG the least, 14.5%.
We measured all six pairs on the issuers’ full holdings files. “Same money” is the part you would own twice: for each stock both funds hold, take the smaller of its two weights, and add them up. The next two columns read one fund at a time: how much of it sits in stocks the other fund holds, at any weight.
| Pair | Stocks in both | Same money | One fund in the other’s stocks | The reverse |
|---|---|---|---|---|
| SCHD and VYM | 79 | 21.9% | 99.3% of SCHD | 21.9% of VYM |
| SCHD and VTV | 40 | 17.9% | 91.8% of SCHD | 17.9% of VTV |
| SCHD and VIG | 33 | 14.5% | 56.7% of SCHD | 14.5% of VIG |
| VYM and VTV | 194 | 69.4% | 79.8% of VYM | 69.4% of VTV |
| VYM and VIG | 209 | 60.6% | 63.3% of VYM | 63.3% of VIG |
| VIG and VTV | 120 | 51.5% | 61.6% of VIG | 51.5% of VTV |
The reverse often equals the same money: the fund with more holdings usually has the smaller weight on each stock the two share, so all of its shared weight is owned twice.
The Vanguard Value ETF (VTV), the Vanguard High Dividend Yield ETF (VYM) and the Vanguard Dividend Appreciation ETF (VIG) are read on Vanguard’s month-end files of September 30, 2026; SCHD on Schwab’s file of October 13, 13 days later.
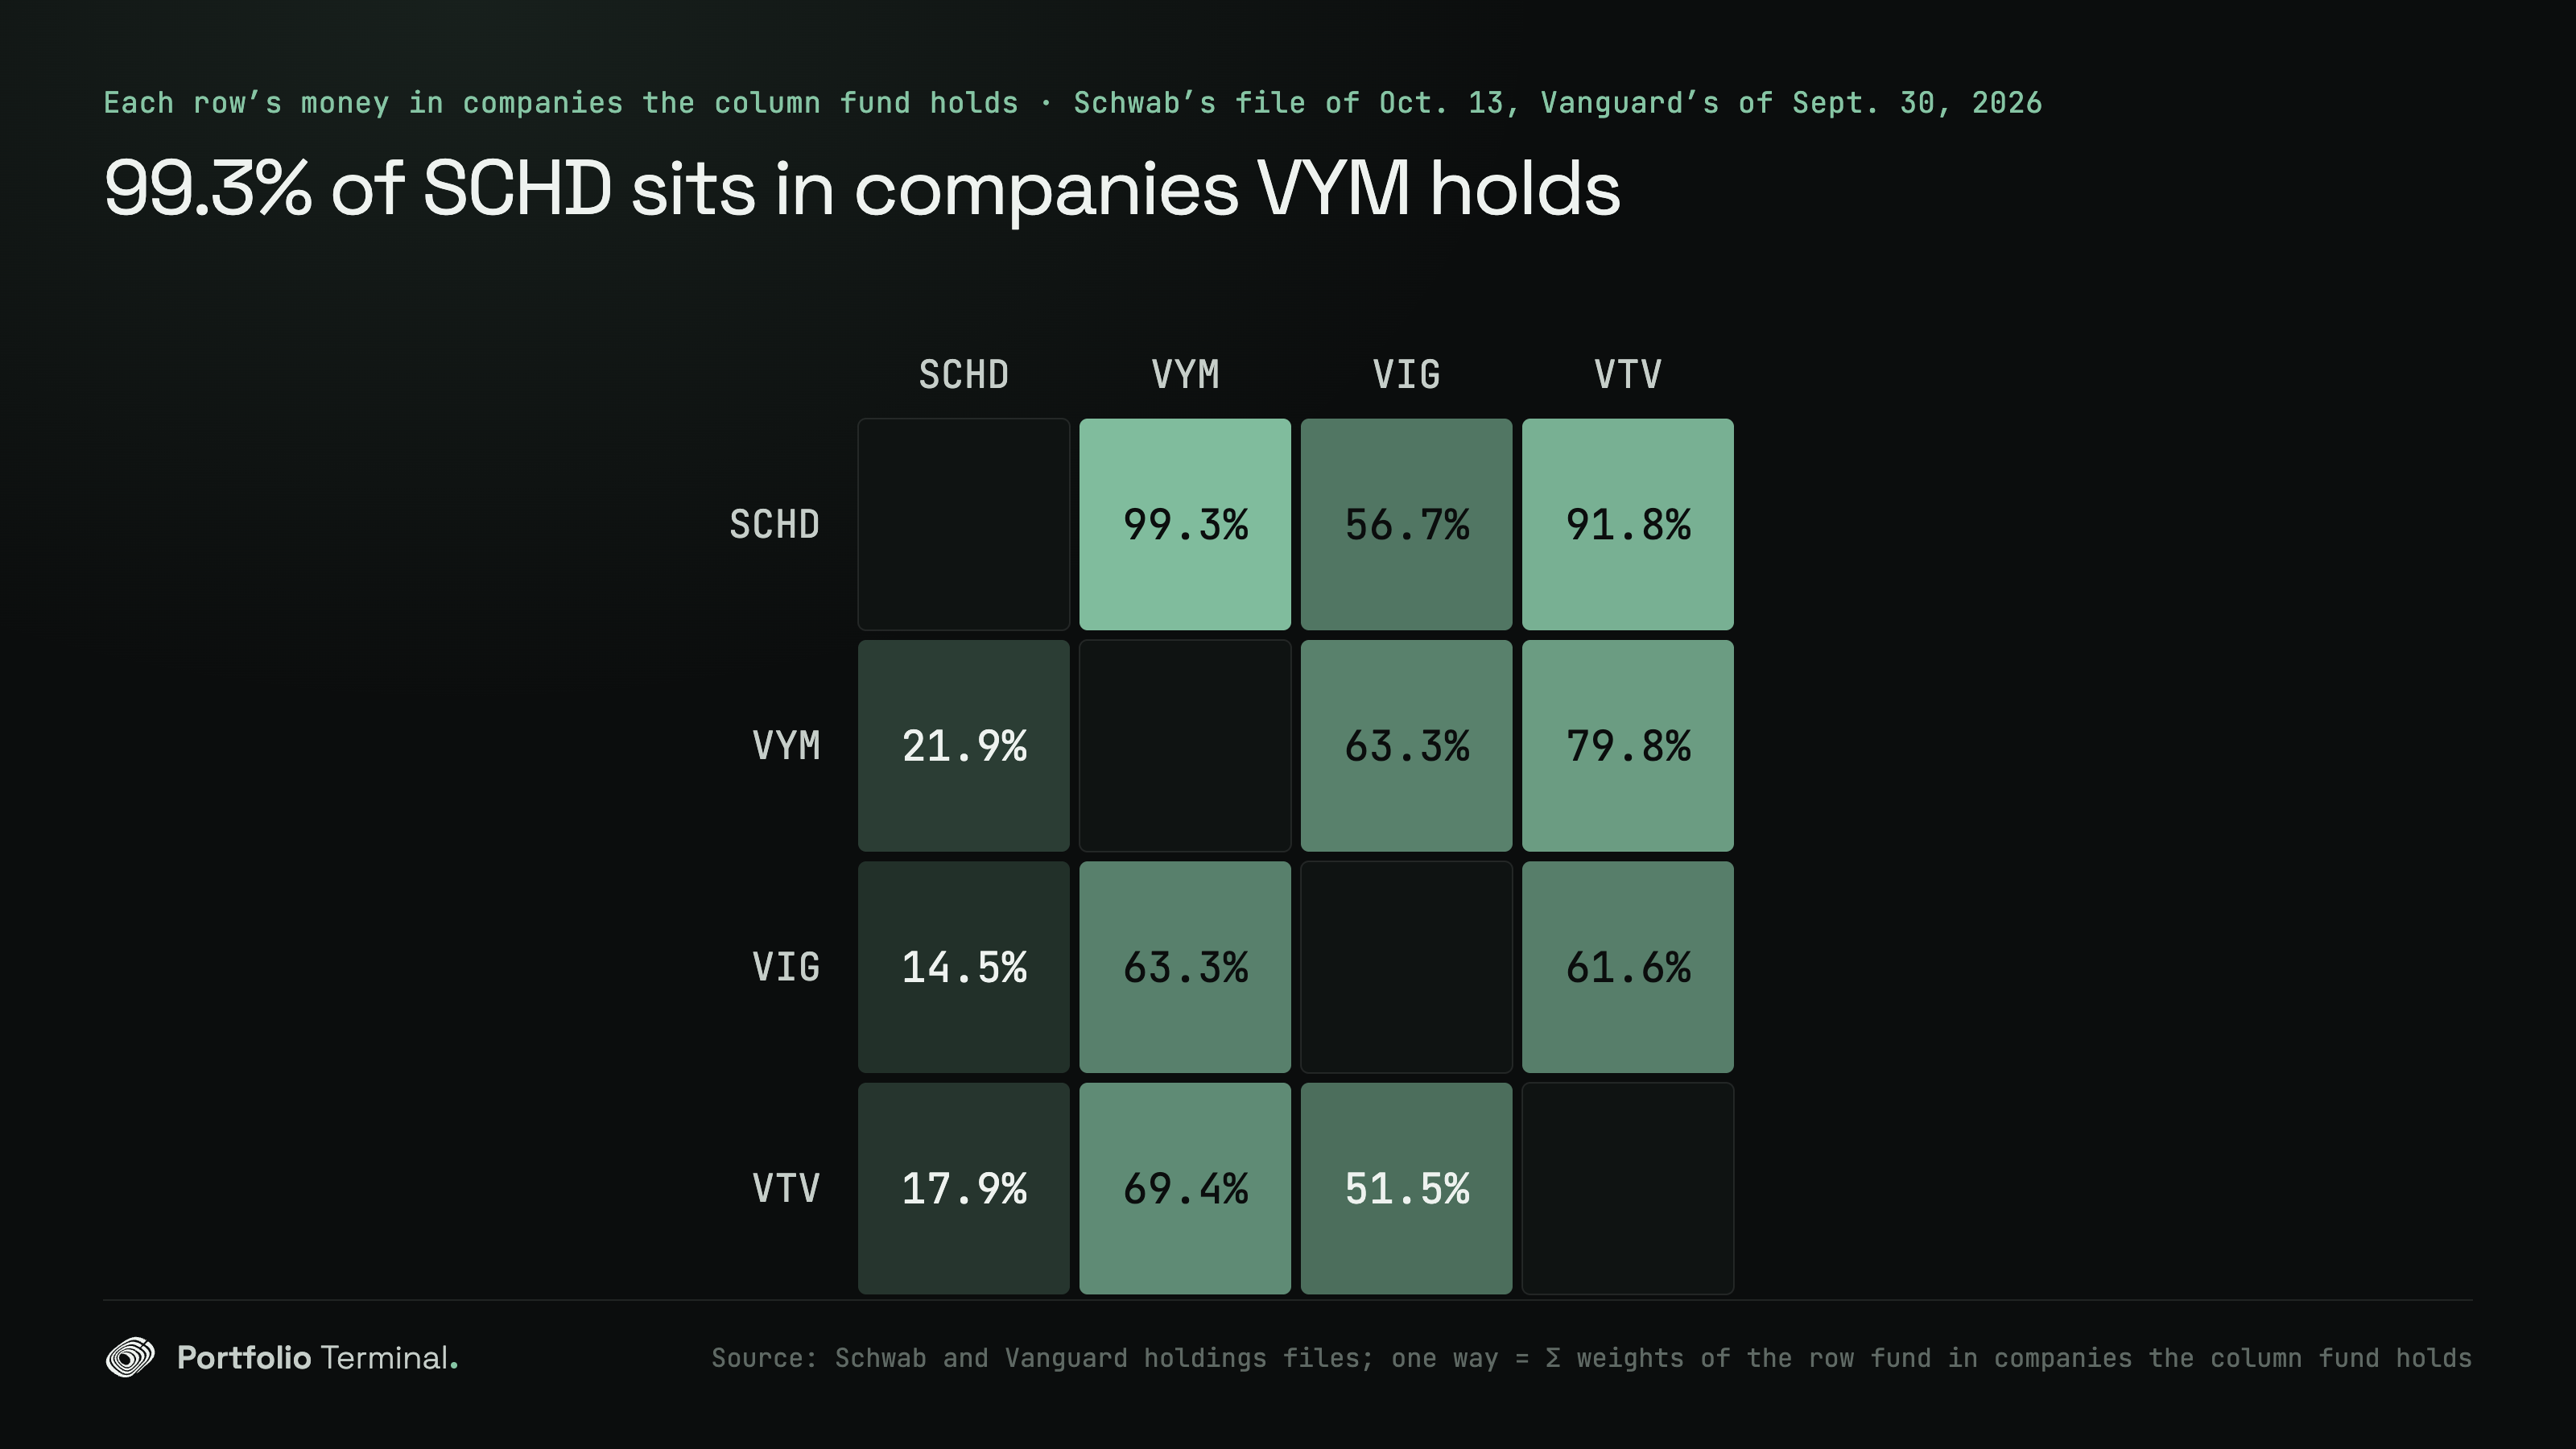
SCHD is almost all inside VYM, and still not VYM
99.3% of SCHD is in companies VYM holds, and 91.8% in companies VTV holds. Yet SCHD and VYM share 21.9% of their money. The gap is weight. SCHD holds 98 stocks and puts 41.8% in its ten largest; VYM holds 593 and puts 26.2% in its ten largest. The companies they share most:
| Company | Weight in SCHD | Weight in VYM |
|---|---|---|
| Chevron | 4.3% | 1.6% |
| Merck | 3.9% | 1.5% |
| Procter & Gamble | 4.3% | 1.4% |
A VYM holder who adds SCHD buys almost nothing VYM lacks. What changes is the weight: SCHD puts about three times VYM’s weight on the companies the two share most.
A quarter in each: 807 stocks
Put a quarter of the money in each fund and the mix holds 807 different stocks. How many of the four funds hold each one:
| Held by | Stocks | Share of the mix |
|---|---|---|
| All four | 19 | 23.1% |
| Three | 103 | 41.4% |
| Two | 252 | 20.5% |
| One | 433 | 14.8% |
The 19 stocks held by all four make 23.1%, and SCHD’s heavy weights lead them:
| Company | SCHD | VYM | VIG | VTV | In the mix |
|---|---|---|---|---|---|
| Procter & Gamble | 4.3% | 1.4% | 1.5% | 1.3% | 2.1% |
| Coca-Cola | 4.3% | 1.4% | 1.5% | 1.3% | 2.1% |
| Merck | 3.9% | 1.5% | 1.6% | 1.4% | 2.1% |
| UnitedHealth | 3.9% | 1.4% | 1.5% | 1.2% | 2.0% |
| Texas Instruments | 4.7% | 1.1% | 1.1% | 0.5% | 1.9% |
| Home Depot | 3.9% | 1.2% | 1.3% | 1.1% | 1.8% |
What each one adds that the other three don’t
| Fund | Alone | Stocks | Largest |
|---|---|---|---|
| SCHD | 0.4% | 13 | Federated Hermes 0.1%, 13 stocks in all, 10 of them financials |
| VYM | 6.9% | 252 | NXP Semiconductors 0.3%, Targa Resources 0.2% |
| VIG | 28.1% | 91 | Microsoft 4.9%, Apple 4.9%, Eli Lilly 4.1% |
| VTV | 23.7% | 77 | Micron 4.6%, Berkshire Hathaway (class B) 2.9% |
VIG and VTV are the two that change the mix. VIG holds Microsoft, Apple and Eli Lilly, dividend growers the high-yield and value funds leave out. VTV holds Micron and Berkshire Hathaway (class B), which none of the three dividend funds holds.
Each one next to VOO
Against the Vanguard S&P 500 ETF (VOO), on the same Vanguard file date:
| Fund | Overlap with VOO | In VOO’s stocks | Most over VOO | Most under VOO |
|---|---|---|---|---|
| SCHD | 7.6% | 94.9% | consumer staples +15.8, energy +13.0 | technology −27.4 |
| VYM | 33.3% | 92.5% | financials +9.6, energy +6.7 | technology −23.4 |
| VIG | 40.3% | 95.5% | financials +9.3, health care +9.3 | technology −13.1 |
| VTV | 41.1% | 98.5% | financials +11.3, health care +7.5 | technology −27.0 |
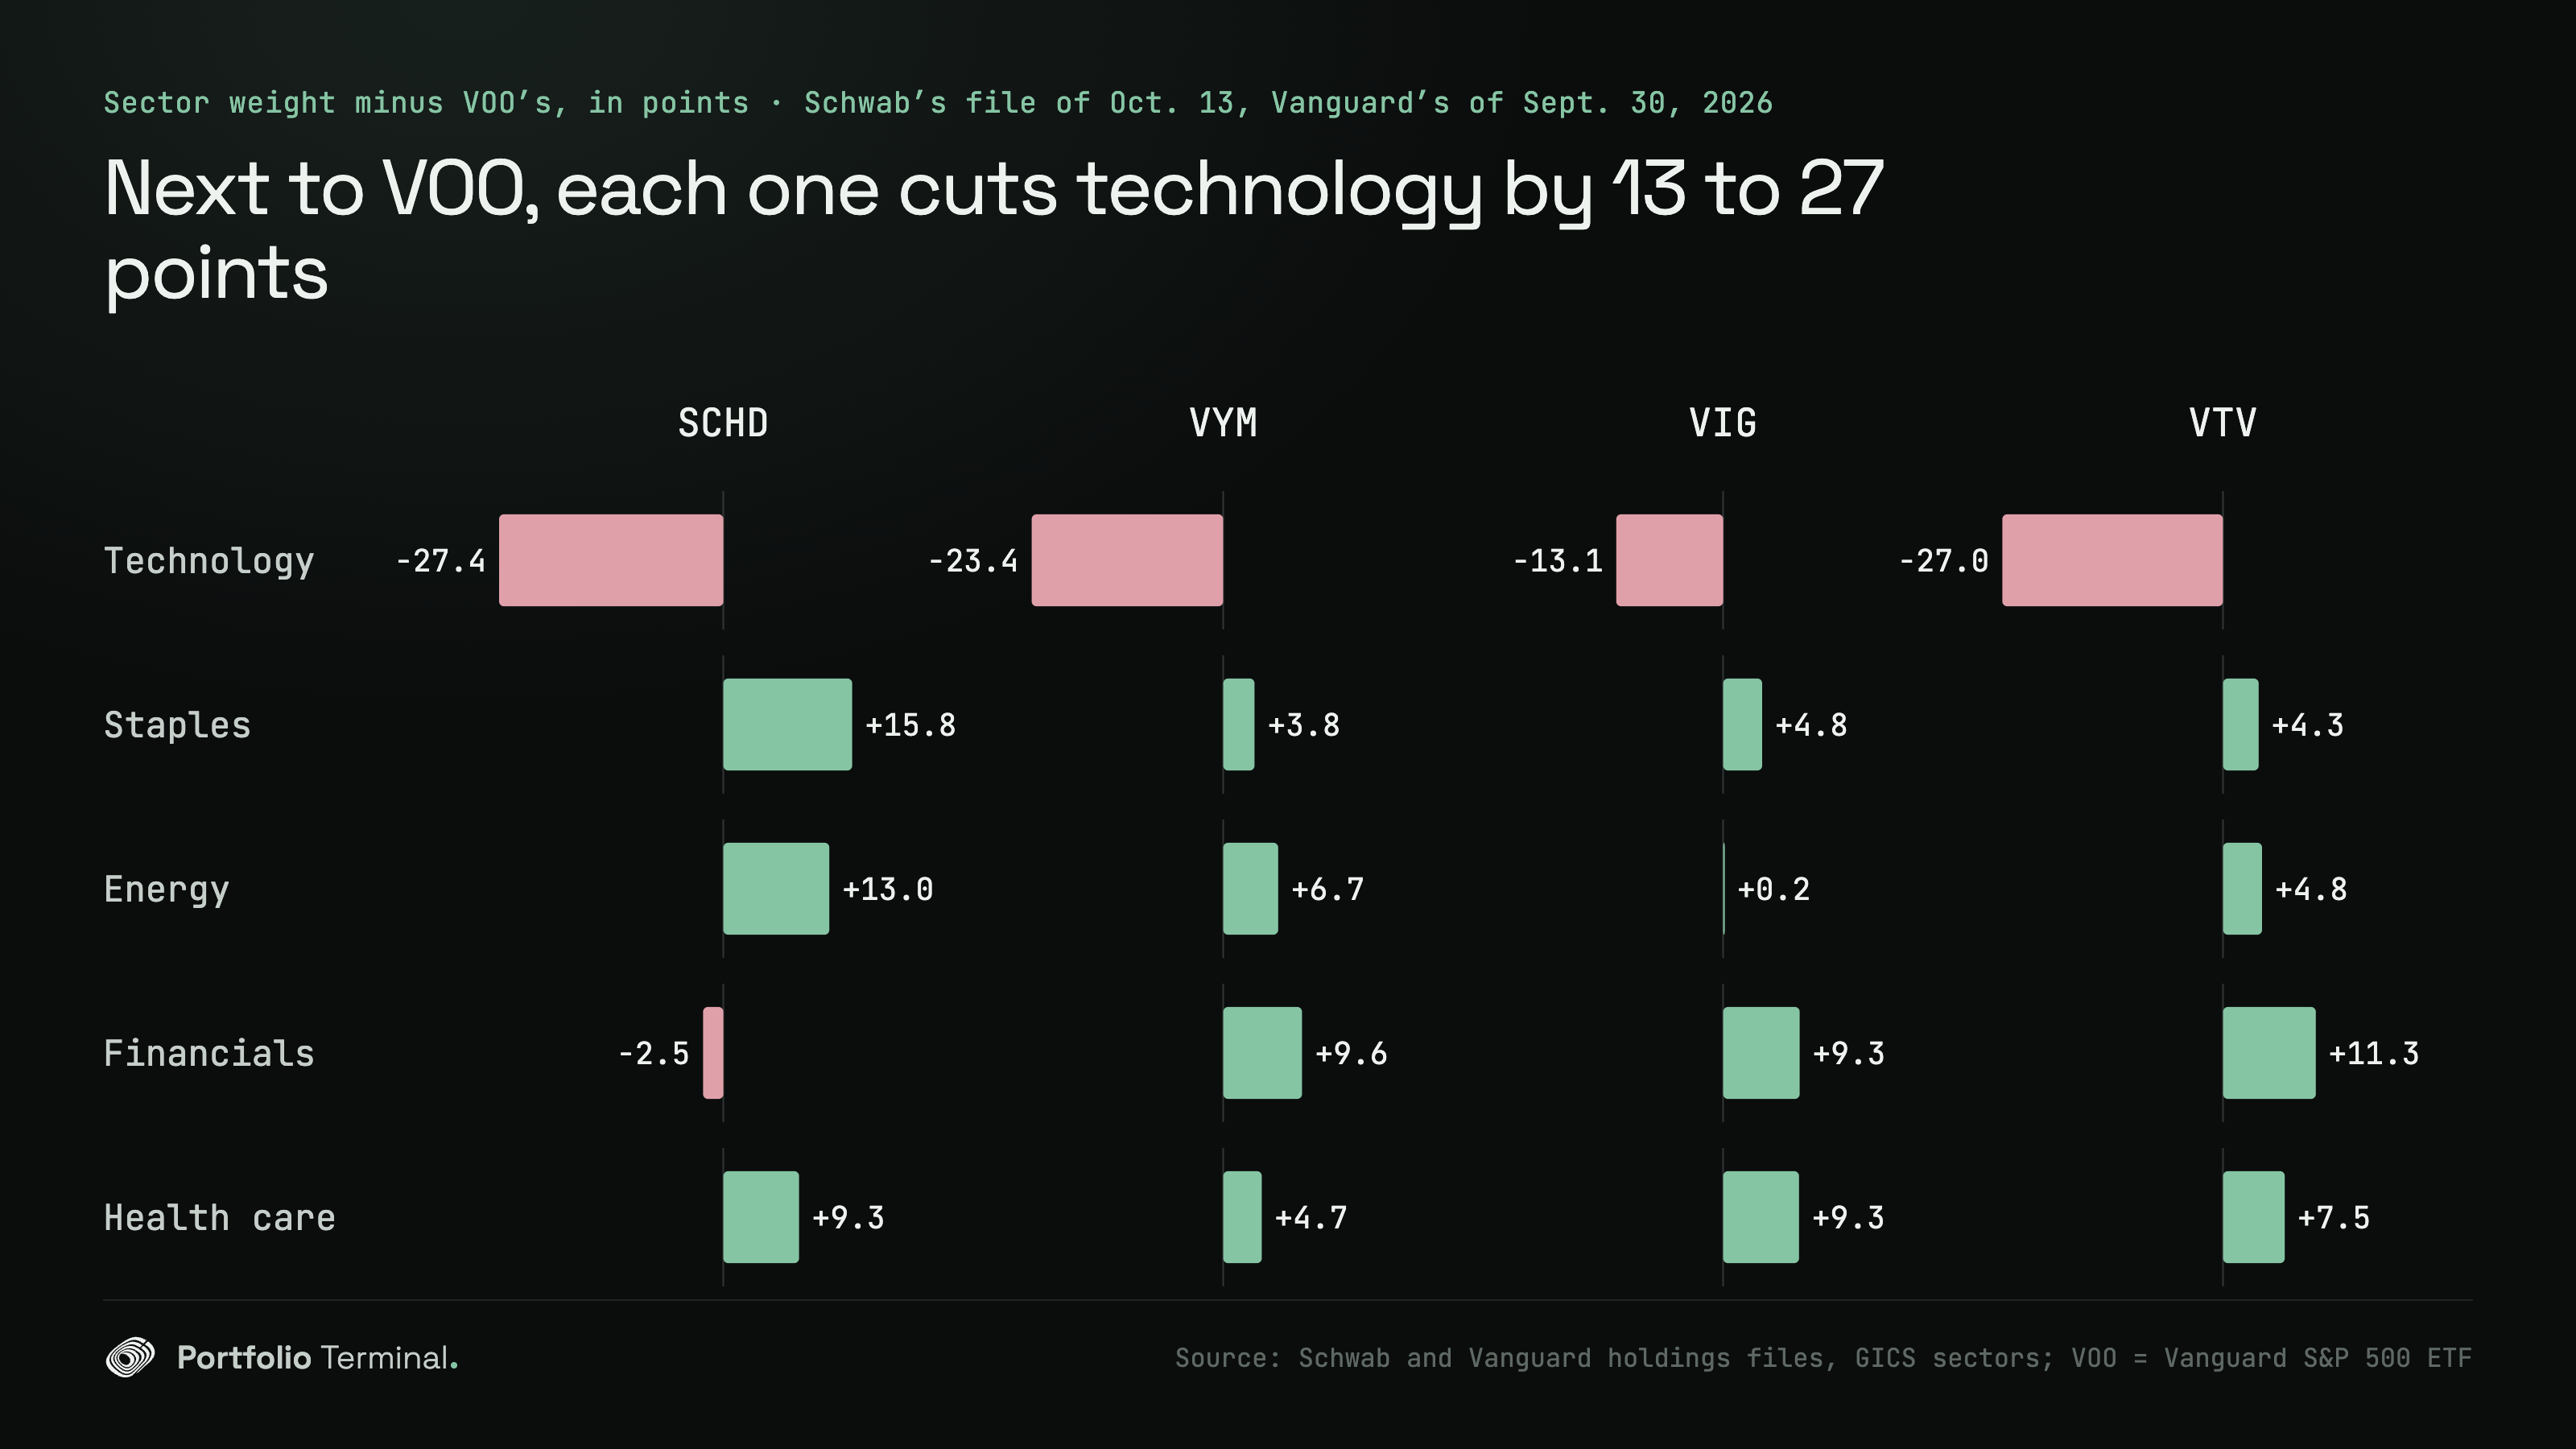
All four hold mostly S&P 500 stocks, from 92.5% of VYM to 98.5% of VTV, and all four hold much less technology than VOO. SCHD is the furthest from VOO: 7.6% of the same money, with 15.8 more points of consumer staples and 13.0 more of energy. VTV and VIG are the closest, 41.1% and 40.3%.
Check your own funds
Add the funds you hold: the checker measures every pair on the issuers’ full files, both ways.
your two most alike funds
??.?%Two funds can hold the same companies at nearly the same weights.
three funds many readers hold
If you hold VYM and VTV, 69.4% of the two is the same money; if you hold SCHD and VIG, 14.5%. Hold three or four of them, or one next to VOO? The Portfolio X-Ray adds up every company across all the funds you own.
Each pair has its own page on the ETF overlap tool, with every shared company and both file dates: SCHD and VTV, SCHD and VYM, VIG and VTV, VIG and VYM. Those pages read the site’s own copy of each file, refreshed every month and dated on the page, so their figures can differ from this study’s by the month between two files. How the overlap is measured, and why the two readings differ, is in our guide to checking ETF overlap; returns and fees of SCHD against VIG are on SCHD vs VIG. For a tech portfolio, the same measure is in VGT, SMH, QQQ, VUG: how much of your tech is the same, and how closely look-alike funds moved over a year in our study of ETF swap pairs.
How we measured
Data. The five funds’ full holdings files, as each issuer published them: Schwab’s for SCHD of October 13, 2026 (98 stocks and two cash lines); Vanguard’s month-end files for VYM (593), VIG (333), VTV (298) and VOO (505) of September 30, 2026.
Method. Overlap both ways is the sum, over companies both funds hold, of the smaller weight; weights are shares of each fund’s net assets. One way is the sum of a fund’s weights in the companies the other holds. Companies are matched on their ISIN (the 12-character security code), or one derived from the CUSIP. The mix holds a quarter of each fund. Sectors are the GICS sectors in the files.
Limits.
- SCHD’s file is 13 days newer than Vanguard’s: Vanguard posts month-end holdings only.
- Cash, futures and other lines that are not stocks are left out: at most 0.5% of a fund (VIG). Schwab’s file lists SCHD’s cash as two lines, a money market fund and US dollars; they count as cash here.
- Overlap says what you own twice, not how two funds move together, and nothing here measures dividend yield or fees.
What would change the result: Vanguard’s next month-end files, the reviews of the funds’ indexes, and the weights of the largest companies, which move with their prices.
Reproduce it
reproduce.py reads the five files exactly as we measured them, published with this article (each row carries its fund’s file date and issuer source), measures the six pairs, the mix and each fund against VOO, then checks our VTV file against the one the site serves for VTV. We ran it on November 13, 2026, on this article’s files before publication: every figure matched.
Show the code
# Reproduces https://portfolio-terminal.com/blog/schd-vym-vig-vtv-dividend-etf-overlap
# pip install requests
# Reads the five funds' holdings as we measured them (one dated issuer file per fund, its source on
# its rows), measures the six pairs both ways, a quarter in each fund, what each holds alone and
# each against VOO, then checks our VTV file against the one the site serves on its VTV page.
import csv, os, requests

SITE = os.environ.get("SITE", "https://portfolio-terminal.com")
UA = {"User-Agent": "Mozilla/5.0 (Macintosh; Intel Mac OS X 10_15_7) AppleWebKit/537.36 Chrome/128.0.0.0 Safari/537.36"}
FUNDS = "SCHD VYM VIG VTV".split()


def get(path):
    lines = requests.get(SITE + path, headers=UA, timeout=60).text.splitlines()
    return [line for line in lines if not line.startswith("#")]


W, DATE, NAME = {f: {} for f in FUNDS + ["VOO"]}, {}, {}
for row in csv.DictReader(get("/blog-sources/dividend-etf-overlap-holdings.csv")):
    f, i = row["fund"], row["isin_or_id"]
    W[f][i] = W[f].get(i, 0.0) + float(row["weight_pct"]) / 100
    DATE[f], NAME[i] = row["file_date"], row["ticker"] or row["name"]

pct = lambda v: f"{v * 100:.1f}%"
print("files: " + " ".join(f"{f} {DATE[f]}" for f in FUNDS + ["VOO"]))
for x, a in enumerate(FUNDS):
    for b in FUNDS[x + 1:]:
        both = W[a].keys() & W[b].keys()
        o = sum(min(W[a][i], W[b][i]) for i in both)
        a_in_b, b_in_a = sum(W[a][i] for i in both), sum(W[b][i] for i in both)
        print(f"{a}/{b}: overlap {pct(o)}, {a} in {b}'s companies {pct(a_in_b)}, {b} in {a}'s {pct(b_in_a)}, {len(both)} in both")

# A quarter in each fund: every company once, with how many of the four hold it.
mix, held = {}, {}
for f in FUNDS:
    for i, w in W[f].items():
        mix[i] = mix.get(i, 0.0) + w / 4
        held[i] = held.get(i, 0) + 1
tiers = {k: [i for i in mix if held[i] == k] for k in (4, 3, 2, 1)}
print(f"a quarter in each: {len(mix)} stocks; " + ", ".join(f"held by {k}: {len(ids)} stocks, {pct(sum(mix[i] for i in ids))}" for k, ids in tiers.items()))
print(f"in companies at least three hold: {pct(sum(mix[i] for i in tiers[4] + tiers[3]))}")

for f in FUNDS:
    others = set().union(*(W[g].keys() for g in FUNDS if g != f))
    alone = sorted(((w, i) for i, w in W[f].items() if i not in others), reverse=True)
    print(f"{f} alone: {pct(sum(w for w, _ in alone))} in {len(alone)} stocks, first " + ", ".join(f"{NAME[i]} {pct(w)}" for w, i in alone[:2]))

for f in FUNDS:
    both = W[f].keys() & W["VOO"].keys()
    print(f"{f} and VOO: overlap {pct(sum(min(W[f][i], W['VOO'][i]) for i in both))}, {f} in VOO's companies {pct(sum(W[f][i] for i in both))}")

# Our VTV file against the site's VTV page, the same Vanguard file of September 30, 2026.
served = {}
for row in csv.DictReader(get("/etf/vtv/holdings.csv")):
    served[row["isin_or_id"]] = served.get(row["isin_or_id"], 0.0) + float(row["weight_pct"]) / 100
gap = max(abs(served.get(i, 0.0) - W["VTV"].get(i, 0.0)) for i in served.keys() | W["VTV"].keys())
print(f"VTV on the site: {len(served)} lines, ours {len(W['VTV'])}, largest weight gap {gap * 100:.3f} points (the site rounds weights to 4 decimals)")
files: SCHD 2026-10-13 VYM 2026-09-30 VIG 2026-09-30 VTV 2026-09-30 VOO 2026-09-30
SCHD/VYM: overlap 21.9%, SCHD in VYM's companies 99.3%, VYM in SCHD's 21.9%, 79 in both
SCHD/VIG: overlap 14.5%, SCHD in VIG's companies 56.7%, VIG in SCHD's 14.5%, 33 in both
SCHD/VTV: overlap 17.9%, SCHD in VTV's companies 91.8%, VTV in SCHD's 17.9%, 40 in both
VYM/VIG: overlap 60.6%, VYM in VIG's companies 63.3%, VIG in VYM's 63.3%, 209 in both
VYM/VTV: overlap 69.4%, VYM in VTV's companies 79.8%, VTV in VYM's 69.4%, 194 in both
VIG/VTV: overlap 51.5%, VIG in VTV's companies 61.6%, VTV in VIG's 51.5%, 120 in both
a quarter in each: 807 stocks; held by 4: 19 stocks, 23.1%, held by 3: 103 stocks, 41.4%, held by 2: 252 stocks, 20.5%, held by 1: 433 stocks, 14.8%
in companies at least three hold: 64.6%
SCHD alone: 0.4% in 13 stocks, first FHI 0.1%, AGM 0.1%
VYM alone: 6.9% in 252 stocks, first NXPI 0.3%, TRGP 0.2%
VIG alone: 28.1% in 91 stocks, first MSFT 4.9%, AAPL 4.9%
VTV alone: 23.7% in 77 stocks, first MU 4.6%, BRK-B 2.9%
SCHD and VOO: overlap 7.6%, SCHD in VOO's companies 94.9%
VYM and VOO: overlap 33.3%, VYM in VOO's companies 92.5%
VIG and VOO: overlap 40.3%, VIG in VOO's companies 95.5%
VTV and VOO: overlap 41.1%, VTV in VOO's companies 98.5%
VTV on the site: 298 lines, ours 298, largest weight gap 0.000 points (the site rounds weights to 4 decimals)Sources: Schwab, SCHD holdings · Vanguard, VYM holdings · Vanguard, VIG holdings · Vanguard, VTV holdings · Vanguard, VOO holdings
#research#etfs#dividends
Keep reading
cite: Julien Esnault, “SCHD, VYM, VIG and VTV: what four dividend ETFs share, and what each adds”, Portfolio Terminal, 2026-11-16. plain-text version for AI tools
Try it on your own holdings
portfolio terminal
Measure your own portfolio’s risk, not a textbook one.
Import your positions from any broker and see your volatility, beta, drawdown and correlations every morning.
The week on Wall Street in 60s, once a week. What’s in it
One short email a week, after Friday’s close. Unsubscribe anytime.