Nasdaq-100 ETFs and tech: what overlaps, UCITS included
On iShares’ files of October 16, 2026, 98.2% of the Nasdaq 100 UCITS ETF (CNDX) sits in companies the MSCI World ETF (IWDA) holds, and the two share 39.3% of their money. At 70/30, the Magnificent 7 rise from 24.5% to 28.8% and technology from 30.0% to 38.2%.

· 7 min read

Short answer: 98.2% of the iShares Nasdaq 100 UCITS ETF (CNDX) sits in companies the iShares Core MSCI World UCITS ETF (IWDA) already holds (files of October 16, 2026): the same companies, not the same weights. At 70% world and 30% Nasdaq-100, the Magnificent 7 (Apple, Microsoft, Nvidia, Amazon, Alphabet, Meta, Tesla) go from 24.5% to 28.8%.
In a PEA, world and Nasdaq-100 ETFs are swap funds on the same two indexes: read IWDA and CNDX here as your MSCI World and your Nasdaq-100 (why, further down). Each pair is read two ways. The same money, both ways, is what the two funds hold in common, at the smaller weight. Inside the other, one way, is the share of one fund in companies the other holds.
| CNDX against | Companies in both | Same money, both ways | CNDX inside the other | The other inside CNDX’s companies |
|---|---|---|---|---|
| IWDA, MSCI World | 97 | 39.3% | 98.2% | 39.3% |
| VWCE, FTSE All-World | 98 | 34.8% | 98.5% | 34.8% |
| SSAC, MSCI ACWI | 98 | 34.7% | 98.5% | 34.7% |
| CSPX, S&P 500 | 86 | 54.2% | 93.0% | 54.2% |
| VUAA, S&P 500 | 86 | 55.5% | 93.0% | 55.8% |
Read the IWDA row both ways: 39.3% of the world fund is the Nasdaq-100’s companies, and the Nasdaq-100 is almost entirely inside the world fund. The 39.3% shows twice because IWDA holds every shared company at a smaller weight than CNDX does. The method is in how to check ETF overlap.
A world ETF plus a Nasdaq-100: what the split changes
Since CNDX adds almost no company, the split decides everything. We weighted IWDA’s and CNDX’s files at every split from 100/0 to 50/50, five points at a time, and measured each mix like a fund:
| IWDA / CNDX | Magnificent 7 | Information technology | Ten largest lines | Same money as IWDA alone |
|---|---|---|---|---|
| 100/0 | 24.5% | 30.0% | 27.3% | 99.5% |
| 90/10 | 26.0% | 32.8% | 29.1% | 93.5% |
| 80/20 | 27.4% | 35.5% | 31.0% | 87.5% |
| 70/30 | 28.8% | 38.2% | 32.9% | 81.5% |
| 60/40 | 30.3% | 40.9% | 34.9% | 75.4% |
| 50/50 | 31.7% | 43.7% | 36.8% | 69.4% |
At 70/30, the Magnificent 7 rise from 24.5% to 28.8% of the money, and information technology from 30.0% to 38.2%. The mix is still 81.5% the same money as IWDA alone; IWDA alone reads 99.5%, not 100%, because 0.5% of it is cash and derivatives, which no overlap counts. CNDX on its own has 38.9% in the seven and 57.3% in technology. The 70/30 split comes up on French savers’ forums, for instance Finary’s community.
What the 30% buys: Micron, AMD and Nvidia
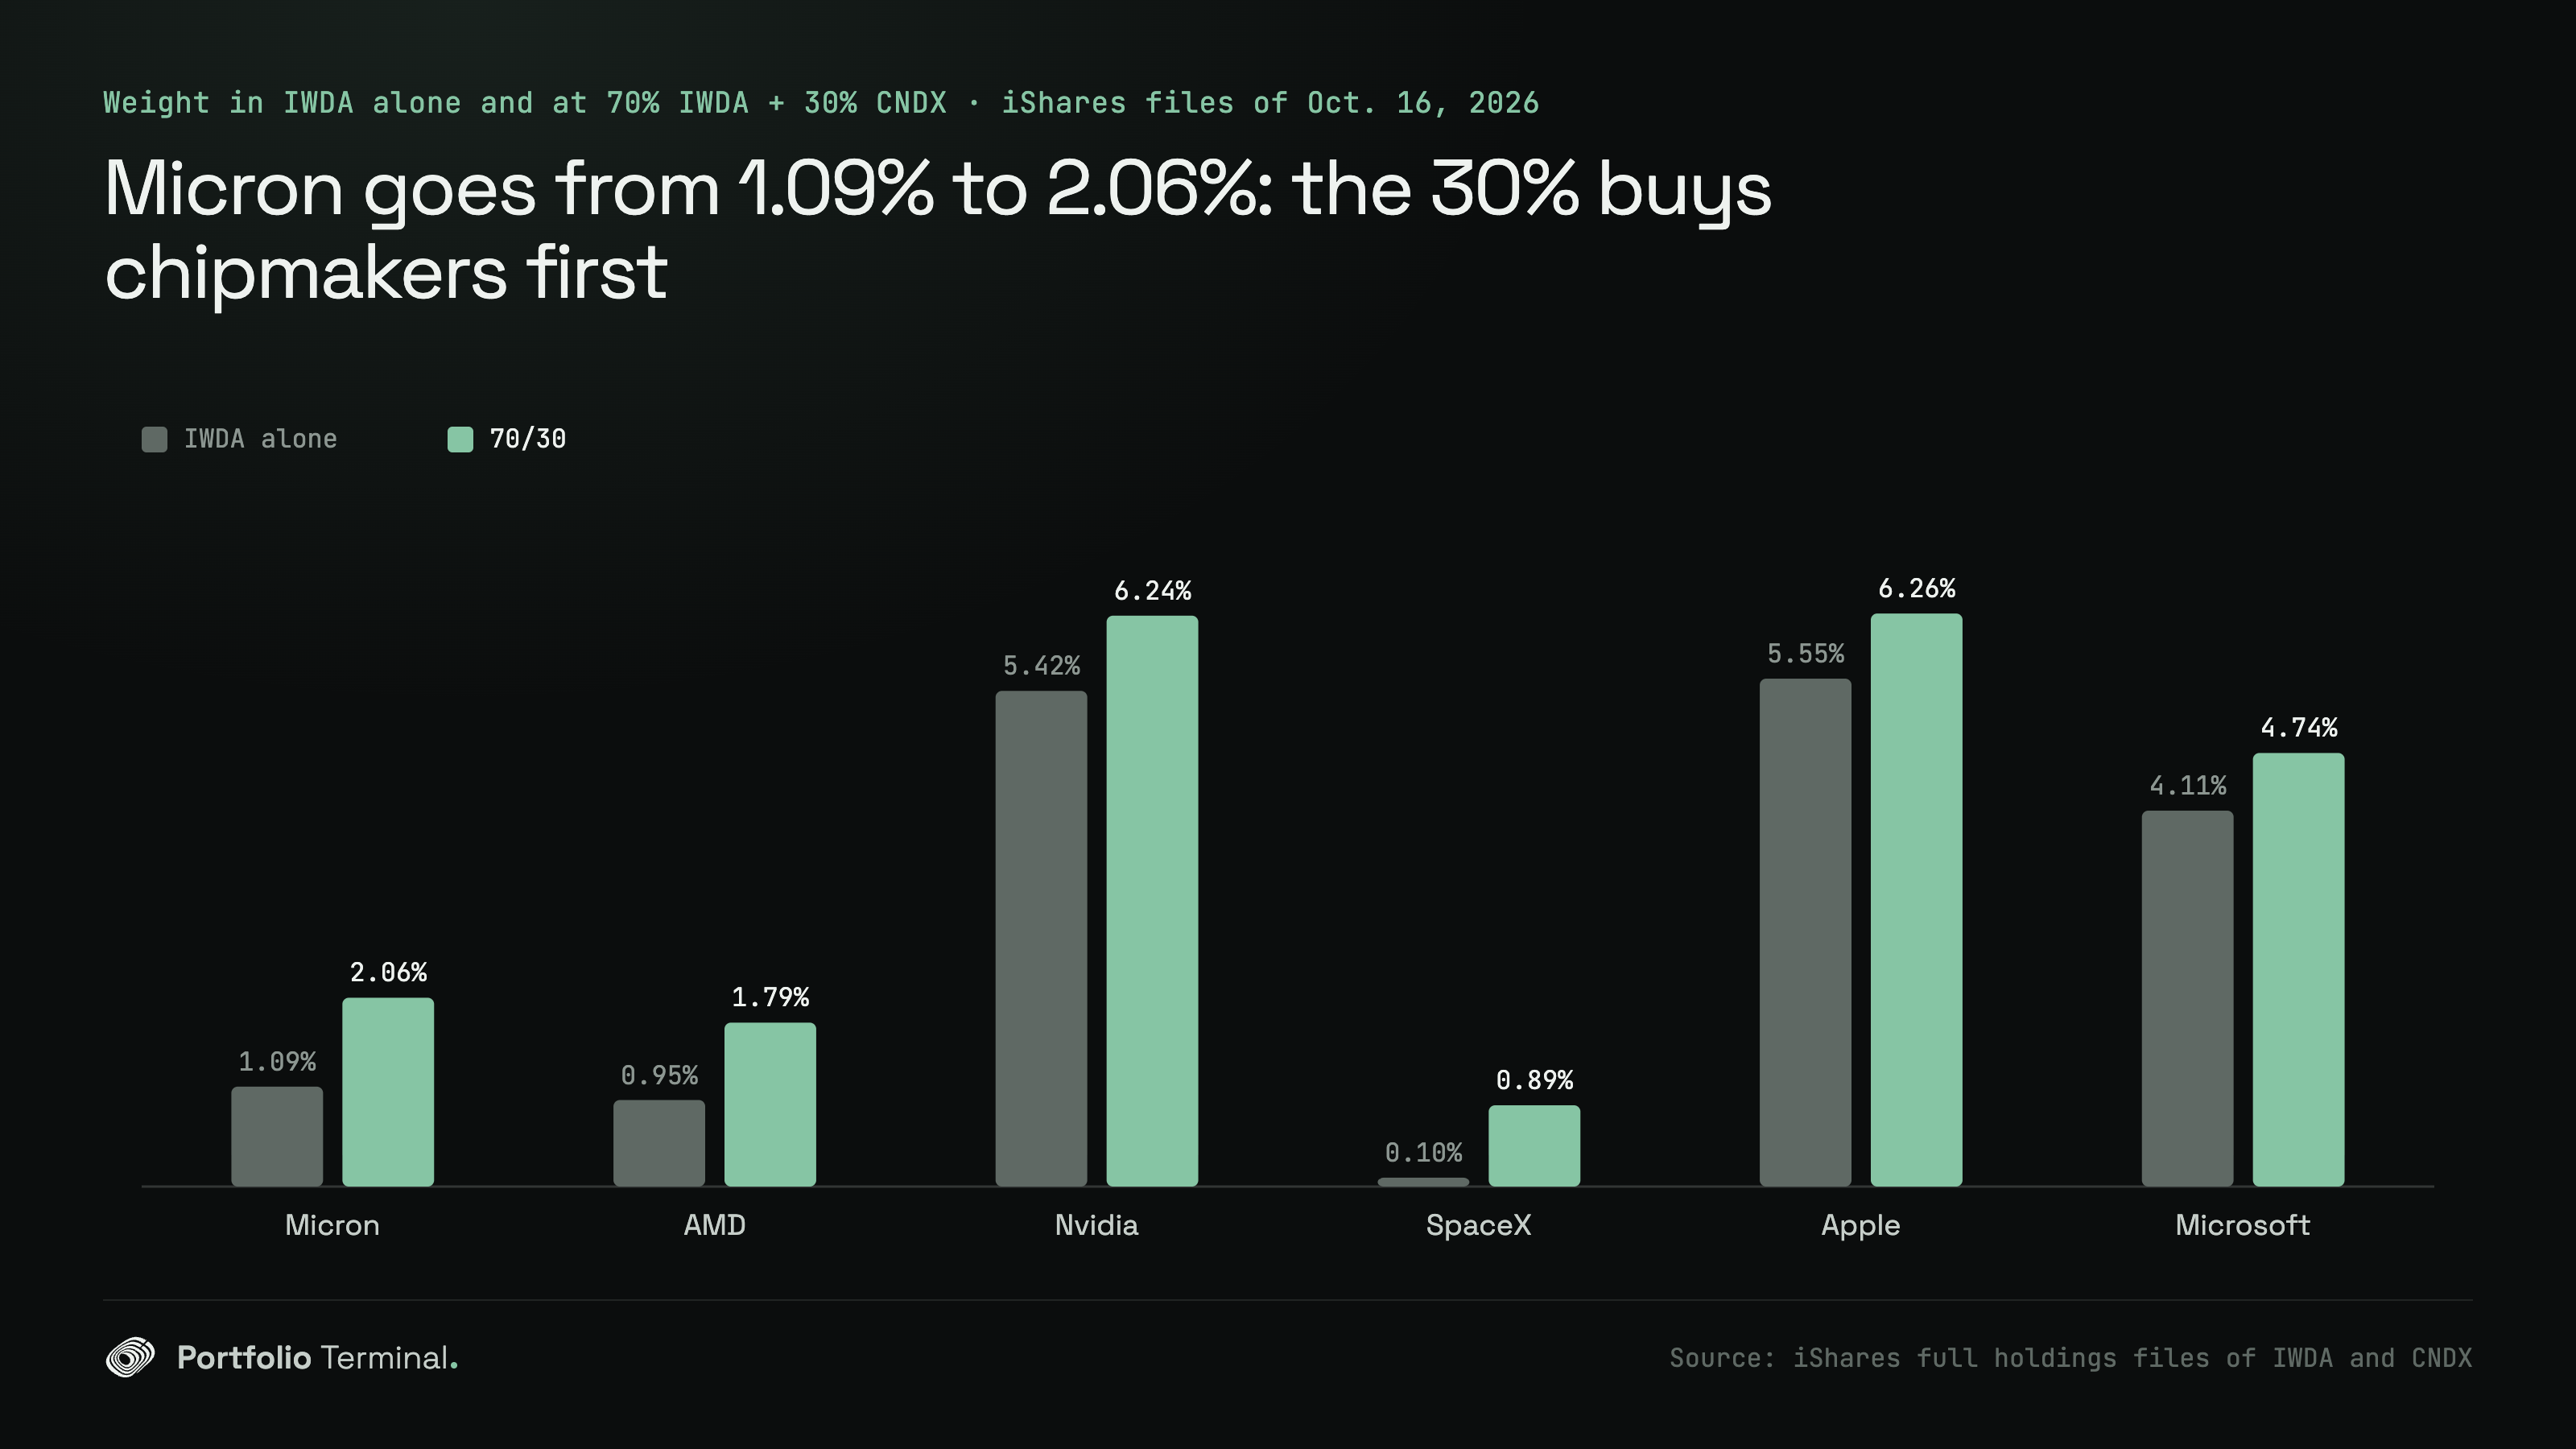
The six companies whose weight rises most at 70/30, against IWDA alone:
| Company | In IWDA alone | In CNDX | At 70/30 |
|---|---|---|---|
| Micron Technology | 1.09% | 4.33% | 2.06% |
| Advanced Micro Devices (AMD) | 0.95% | 3.77% | 1.79% |
| Nvidia | 5.42% | 8.16% | 6.24% |
| SpaceX | 0.10% | 2.74% | 0.89% |
| Apple | 5.55% | 7.93% | 6.26% |
| Microsoft | 4.11% | 6.21% | 4.74% |
The largest gains go to chipmakers: Micron nearly doubles, from 1.09% to 2.06%. SpaceX weighs 2.74% of CNDX and 0.10% of IWDA, 28 times more: the two index families don’t weight it the same way. The money comes from everything else: the companies outside the Nasdaq-100, 60.3% of IWDA, fall to 42.2% of the mix.
The four lines a world ETF lacks
Only 4 of CNDX’s 101 lines are not in IWDA, 1.7% of the fund:
- ASML, 0.67% of CNDX, is not really missing. CNDX holds its US depositary receipts; IWDA holds its Amsterdam shares (0.71% of IWDA). Counted as one company, 98.9% of CNDX sits in companies IWDA holds.
- Arm Holdings (0.43%) and Moderna (0.38%) are in neither world fund’s file.
- PDD Holdings (0.24%) is a Chinese company: IWDA leaves out the emerging markets, VWCE and SSAC hold it.
Next to an S&P 500 ETF: CSPX or VUAA
CSPX (iShares) and VUAA (Vanguard) hold the same S&P 500, and against CNDX they read the same: 86 companies in common, 93.0% of CNDX inside. The 15 lines outside the index make 6.9% of CNDX: SpaceX 2.74%, Shopify 0.90%, ASML 0.67%, Arm Holdings 0.43%, MercadoLibre 0.41%, then smaller ones such as Nebius and CoreWeave.
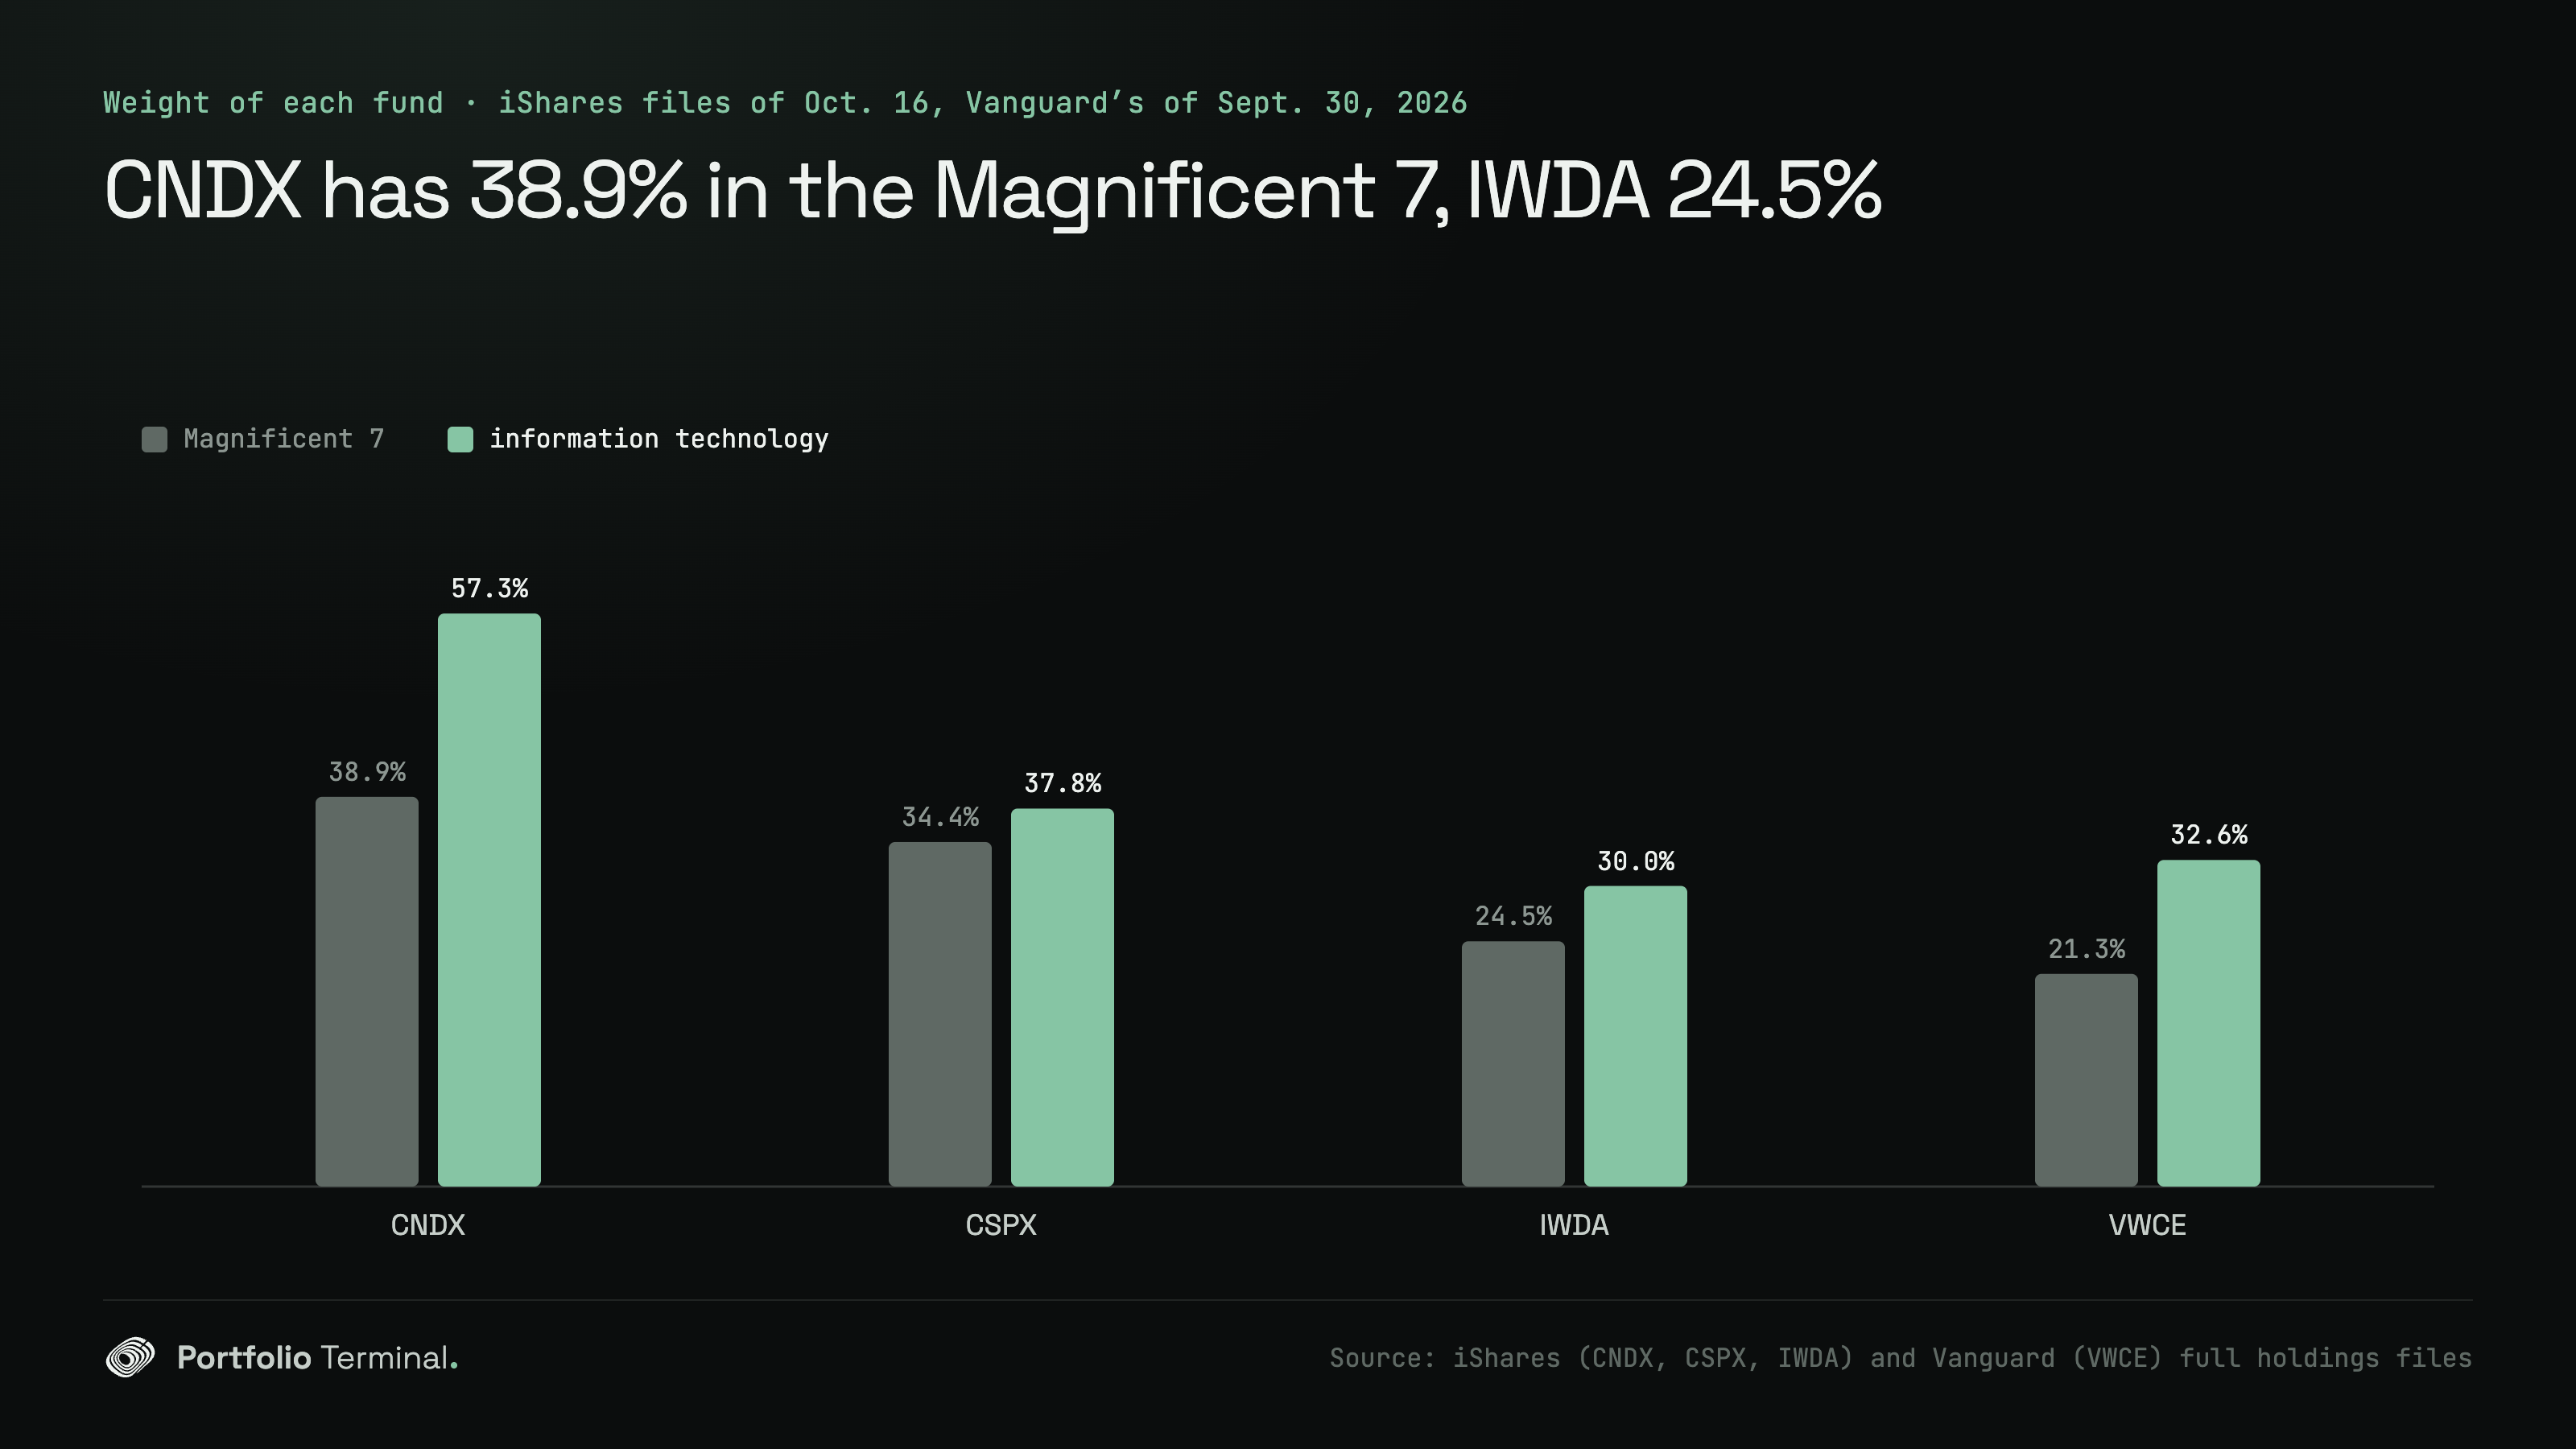
Next to CSPX, CNDX moves the weights less: at 70/30, the seven go from 34.4% to 35.8% of CSPX’s money, and technology from 37.8% to 43.6%.
In a PEA, and under another ticker
A PEA can’t hold CNDX. The Nasdaq-100 and MSCI World ETFs sold for it are swap funds: they hold a basket of other stocks and exchange its return for the index’s (how they work, on the PEA world ETFs). Their own file lists the basket, so we draw no figure from it. Read them as their index: the Nasdaq-100 that CNDX holds, the MSCI World that IWDA holds. CNDX’s file is the index: it overlaps Invesco’s QQQ 99.5%, on files of October 16 and 18, 2026. Other Nasdaq-100 UCITS ETFs track the same index; we have no file of theirs, so they get no figure here. QQQ itself, like the other US funds of our VGT, SMH, QQQ and VUG study, is not offered to retail investors in the EU without a key information document (PRIIPs regulation, (EU) No 1286/2014).
Your broker may show CNDX under another ticker. The same fund (ISIN IE00B53SZB19) trades as SXRV on Xetra and CSNDX in Milan, in euros, and as CNX1 in London, in pounds. Compare the ISIN, the fund’s 12-character code, not the ticker.
Check your own funds
Add the funds you hold: each pair is measured on the same full files, both ways and one way.
your two most alike funds
??.?%Two funds can hold the same companies at nearly the same weights.
three funds many readers hold
Every pair above has its own page on the ETF overlap tool, with the companies in common and both file dates. For the whole portfolio, the portfolio X-ray adds up each company across all your funds, and you can import your positions from a Trade Republic screenshot, or from Boursorama or DEGIRO. Read next: ETF overlap on IWDA, VWCE and EIMI and is my portfolio diversified?
Where the figures come from
Data. The full holdings files the issuers published, as the site serves them: CNDX (iShares, October 16, 2026, 101 lines), IWDA (1,248 lines), CSPX (503 lines) and SSAC (1,640 lines), all iShares of the same day; VWCE (3,795 lines) and VUAA (503 lines), Vanguard, September 30, 2026; QQQ (Invesco, October 18, 2026, 101 lines).
Method. Overlap both ways is the sum, over the companies both funds hold, of the smaller weight; weights are shares of each fund’s net assets. One way is the sum of one fund’s weights in the companies the other holds. Companies are matched by ISIN. A mix is the two files weighted by the split: 70/30 is 70% of each IWDA weight plus 30% of each CNDX weight, measured like a fund. The Magnificent 7 count both Alphabet share classes; information technology is the sector each issuer gives each line.
Limits.
- One company, two lines: ASML’s receipts and its Amsterdam shares have two ISINs, so the overlap counts them apart; the figure with ASML counted once is given next to it.
- Vanguard’s files (VWCE, VUAA) are 16 days older than iShares’; the IWDA, CSPX and SSAC pairs are on files of the same day.
- Sectors are the issuers’: Amazon, Alphabet, Meta and Tesla are not information technology, so the technology figure is lower than the seven’s weight would suggest.
- Cash, futures and other lines outside the stock lines count in no overlap.
- This page describes what the funds hold; it is not investment advice.
What would change the result: newer files, which move the weights, and the PEA swap funds, which have no holdings file here.
Sources: iShares, CNDX holdings · iShares, IWDA holdings · iShares, CSPX holdings · iShares, SSAC holdings · Vanguard, VWCE holdings · Vanguard, VUAA holdings · Invesco, QQQ holdings · EUR-Lex, PRIIPs regulation
#etfs#diversification
Keep reading
cite: Julien Esnault, “Nasdaq-100 ETFs and tech: what overlaps, UCITS included”, Portfolio Terminal, 2026-11-12. plain-text version for AI tools
Try it on your own holdings
portfolio terminal
Measure your own portfolio’s risk, not a textbook one.
Import your positions from any broker and see your volatility, beta, drawdown and correlations every morning.
The week on Wall Street in 60s, once a week. What’s in it
One short email a week, after Friday’s close. Unsubscribe anytime.