How Russia, Saudi Arabia and oil move your portfolio — and whether gold protects it
Drones shut Saudi Arabia’s Hormuz bypass and Putin warned Europe of war in the same week. How an oil shock reaches your stocks, why Europe feels it first, what gold really did last time, and a replay you can run on your own holdings.

· 9 min read
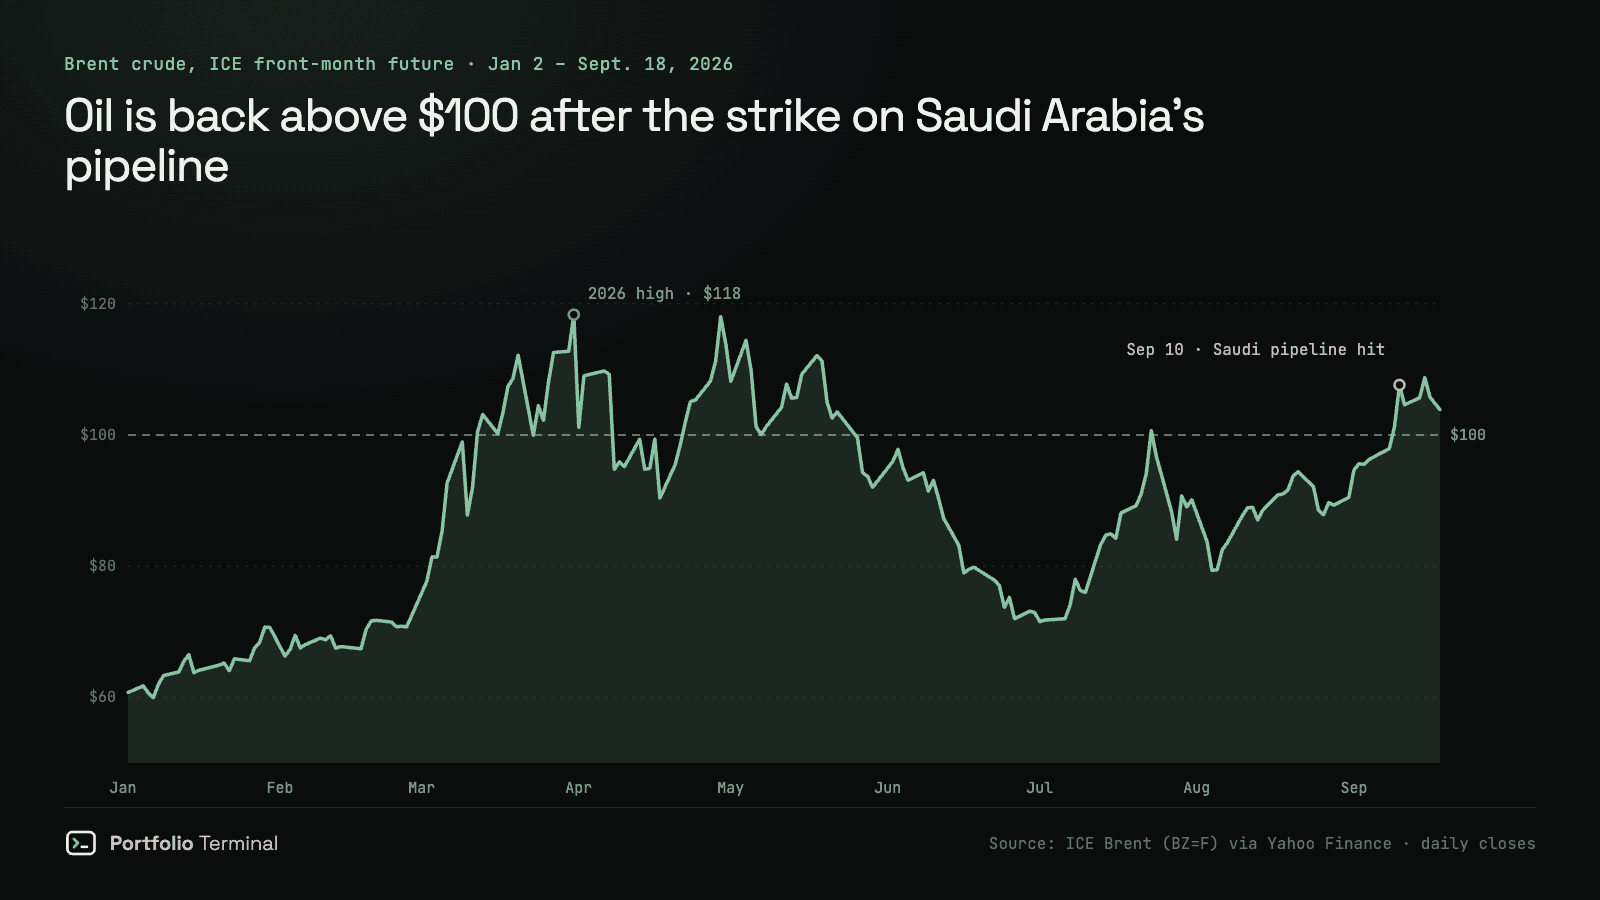
In the same week, drones knocked out the pipeline Saudi Arabia had been using to get its oil around the Strait of Hormuz, and Vladimir Putin told Europe that sending troops to Ukraine "would mean war with Russia." Brent crude futures closed the week of September 11 at $104.61, up 8.7%, after crossing back above $100 on September 9 for the first time since late July.
This guide explains how shocks like these travel into an ordinary portfolio, why Europe usually feels them first, and what gold actually did the last few times. Halfway down, you can replay each shock on your own holdings.
What happened this week
- Thursday, Sept. 10: drones launched from Iraq’s Maysan province hit pumping stations on Saudi Arabia’s East-West pipeline, in the Riyadh and Medina regions. The line runs 1,200 km from the Gulf coast to the Red Sea port of Yanbu and can carry up to 7 million barrels a day. With tanker traffic through Hormuz disrupted since the 2026 Iran war, it had been moving roughly 4 to 5 million.
- Friday, Sept. 11: Saudi Arabia shut the pipeline as a precaution. Two regional officials told the AP on Monday that repairs could take three to five weeks.
- Monday, Sept. 14: Putin said Moscow was "not threatening European countries," then warned that European troops in Ukraine, which European governments have discussed as a peacekeeping force after a ceasefire, "would mean war with Russia."
- Wednesday, Sept. 16: the Fed raised rates for the first time since 2023, after energy pushed inflation back up.
Brent futures jumped 6.3% on September 10, to $107.63, peaked at $108.75 on September 15 and closed the week of September 18 at $103.87.
Where the oil goes now
Most of Saudi Arabia’s crude used to leave through the Strait of Hormuz. With that route disrupted, the East-West pipeline became the kingdom’s main way out, which is why a strike on two pumping stations could move the global price.
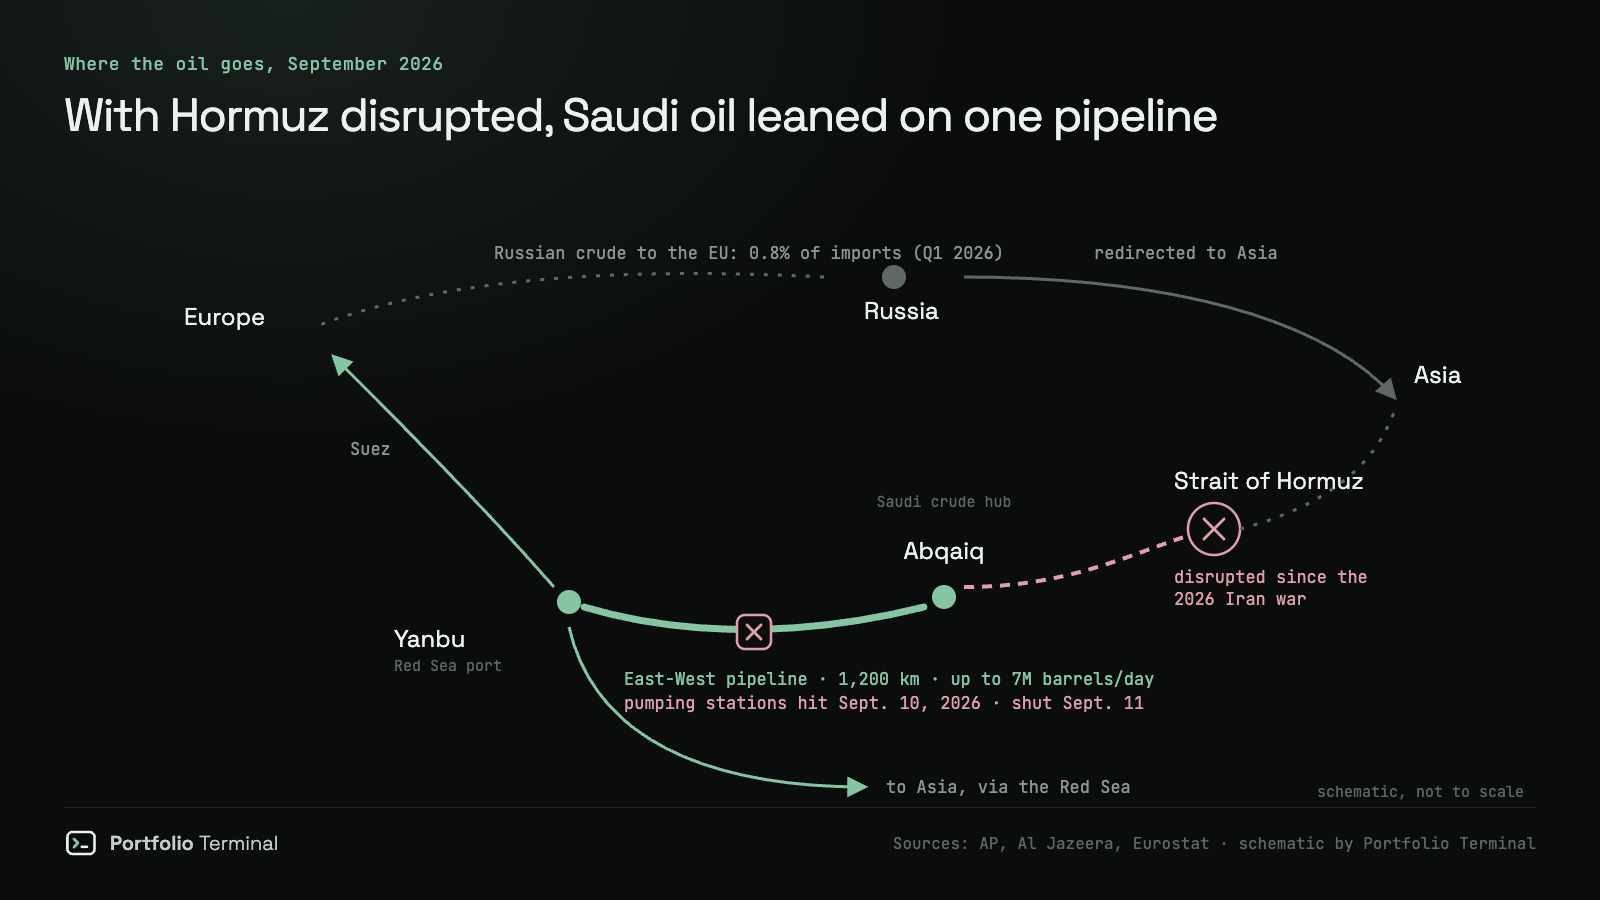
Russia matters differently. Since the EU’s embargo, Russian crude has almost vanished from Europe’s imports: 0.8% of the EU’s petroleum imports in the first quarter of 2026, according to Eurostat. Russia still supplied 17.3% of the EU’s liquefied natural gas in that quarter. So when Putin threatens Europe, the risk to your portfolio runs less through barrels than through confidence: European stocks, the euro, defense budgets and gas prices.
How an oil shock reaches your portfolio
An oil price spike doesn’t hit everything the same way. It travels through three channels.
- Costs. Companies that burn a lot of fuel see their margins squeezed. From February 23 to March 8, 2022, as Brent climbed after the invasion of Ukraine, Delta Air Lines fell 22.3%.
- Inflation, then interest rates. Energy feeds straight into consumer prices. That is what happened this summer: US inflation reached 3.4% in August, driven by energy, and the Fed responded with a hike. Higher rates weigh on bonds and on growth stocks whose value sits far in the future.
- Winners. Oil producers earn more on every barrel. Over the same two weeks in 2022, Exxon Mobil rose 14.3%.
So the same shock can leave one portfolio down and another up. What matters is the mix: how much energy you own, how much depends on cheap fuel, and how much is sensitive to rates.
Three oil shocks, three different endings
The first day of an oil shock tells you surprisingly little about how it ends.
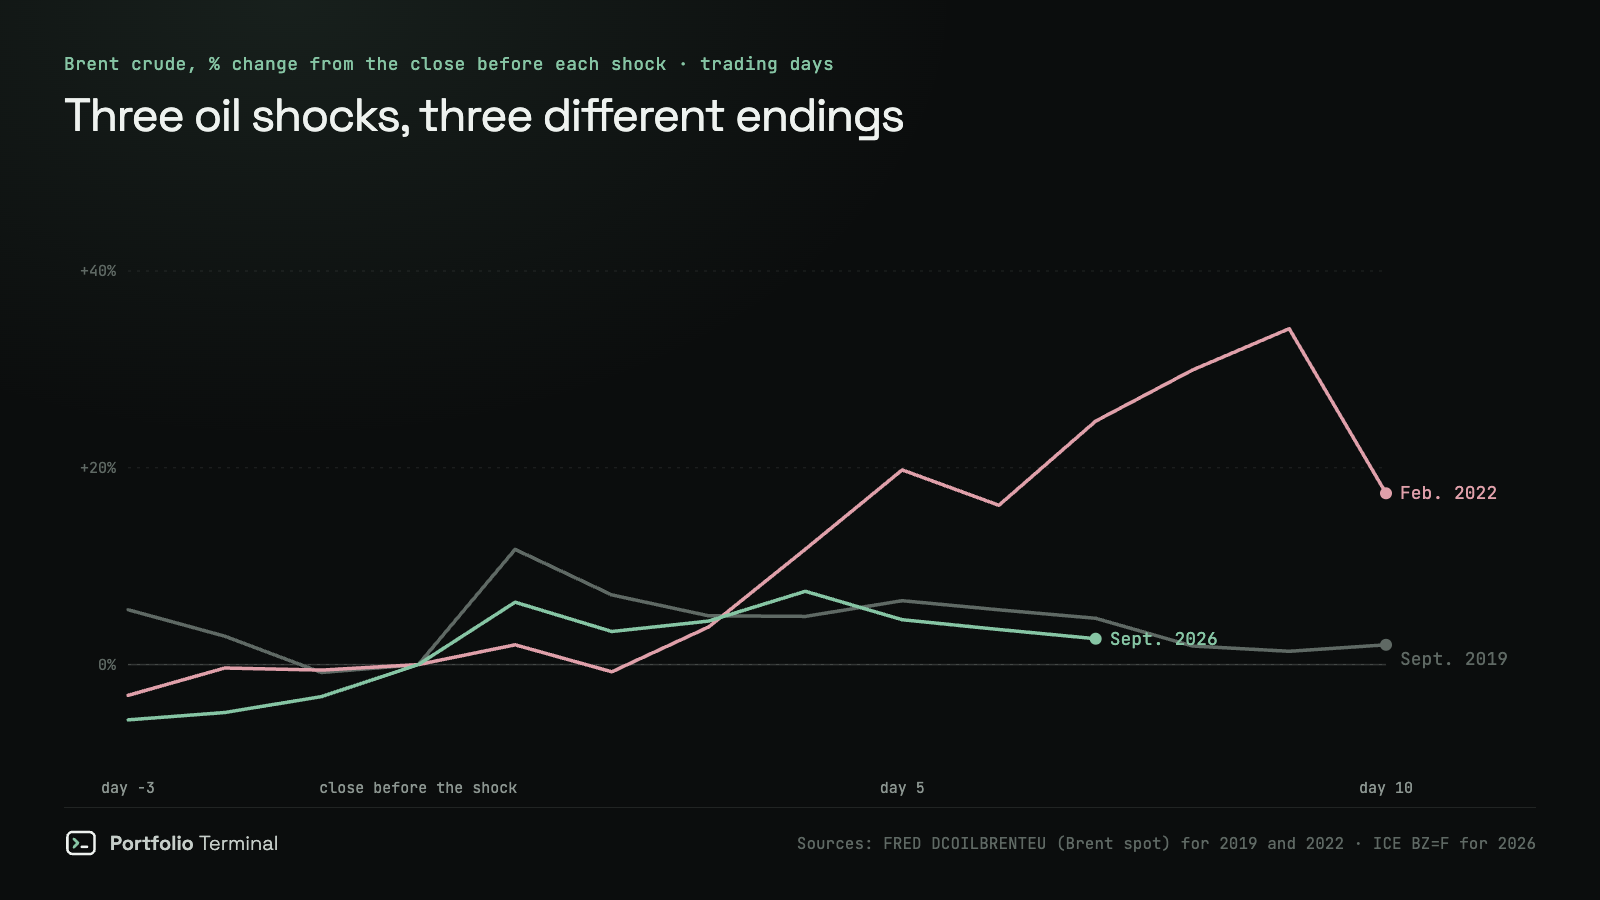
- Abqaiq, September 2019. Drones and missiles hit Saudi Arabia’s biggest processing plant. Brent spot jumped 11.7% on the first trading day, the biggest move of the three. Ten trading days later it was up only 2.0%.
- The invasion of Ukraine, February 2022. Day one looked calm: +2.0%. Then sanctions and supply fears built day after day, and by March 8 Brent spot was up 34.1%, at $133.18.
- The pipeline strike, September 2026. Brent futures rose 6.3% on day one and peaked at +7.4% on September 15. By September 18 the gain had shrunk to 2.6%.
The difference is duration. A shock that removes supply for weeks fades. One that rewires trade for years keeps going.
Replay these shocks on your portfolio
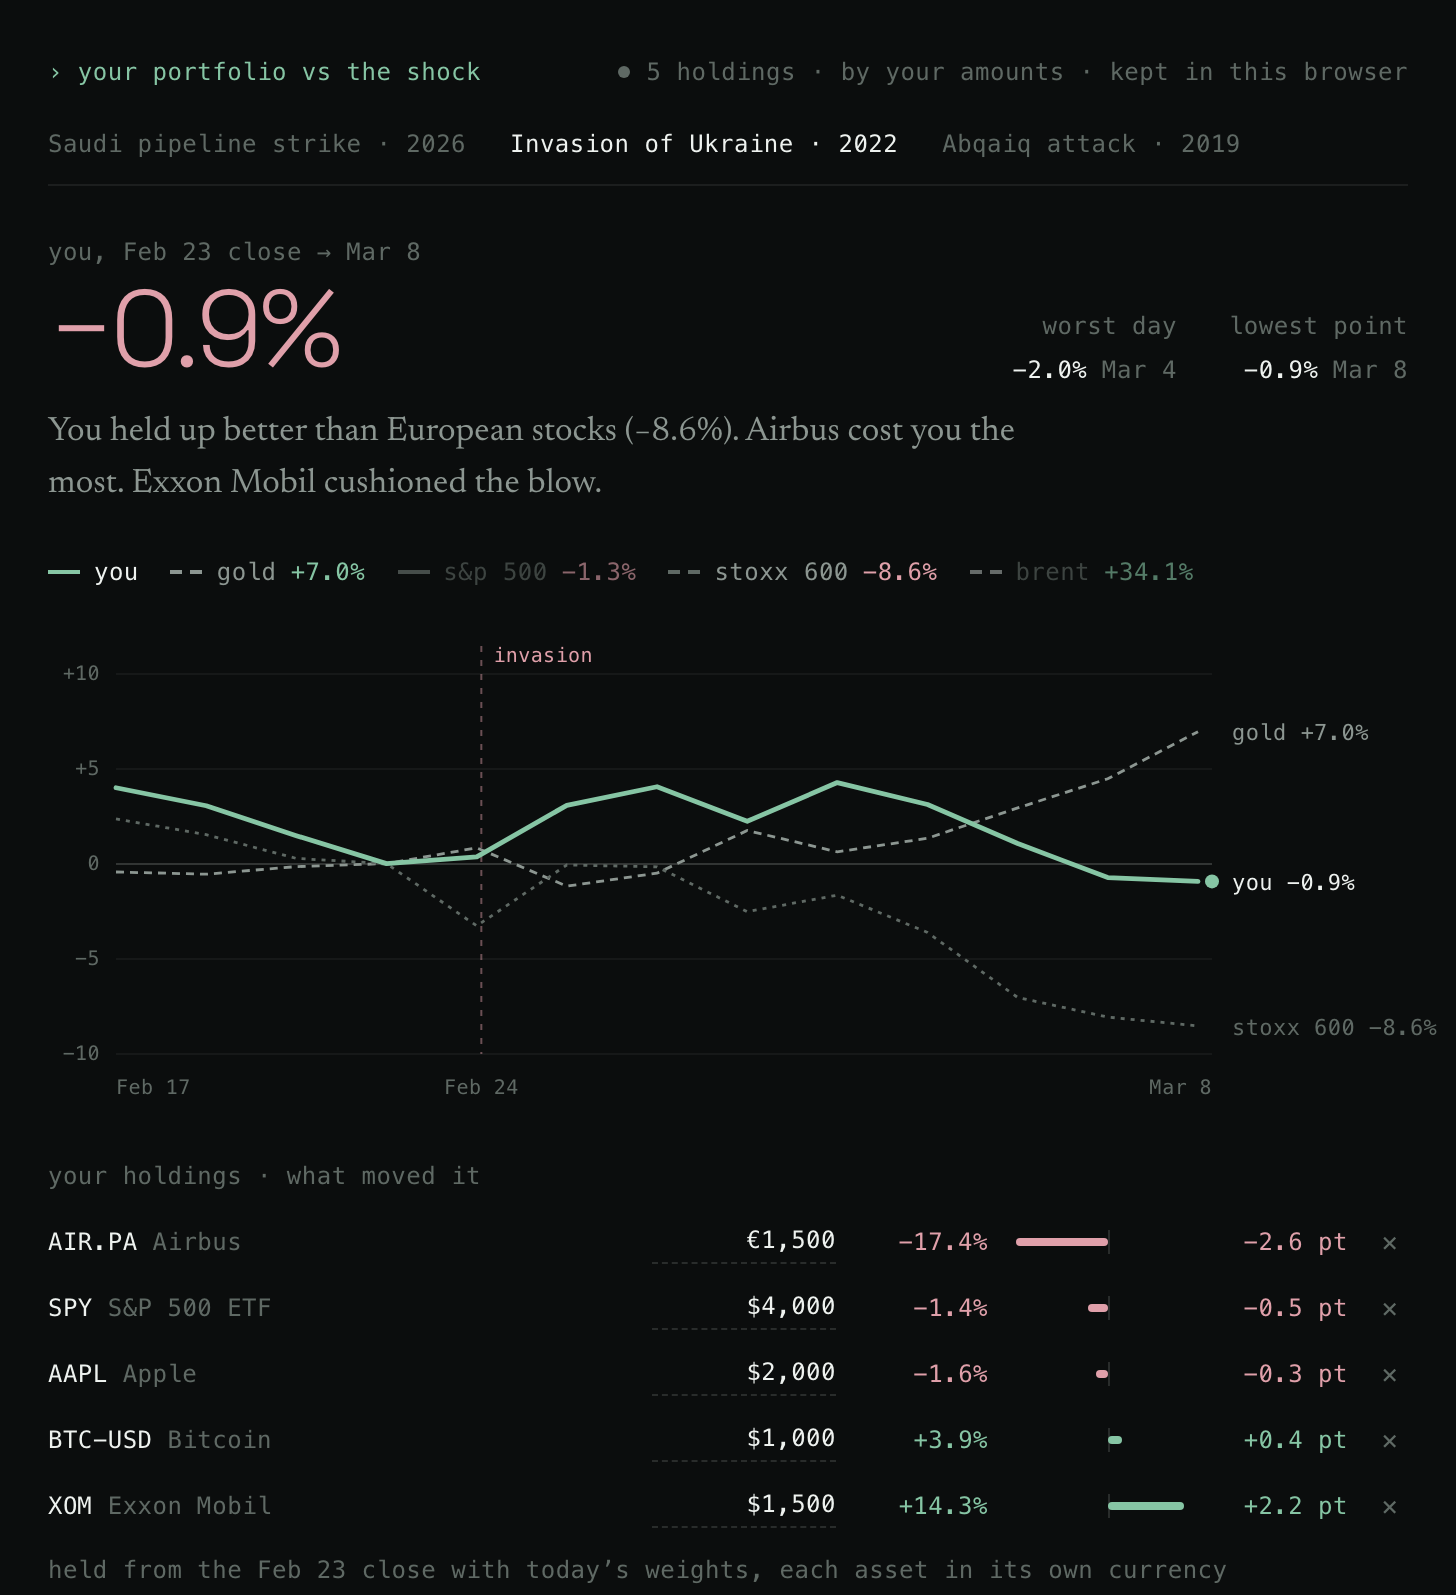
The replay below uses the same three windows. Add what you own, even roughly, and it shows what each shock would have done to today’s mix, day by day, next to gold and the stock markets.
you, Sep 9 close → Sep 18
−?.?%worst day
−0.0%
lowest point
−0.0%
You held up better than European stocks. One holding cost you the most, another cushioned the blow.
what moved it
Why Europe feels it first
Europe produces little oil of its own and was next door to the war. When Russia invaded, its stock market took the first hit.
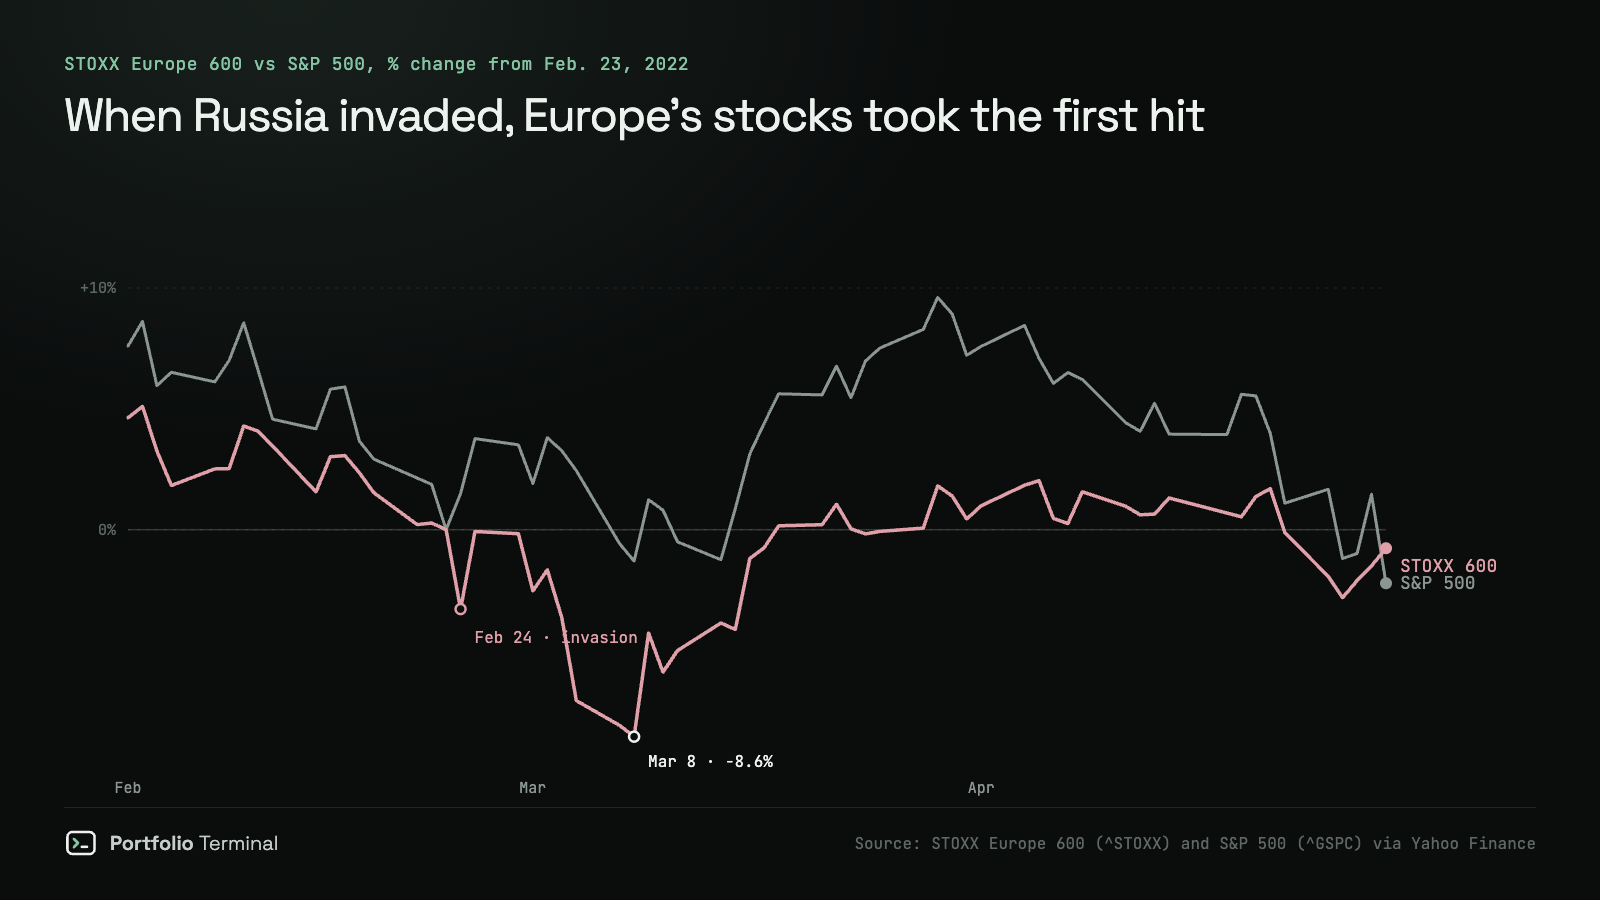
From February 23 to March 8, 2022, the STOXX Europe 600 fell 8.6%, while the S&P 500 fell 1.3%. The gap didn’t last: by April 29, the STOXX 600 was down 0.8% and the S&P 500 down 2.2%, as US stocks slid in April.
The lesson for a portfolio: the market closest to the shock tends to move first and hardest, but not necessarily for longest. In 2022, the STOXX 600’s lowest close of that spring came on March 8, two weeks after the invasion.
Does gold protect you?
Gold is the classic crisis asset, and it often does rise on bad news. The question is for how long.
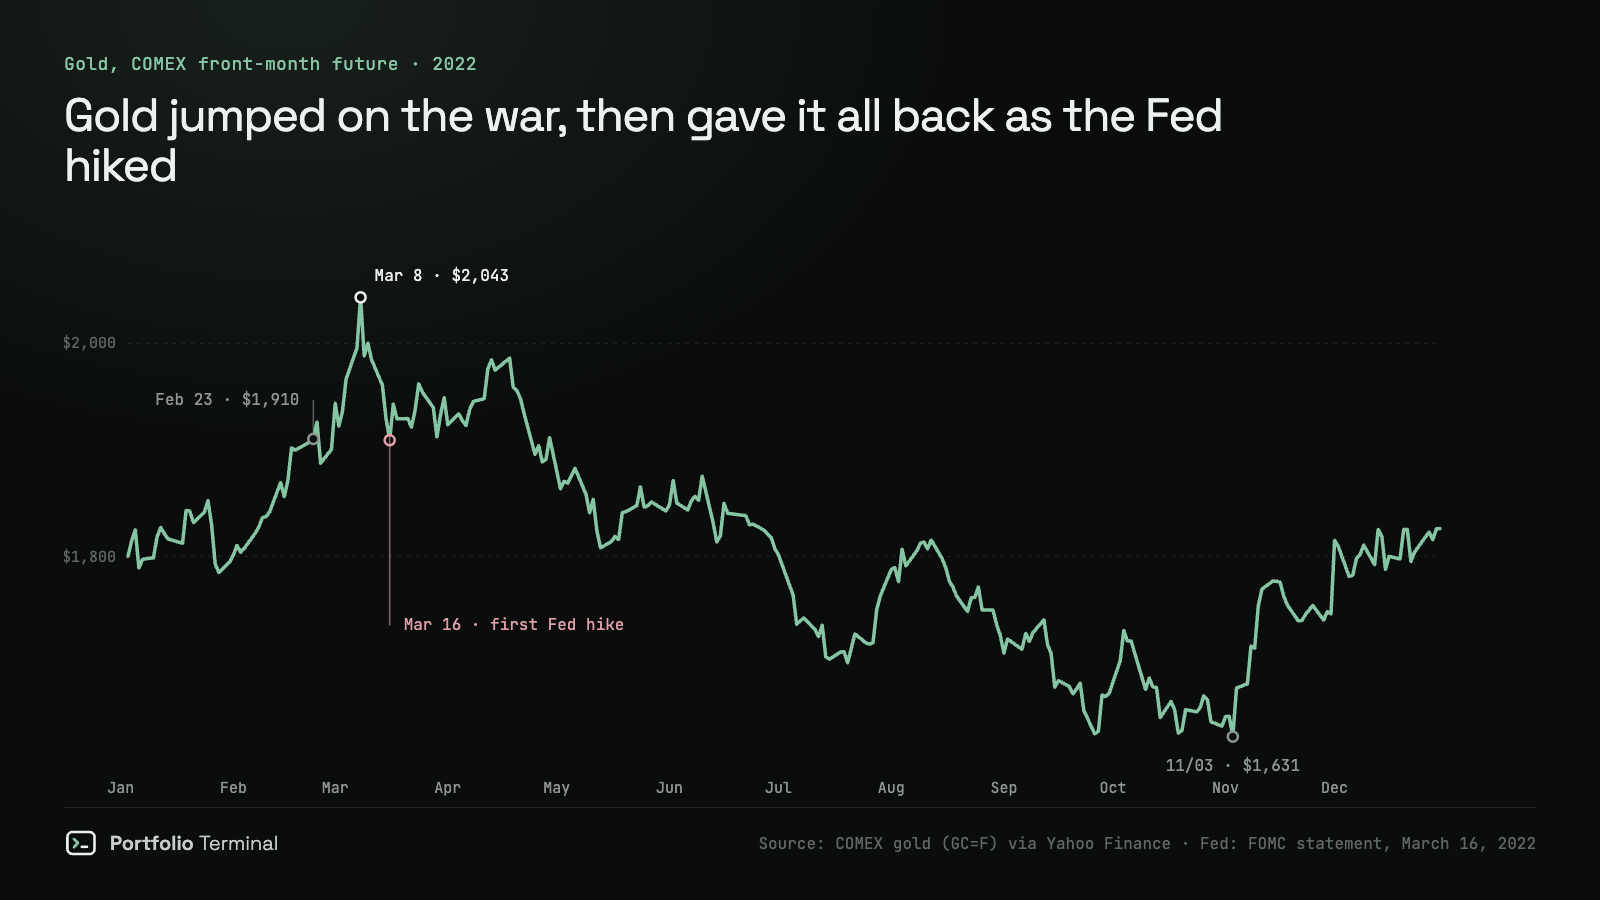
After the invasion, gold futures rose 7.0% in two weeks, to $2,043 on March 8, 2022. Then the Fed began raising rates on March 16. Gold pays no interest, so every rate hike makes holding it more expensive, and by November 3 it was at $1,631: 14.6% below its price before the war.
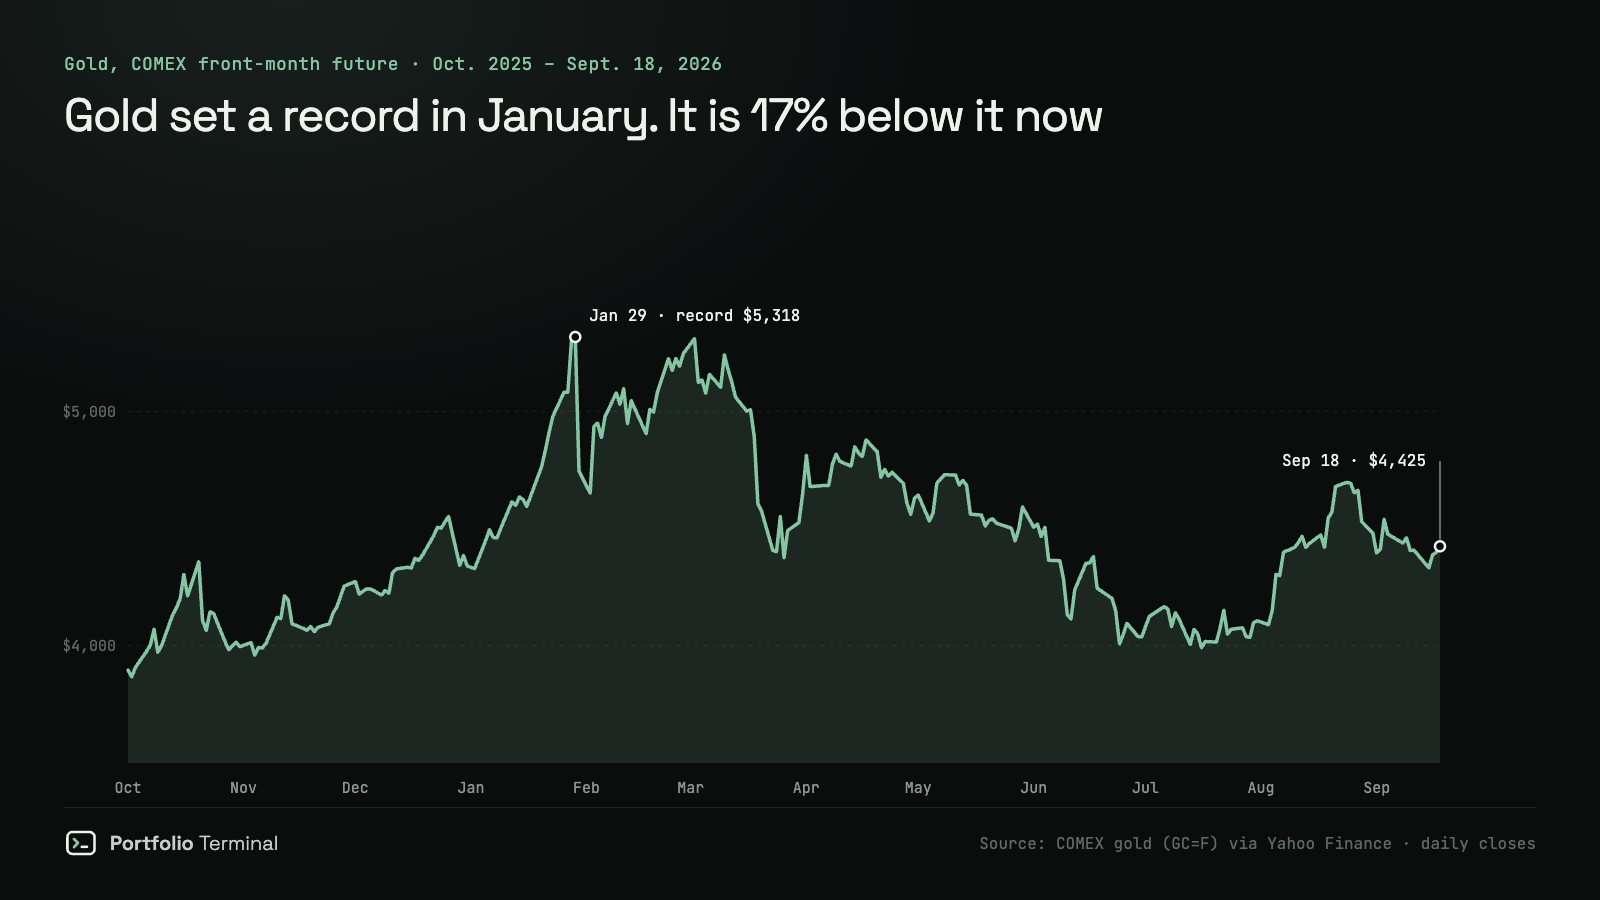
This year tells a similar story. Gold hit a record close of $5,318 on January 29, 2026. On September 18 it was at $4,425, about 17% below that record, and it fell 0.8% in the week after the pipeline strike, the same week the Fed hiked.
The slow force behind gold is not the headlines but central banks. They bought more than 1,000 tonnes a year from 2022 to 2024 and 863 tonnes in 2025, against an average of 473 tonnes a year from 2010 to 2021, according to the World Gold Council.
So gold has been a better long-run diversifier than a two-week crisis hedge. Whether it cushions a shock depends a lot on what interest rates do at the same time.
What to check in your own portfolio
You don’t need to predict the next headline to know how exposed you are. Five questions cover most of it:
- How much is energy? Producers tend to gain when oil jumps.
- How much depends on cheap fuel? Airlines, transport and chemicals feel it first.
- How much is in Europe? It usually moves first when the shock is Russia.
- How much is rate-sensitive? Long-term bonds and unprofitable growth stocks suffer if energy drags the Fed into more hikes.
- Is one holding doing most of the work? A single stock at 30% of the portfolio can outweigh everything else.
The replay above shows how your own holdings behaved in each of these shocks, and a diversification check covers the last question.
What to watch next
- The pipeline repairs: three to five weeks, according to the officials who spoke to the AP.
- Tanker traffic through Hormuz: any sign it is recovering matters more for oil than any single strike.
- The Fed on October 27–28: another hike would raise the cost of holding both gold and growth stocks.
- Europe’s peacekeeping plans for Ukraine: and how Moscow answers them.
This is general information, not investment advice. Figures are closing prices from the sources named under each chart; past shocks don’t predict future ones.
#market-news#oil#gold#russia#geopolitics
part of
next
portfolio terminal
Measure your own portfolio’s risk, not a textbook one.
Import your positions from any broker and see your volatility, beta, drawdown and correlations every morning.
Wall Street in 60s, every morning. What’s in it
One short email before the open. Unsubscribe anytime.