Stock market this week: Fed hike, 5% yields and a tech rebound
Week ending Sept. 18, 2026: the S&P 500 ended flat, the Nasdaq rose 0.7% and the Dow fell 1.7% as the Fed hiked and the 10-year yield hit 5%.

· 5 min read
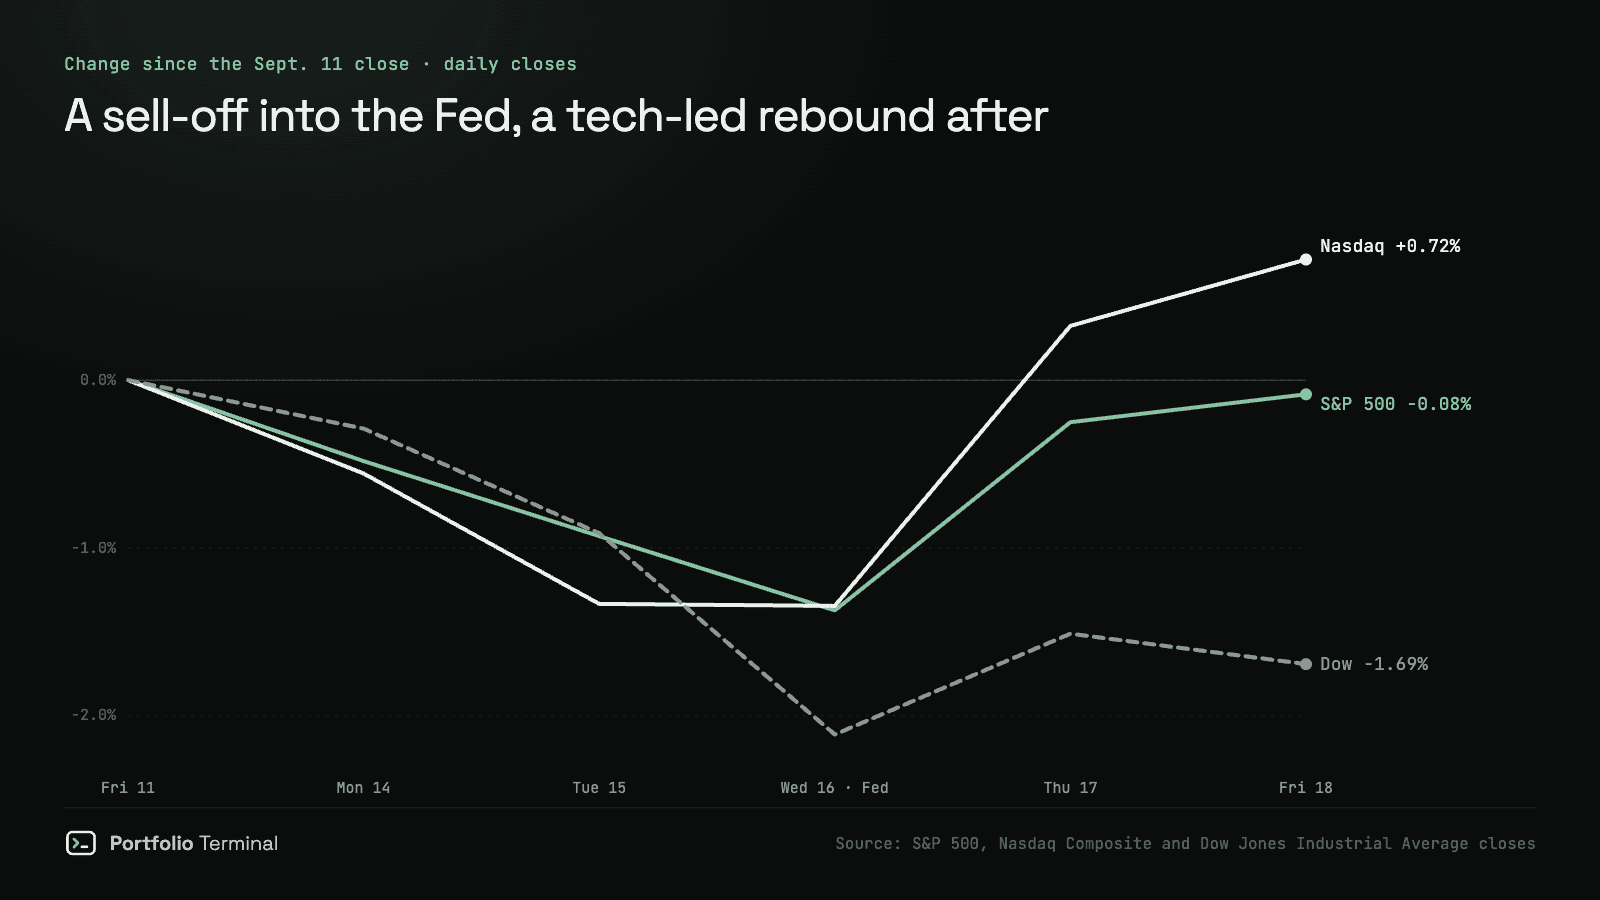
Week ending Friday, September 18, 2026. The Federal Reserve raised rates for the first time since 2023, the 10-year Treasury yield closed above 5%, and stocks slid for three days before a tech-led rebound. By Friday the S&P 500 was almost exactly where it started. Underneath that flat line, the week was anything but even.
The scorecard
| Close | Sept. 11 | Sept. 18 | Week |
|---|---|---|---|
| S&P 500 | 7,656.98 | 7,650.50 | −0.08% |
| Nasdaq | 26,333.04 | 26,522.54 | +0.72% |
| Dow | 52,573.29 | 51,682.64 | −1.69% |
| Russell 2000 | 2,903.94 | 2,860.40 | −1.50% |
| VIX | 15.84 | 14.81 | −1.03 |
| 10-year yield | 4.975% | 4.998% | +0.02 |
| Dollar index | 99.12 | 100.22 | +1.1% |
Year to date, the S&P 500 is up 11.8%, the Nasdaq 14.1% and the Dow 7.5%.
Day by day
- Monday, −0.48%. A soft start ahead of the Fed.
- Tuesday, −0.45%. Oil jumped: October WTI crude rose 4.4% to $105.83 a barrel.
- Wednesday, −0.45%. The Fed raised rates a quarter point, to 3.75%–4%. The Dow fell 1.21% and the 10-year yield closed at 5.006%, its highest close since July 2007.
- Thursday, +1.14%. The rebound. The Nasdaq rose 1.69%, led by the biggest tech names, and the 10-year yield eased to 4.947%.
- Friday, +0.17%. A quiet close to the week.
The Fed decision and what it signals for the rest of the year are in The Fed raises rates to 3.75%–4%. The bond side is in The 10-year Treasury yield tops 5%.
Sectors: rate-sensitive groups lagged
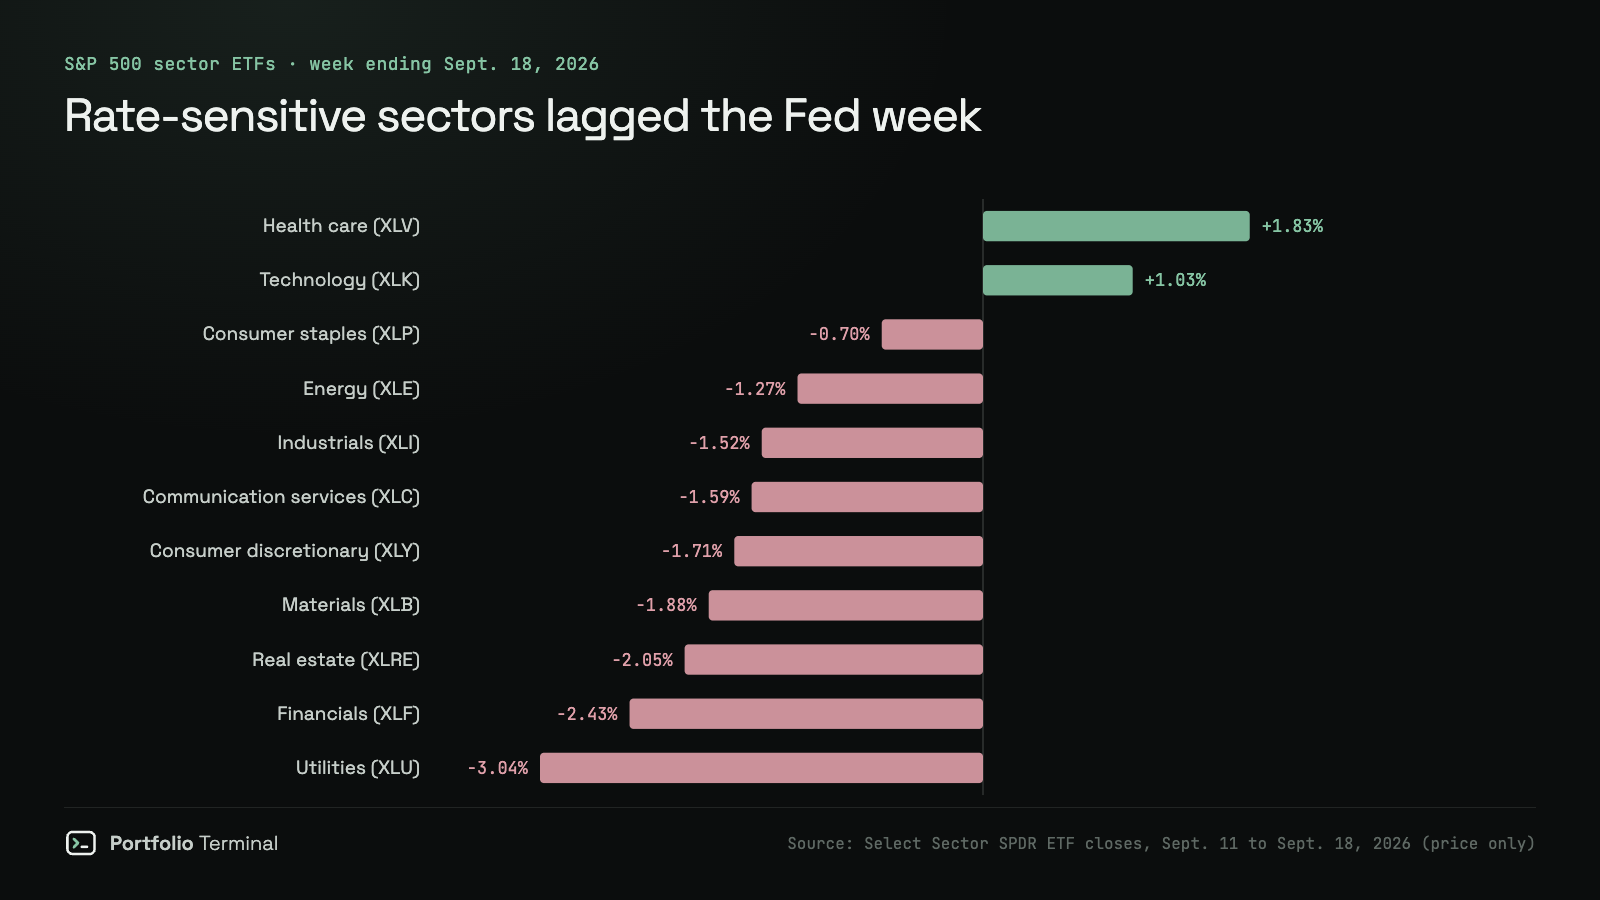
Only two of the eleven sector ETFs rose: health care (XLV), +1.83%, and technology (XLK), +1.03%. At the bottom were utilities (XLU), −3.04%, financials (XLF), −2.43% and real estate (XLRE), −2.05%.
Utilities and real estate borrow heavily and pay steady dividends that compete with bond yields, so they tend to struggle when yields climb. When a Treasury pays close to 5%, a steady dividend looks less special.
The biggest names carried the week
| Company | Week |
|---|---|
| Alphabet (GOOGL) | +3.26% |
| Meta (META) | +2.73% |
| Nvidia (NVDA) | +1.82% |
| Apple (AAPL) | +1.16% |
| Tesla (TSLA) | −0.32% |
| Microsoft (MSFT) | −0.37% |
| Amazon (AMZN) | −1.20% |
| Broadcom (AVGO) | −1.21% |
A handful of the largest companies did the lifting, while the Dow and small caps each fell about 1.5% to 1.7%. That gap is why the Nasdaq finished up and the Dow finished down in the same week. To see how the leaders compare, try Alphabet vs Meta or the Nvidia analysis; SPY vs QQQ and IWM vs SPY show how the broad market, tech and small caps have diverged over time.
Oil, the dollar, gold and bitcoin
- Oil ended roughly where it began. October WTI went from $100.05 to $100.30 after Tuesday's spike; Brent (November) slipped from $104.61 to $103.87.
- The dollar rose 1.1%, with the dollar index back above 100 as U.S. rates climbed.
- Gold edged up about 0.4%, to roughly $4,425 an ounce in futures.
- Bitcoin rose 5.2%, to about $81,200.
What a week like this means for your portfolio
A flat S&P 500 can hide a lot. If your portfolio leans on dividend stocks, utilities or real estate, this week cost you noticeably more than the index suggests. If it leans on mega-cap tech, it helped. The only way to know which is to look at what you actually hold, weighted by size, not at the index.
That is the question behind Is my portfolio actually diversified?, and drawdown monitoring shows how far your own mix has fallen from its high.
What to watch next
- Inflation. The August PCE report, the Fed's preferred gauge, is the next big data point.
- The 10-year yield at 5%. Whether it holds above that line.
- Oil and the Strait of Hormuz.
- The Fed's October 27–28 meeting. Its median projection leaves room for one more hike this year.
This weekly review is for information only. It is not investment advice. Index, ETF and futures figures are daily closes; weekly changes compare the September 11 and September 18 closes.
Sources: S&P 500 history · Nasdaq Composite history · Dow Jones history · Fed statement, Sept. 16, 2026
Get the next one in your inbox before the open.
#market-news#stock-market#sectors#interest-rates
part of
next
portfolio terminal
Measure your own portfolio’s risk, not a textbook one.
Import your positions from any broker and see your volatility, beta, drawdown and correlations every morning.
Wall Street in 60s, every morning. What’s in it
One short email before the open. Unsubscribe anytime.